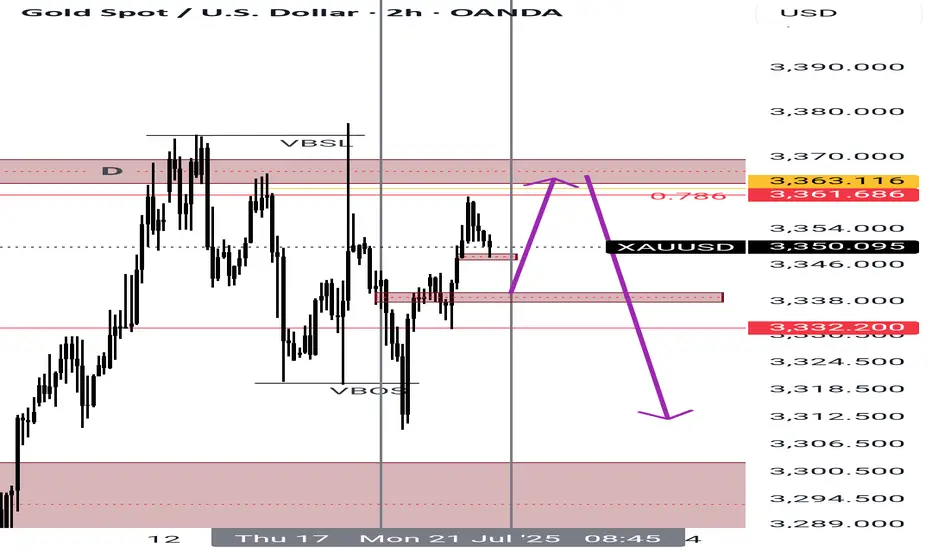
XAUUSD ANALYSISWe are waiting for the price to come to our zone demand where we look for buy UpTo the level of supply zone where we look for sell entry .
Supply and Demand

The range that will be touched in CAD/JPY It endedI provided you with this analysis that I had high confidence in.
I hope you have used this approximately 6% profit.

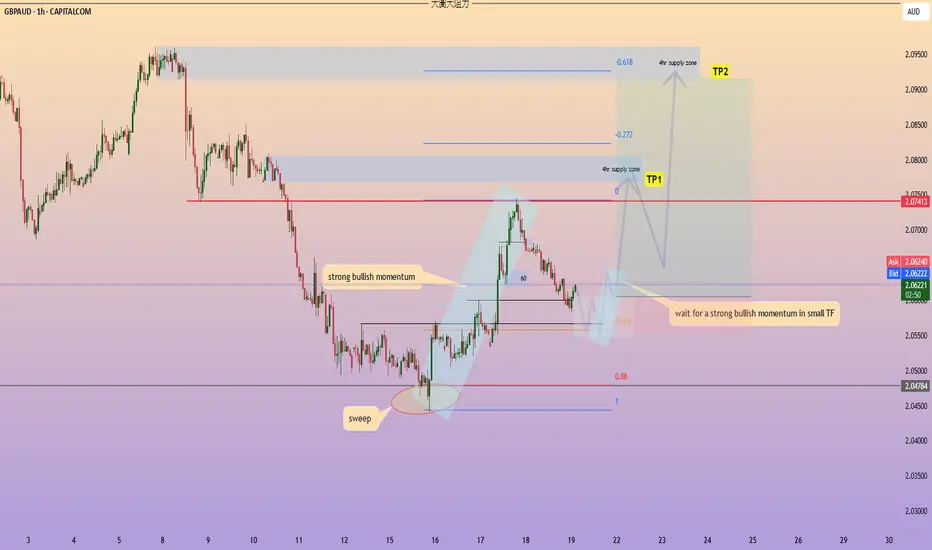
GBPAUD a bullish momentum in 1hr TFsweep happen at 2.04438
consider the price is at the bottom area in the range of D (larger TF)
if the price at 2.05599 level (0.618) appear consolidation would be perfect
need a breakout of consolidation in small TF
long entry in smaller TF
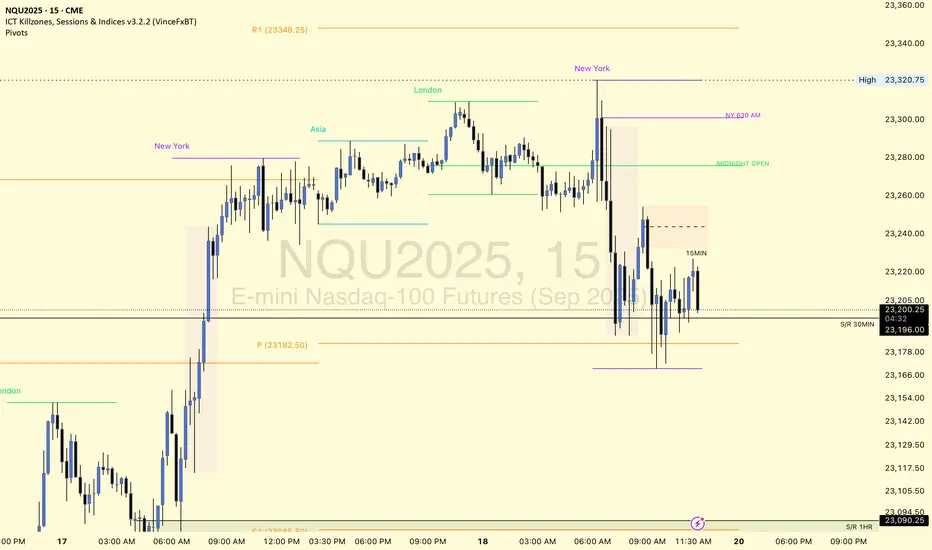
$NQ Supply and Demand Zones 7/18/25 This is for SEED_ALEXDRAYM_SHORTINTEREST2:NQ chart only, not as many supply zones with the limited timeframes I can use for TradingView free plan. This is my chart coming into next week.
However, we have so far found rejection from new ATH and making our way to retest the imbalances and previous resistance-now support levels of past supply zones.
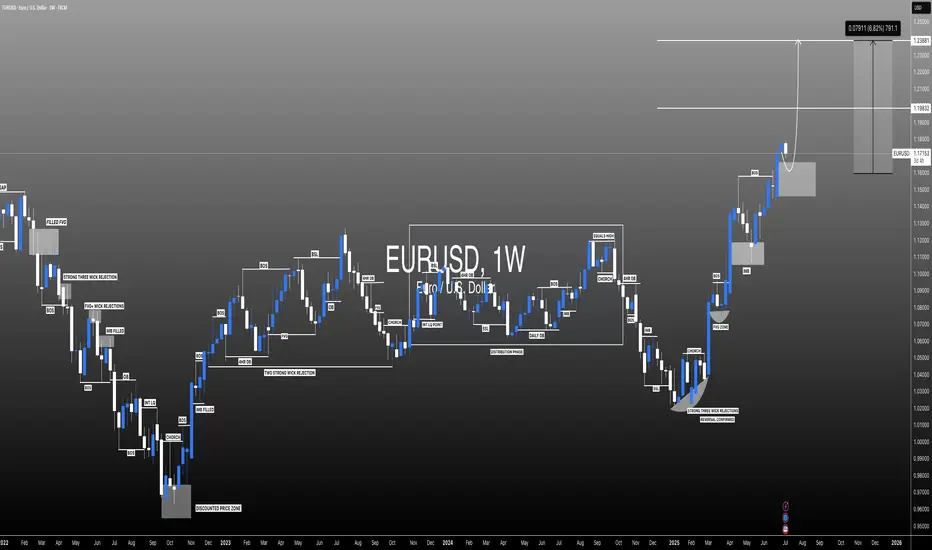
#EURUSD: Last Bullish Price Extension! Get Ready! EURUSD is approaching our buying zone, a key level, which suggests a smooth bullish reversal. As this is a swing trade, we advise keeping stop losses larger. There are two targets to keep an eye on. Remember, this is not a guaranteed move, and this is just our overview. Good luck and trade safely.
Team Setupsfx_
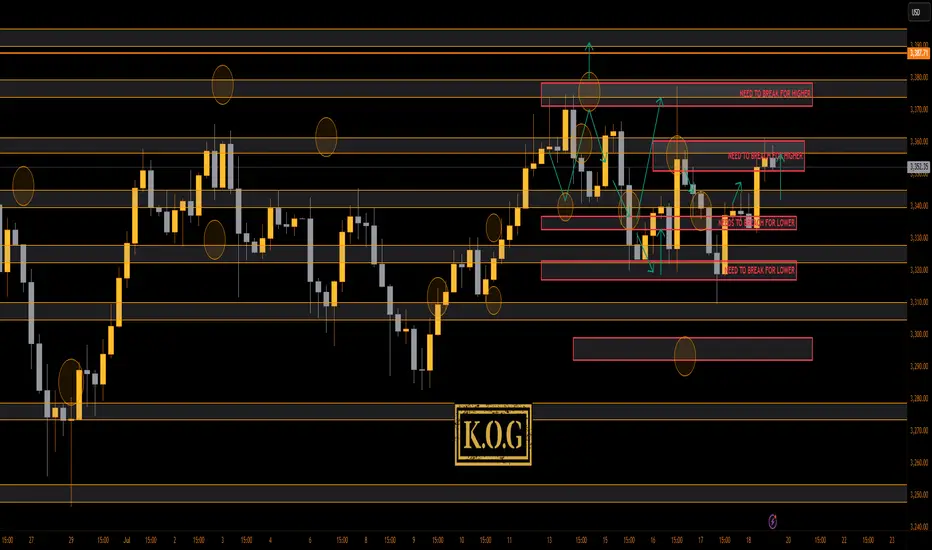
THE KOG REPORT - UpdateEnd of day update from us here at KOG:
What a week on the markets with our KOG report plan working well, the red boxes moving with price, the Excalibur targets being completed and then most of the bias level targets completing as well.
Have a look at Sundays report and compare the move and levels shared, you'll see how well we've managed to track this. Only thing we haven't got (yet) is that curve ball, so let's see how we close today and open on Sunday.
For now, support below is at the 3340 level with resistance 3370. We may just see a late session move here so play caution.
KOG’s bias for the week:
Bullish above 3350 with targets above 3360✅, 3373✅, 3375✅ and 3383 for now
Bearish below 3350 with targets below 3340,✅ 3335✅, 3329✅, 3320✅ and 3310✅ for now
RED BOX TARGETS:
Break above 3365 for 3372✅, 3375✅, 3382, 3390 and 3406 in extension of the move
Break below 3350 for 3340✅, 3335✅, 3329✅, 3322✅ and 3310✅ in extension of the move
Wishing you all a great weekend and we'll see you on Sunday for the KOG Report. Please do take some time to hit the boost button, it's very much appreciated.
As always, trade safe.
KOG
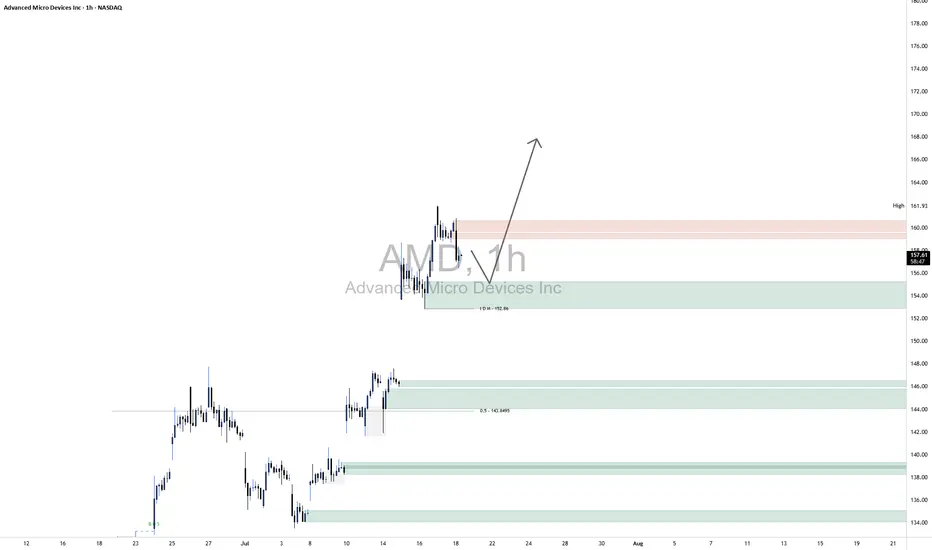
AMD LongKey Technical Insights:
Clean Rejection from Demand Zone:
Price recently tapped into a well-defined demand zone (highlighted green) around $152–$155.
The immediate bounce suggests that buyers stepped in with strength, likely absorbing sell-side liquidity.
Liquidity Grab Below Short-Term Lows:
Before the move up, price dipped just enough to trigger stops below recent lows, clearing out weak hands.
This kind of liquidity sweep is often used by smart money to build long positions before a directional push.
Current Price Action:
Price is consolidating just below a minor supply zone around $159–162.
This pause is constructive: it signals that momentum may be building for a breakout higher.
Upside Outlook (Based on Your Arrow)
Your arrow points to a bullish breakout — and that aligns well with current price structure.
Once supply near $161 is absorbed, price has a clear path to push toward the mid-160s and beyond.
The current higher-timeframe trend supports continuation, and any short-term dip into the $155–156 range may offer re-entry opportunities.
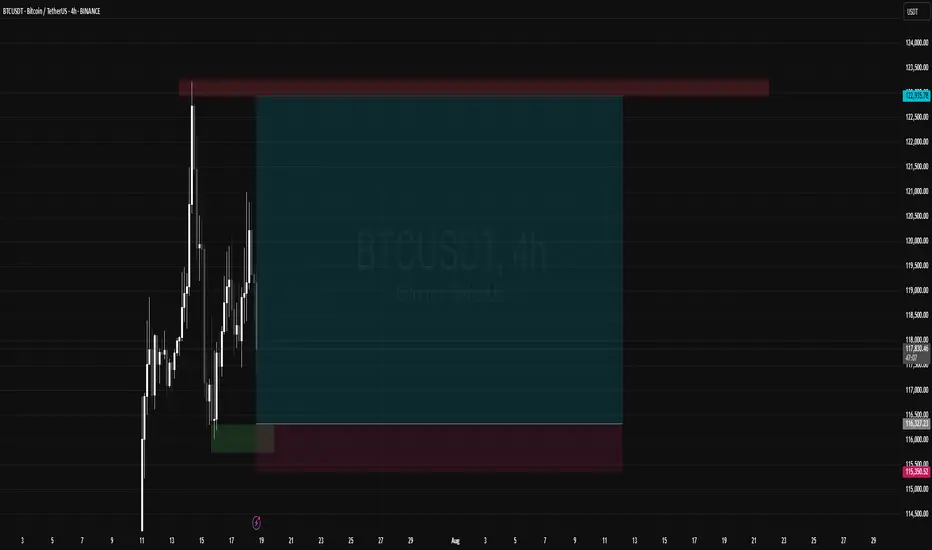
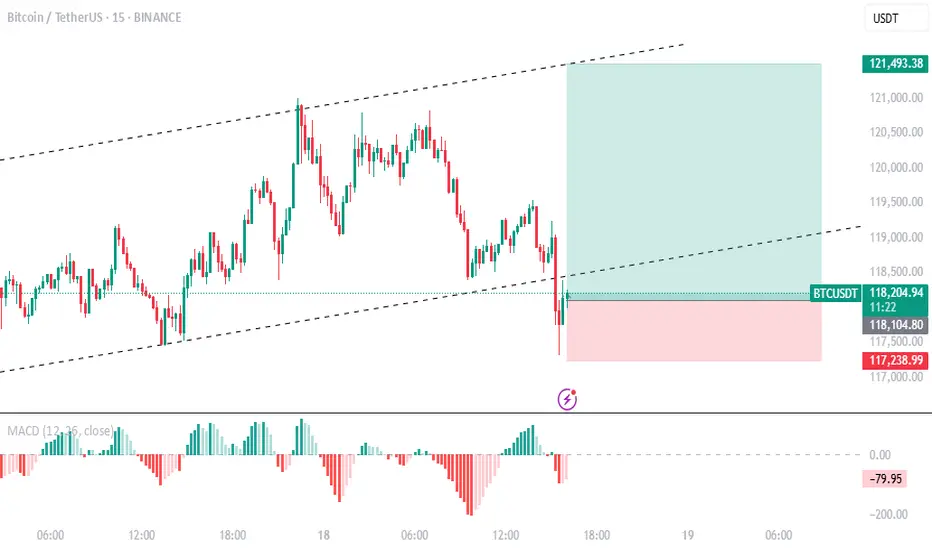
BTCUSD BUY PLAN FROM 4H DEMAND ZONEBTCUSD BUY PLAN FROM 4H DEMAND ZONE
Hence the trend is bullish we can plan for buys from demand zone.
AMZN Short1.Liquidity Landscape
Buy-Side Liquidity Cleared:
Liquidity above the recent swing high was taken — likely triggering breakout traders and stop orders from earlier shorts.
This move appears to be a classic liquidity raid before a reversal.
Sell-Side Liquidity in Focus:
Price is now targeting sell-side liquidity resting below recent higher lows (e.g., below ~222 and especially near 218.50).
This aligns with the direction of your arrow, suggesting price may hunt liquidity pools beneath internal lows.
2. Confirmation via Reaction
The strong rejection from that supply zone confirms no intent to hold price above 227, meaning that was likely a liquidity raid, not a genuine breakout.
Price has already broken below the midpoint (0.5 level at 222.85), adding confidence to the short bias.
3. Liquidity Targets Below
The next likely targets are sell-side liquidity pools resting below:
Around 218.50 (marked zone)
Deeper lows near 211–212, and potentially 208–209, where untouched demand and previous stop clusters lie.

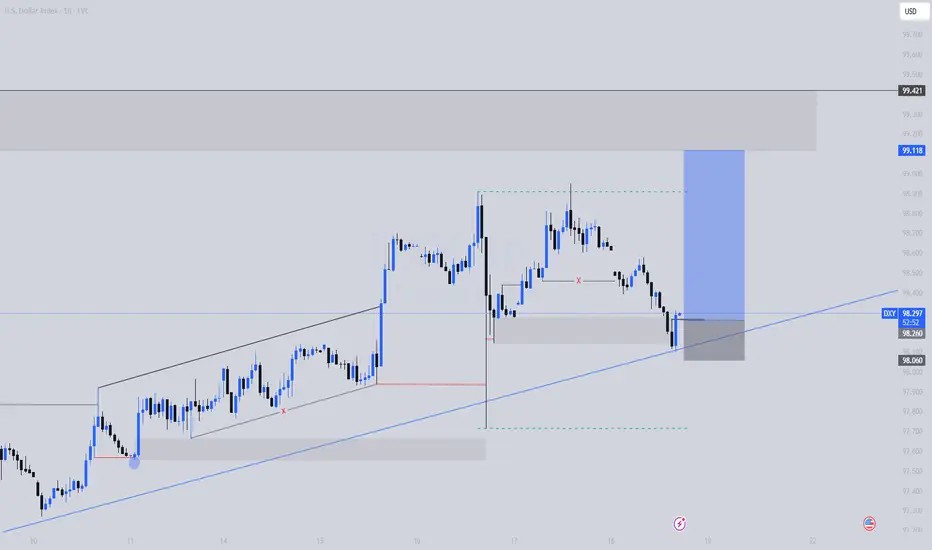
DXY LONG SETUP | Skyrocketinggggg
This is a bullish setup on the U.S. Dollar Index (DXY), taken from the 1H timeframe using Smart Money Concepts.
Price retraced into a clearly defined 1H demand zone where it also tapped a trendline support, creating a strong confluence +an LQC. The zone had internal liquidity swept and price mitigated a bullish order block, indicating potential institutional re-accumulation.
Entry was taken after bullish confirmation within the zone (engulfing candle), aligned with my SMC strategy which targets liquidity grabs and mitigation zones.
🔹 Entry: 98.06
🔹 SL: 97.83 (below the zone and structure)
🔹 TP: 99.11 (previous H1 high & clean supply zone)
🔹 RR: Approx. 4.5R
🔍 Technical Confluences:
Demand zone + OB mitigation + LQC
Trendline reaction (support respected)
Liquidity sweep + BOS (Break of Structure)
Clean imbalance above = fuel for price
Bullish engulfing as confirmation
📰 Fundamental Bias:
Today’s U.S. Jobless Claims came in better than expected, signaling labor market strength. Additionally, Retail Sales data was positive, reinforcing USD strength. These support a hawkish Fed narrative, aligning with our bullish technical setup.
Bias remains bullish unless price closes below 97.83 (invalidation level).
BTC for long *The content on this analysis is subject to change at any time without notice, and is provided for the sole purpose of assisting traders to make independent investment decisions.
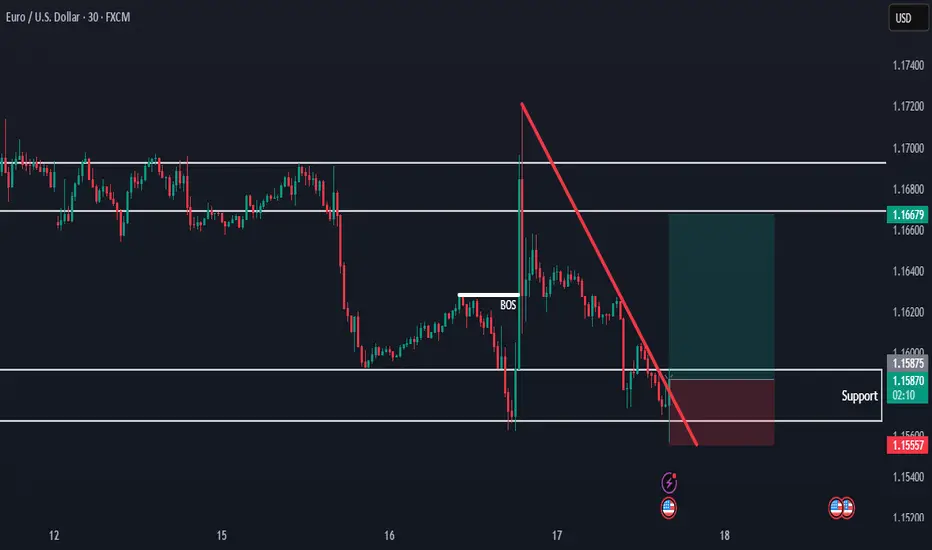
EURUSD Holding Support — Bullish Move in ProgressHello everybody!
There is a strong higher timeframe resistance now acting as support.
Price is respecting this area and starting to form a strong move to the upside.
We are looking to enter a buy position here, as the overall bullish trend is likely to continue.
eth mini scalp simple trade using order block 15minutes , but its not powerfull ob so maybe can go to our sl , just manage the risk , dyor!

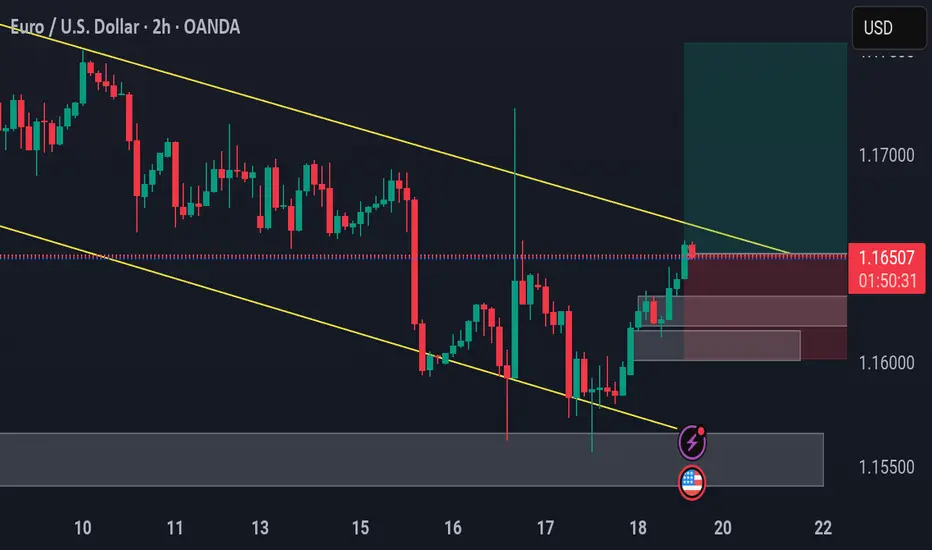
EURUSD Breakout Trade EUR/USD – Breakout Confirmation
🔹 Multi-Timeframe Bullish Setup by PULSETRADESFX
EUR/USD is showing a strong bullish shift after breaking out of a well-defined descending channel. Price reacted perfectly from the demand zone and is now pushing above descending trendline resistance across the 2H chart.
This signals early signs of trend reversal, backed by confluence across intraday and higher timeframes.
The structure is clean, the R:R is healthy, and momentum favors bulls after multiple rejections at key support.
---
✅ Confluences Supporting the Long:
Descending channel breakout (2H )
Triple demand zone rejection
Break and close above minor resistance
Clean bullish momentum candle
Economic catalysts ahead (watch USD data releases 📅)
📅 July 18, 2025
📊 FOREX.com | EUR/USD (2H)
#EURUSD #Forex #BreakoutTrade #BullishSetup #TechnicalAnalysis #TradingView #PULSETRADESFX
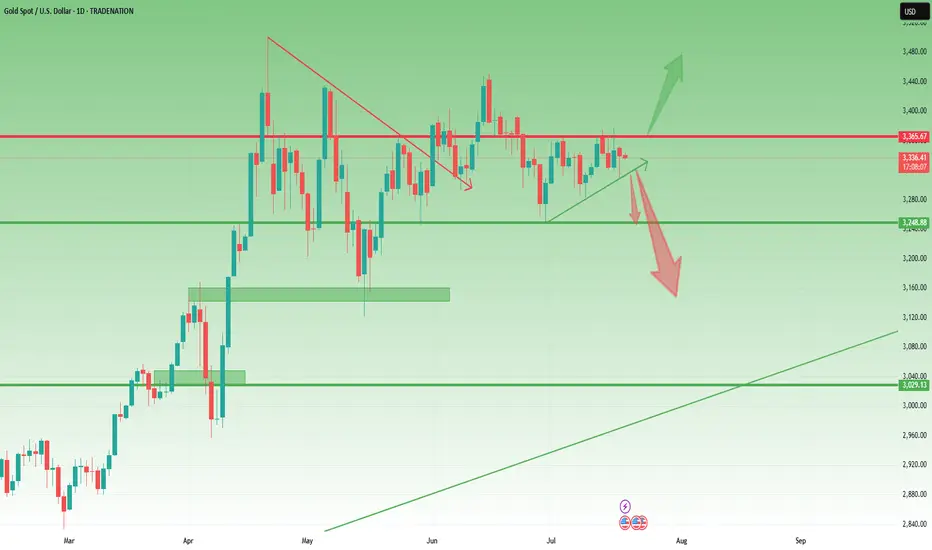
Gold- Still needs to resolve the range🔸 Still Rangebound, But Not for Long
In yesterday’s analysis, I mentioned that two scenarios are in play for Gold:
1. Bullish above 3375
2. Bearish under 3320
Throughout the session, price action leaned toward the bearish side, and I aligned with that by opening a short position. It ended with a minor loss — just 50 pips, which is negligible considering I'm looking for a potential 1,000 pip move in the bigger picture.
________________________________________
🔍 What's Next?
As the title says, Gold still needs to resolve the current range before a clear directional move unfolds.
The same key levels discussed yesterday remain valid and relevant.
And since it’s Friday, today’s daily and weekly candle close will be critical in shaping expectations for next week.
________________________________________
📈 Bullish Case: Close Above 3360
• A daily/weekly close around 3360 would bring strong pressure on the 3375 resistance.
• That could lead to a bullish breakout from the ascending triangle pattern.
• It would also leave behind a bullish weekly pin bar (last week was a bullish pin bar too).
• This scenario would bring 3450 into focus — with 3500 and even a new ATH on the table in the coming weeks.
________________________________________
📉 Bearish Case: Close Near 3300
• A close near 3300 would signal a failed rally attempt
• That would expose 3250 support short term, and 3150 medium term.
________________________________________
🧭 Final Thoughts
At the moment, I’m flat and waiting for clearer confirmation later in the day.
The next move big will be defined by the weekly close — it’s as simple as that.
P.S.: It’s just a hunch , but I’m still leaning toward a break under 3300 as the next major move.
Disclosure: I am part of TradeNation's Influencer program and receive a monthly fee for using their TradingView charts in my analyses and educational articles.
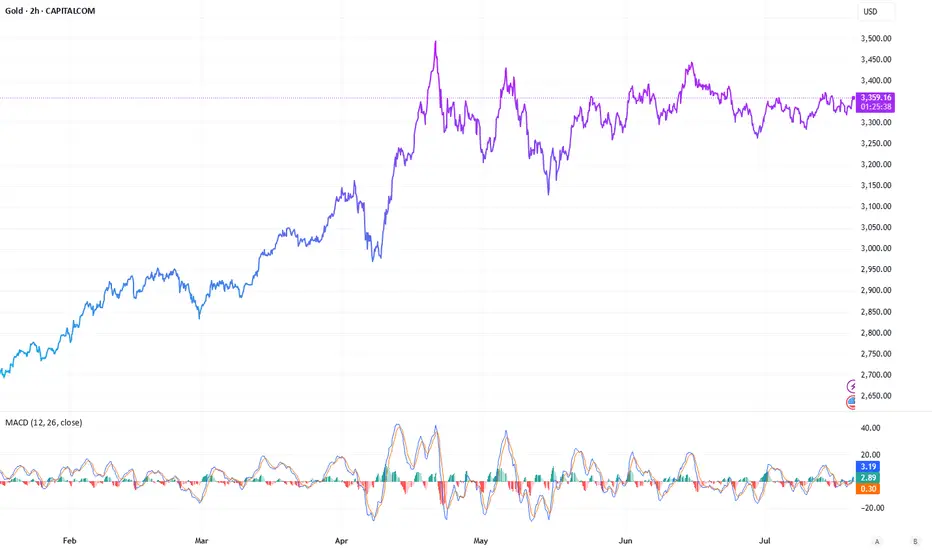
Gold’s Q2 Surge: What’s Next for the Safe Haven?The Q 2 Rally: A Response to Global Uncertainty
Gold prices hit new heights in the second quarter of year, breaching the $3,500 per ounce mark for the first time amid a wave of global instability. After climbing steadily from $2,658.04 on January 2 to $3,138.24 by April 2, the precious metal faced a brief dip below $3,000 in early April. However, it quickly rebounded, peaking at $3,434.40 on April 21 and briefly touching $3,500 during trading. By June 30, it closed at $3,303.30 showing a volatile yet upward trend driven by tariff threats, geopolitical tensions, and a shaky financial landscape.
Key Drivers Behind the Scene
The surge was sparked by U.S. tariff policies, with broad import fees announced on April 2 causing a global market panic. Investors, wary of rising 10-year bond yields as major holders sold U.S. treasuries, flocked to gold as a safer alternative. A temporary pause in tariff plans eased some pressure, but uncertainty lingered, keeping prices elevated. Geopolitical flare-ups, including Israel’s June 12 attacks on Iranian nuclear sites and ongoing regional conflicts, further bolstered demand. Central banks added to the momentum, purchasing 244 metric tons in Q1 (24% above the five-year average) and 20 metric tons in May, while retail and ETF inflows-$21 billion in North America, $6 billion in Europe, and $11 billion in Asia for the first half-signaled growing interest.
Persistent Risks and Opportunities
Experts predict that the factors fueling gold’s rise won’t fade soon. Tariff deadlines, now extended to August 1 after a July 9 reprieve, could trigger another rally if tensions escalate. I feel existing tariffs could gradually lift prices, potentially prompting the Federal Reserve to delay rate cuts, which would further boost gold demand, especially among central banks. A weaker U.S. dollar-down 11% year-to-date-also enhances gold’s appeal for international buyers, a trend, I think, will persist.
Geopolitical hotspots, including Middle East tensions and ongoing global conflicts, add to the uncertainty. Prolonged shock period, rather than the typical summer lull, suggests gold could remain a go-to safe haven. Higher inflation expectations and a fragile dollar outlook only strengthen its case.
Couple Last Words
Gold’s second quarter performance keeps holding tight its role as a hedge against uncertainty. With prices holding above $3,300 and potential catalysts like tariffs and geopolitics on the horizon, it’s a compelling option for diversification. Watch for the August 1 tariff update-it could be a key inflection point.
Ton USDT Intraday Setup / Long SetupTake with tight SL, an easy 2RR, take it at cmp (Current Market Price), While if you holding spot bag, it can easily hit 4.5-5$ mark in this week. Best Of Luck

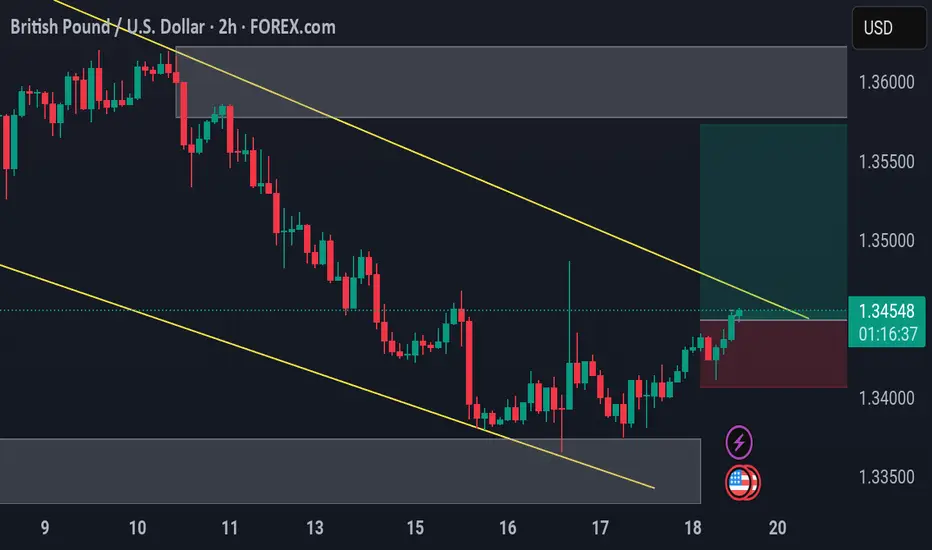
GBP/USD – Breakout Confirmation Across TimeframesGBP/USD – Breakout Confirmation Across Timeframes
🔹 Multi-Timeframe Bullish Setup by PULSETRADESFX
GBP/USD is showing a strong bullish shift after breaking out of a well-defined descending channel. Price reacted perfectly from the 1.33400–1.34060 demand zone and is now pushing above descending trendline resistance across the 2H and 4H charts.
This signals early signs of trend reversal, backed by confluence across intraday and higher timeframes.
📌 Trade Setup Details:
Entry: 1.34530 – 1.34550
SL: 1.34060 (Below demand)
TP: 1.35724 – 1.36000 (Upper supply zone / channel target)
The structure is clean, the R:R is healthy, and momentum favors bulls after multiple rejections at key support.
---
✅ Confluences Supporting the Long:
Descending channel breakout (2H & 4H)
Triple demand zone rejection
Break and close above minor resistance
Clean bullish momentum candle
Economic catalysts ahead (watch USD data releases 📅)
📅 July 18, 2025
📊 FOREX.com | GBP/USD (4H, 2H)
#GBPUSD #Forex #BreakoutTrade #BullishSetup #TechnicalAnalysis #TradingView #PULSETRADESFX
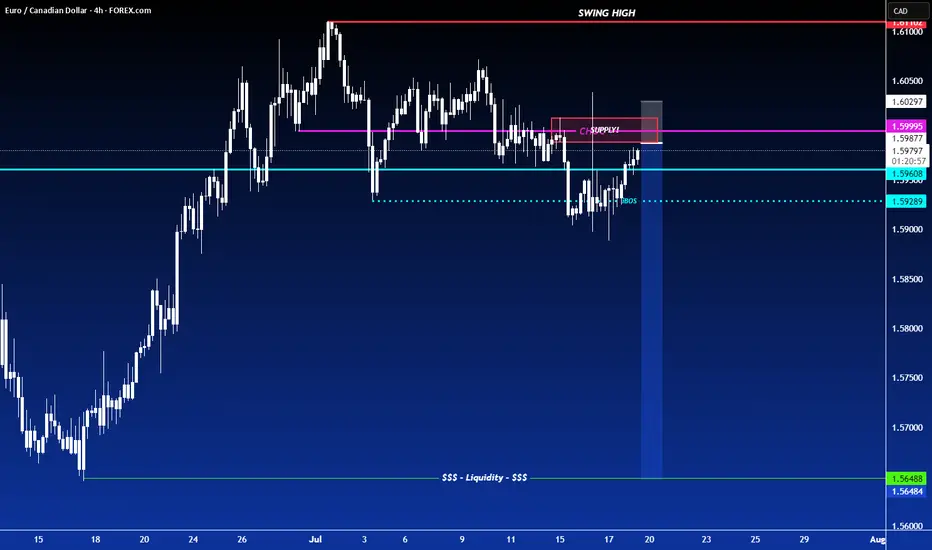
SHORT ON EUR/CADEUR/CAD has given us a nice CHOC (change of character) to the downside followed by a nice retest to supply.
I expect price to push up a little more into supply before dropping to the next support/demand level.
Looking to Catch 300-400 pips over the next few days.
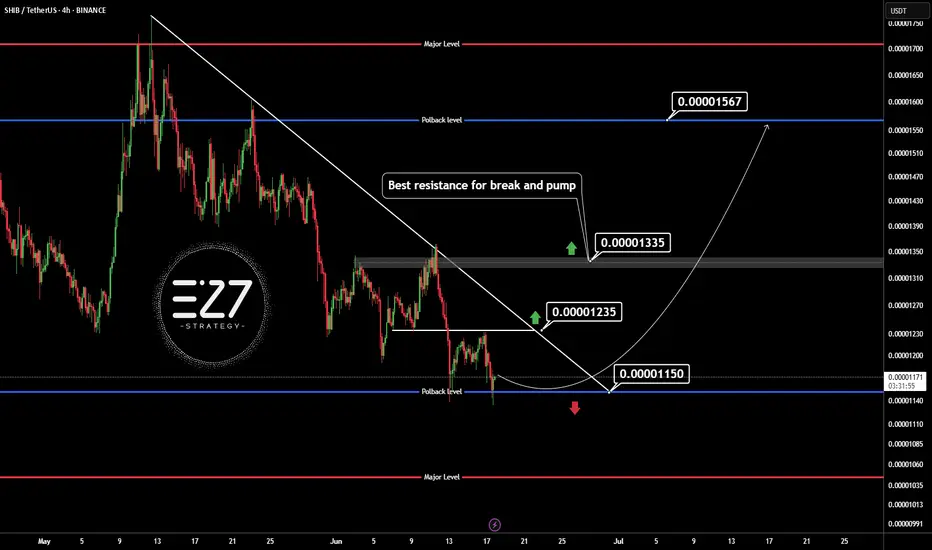
SHIBUSDT🕯 The key resistance level, identified as the best resistance for a break and pump, stands at 0.0000135, with a potential price increase to 0.00001567 if breached, serving as the next target (Pullback level). On the support side, the main level is observed at 0.0000115, and should the price fall below this, it may decline further to the lower Major Level of 0.0000100.
🔽 Resistances:
Main resistance level: 0.0000135 (potential break for pump)
Next target (Pullback level): 0.00001567
🔼 Supports:
Main support level: 0.0000115
Lower level (Major Level): 0.0000100
⚠️Contorl Risk management for trades.
GOLD! Pre-Market Analysis For Friday July 18th!In this video, we'll present pre-market analysis and best setups for Friday July 18th.
Enjoy!
May profits be upon you.
Leave any questions or comments in the comment section.
I appreciate any feedback from my viewers!
Like and/or subscribe if you want more accurate analysis.
Thank you so much!
Disclaimer:
I do not provide personal investment advice and I am not a qualified licensed investment advisor.
All information found here, including any ideas, opinions, views, predictions, forecasts, commentaries, suggestions, expressed or implied herein, are for informational, entertainment or educational purposes only and should not be construed as personal investment advice. While the information provided is believed to be accurate, it may include errors or inaccuracies.
I will not and cannot be held liable for any actions you take as a result of anything you read here.
Conduct your own due diligence, or consult a licensed financial advisor or broker before making any and all investment decisions. Any investments, trades, speculations, or decisions made on the basis of any information found on this channel, expressed or implied herein, are committed at your own risk, financial or otherwise.

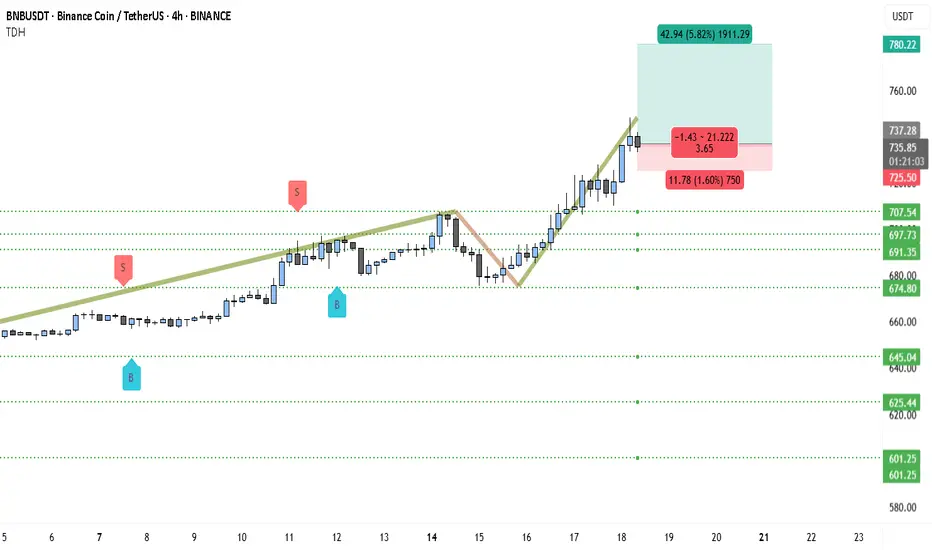
Binance Coin (BNB) to $780? Chart Says 5.8% Rally Incoming!BNBUSDT is currently showcasing a clear bullish structure, supported by consistent demand and a strong breakout beyond previous resistance zones. The price action has steadily evolved into higher highs and higher lows since July 10, confirming bullish market control.
After consolidating around the 707–710 USDT range, the pair decisively broke out, flipping this level into support. The price is now hovering near 736.50 USDT, holding its gains despite brief intraday corrections.
The ascending pattern that started from mid-July saw a short-term dip toward 675 USDT, but strong buying interest quickly stepped in. This bounce marked the formation of a new swing low, followed by a powerful rally above the previous resistance.
The recent long-bodied bullish candles reflect strong momentum and possible accumulation by larger players. Buy and sell signals shown on the chart further validate the demand zone around 674–691 USDT, where bulls aggressively defended support.
The breakout structure is now entering a price discovery phase, with room for a measured move toward the upper resistance near 780 USDT, which is both a psychological round number and the projected Fibonacci extension zone.
________________________________________
📍 Trading Setup (Based on Chart)
• Entry Price: 736.50 USDT (current market price)
• Stop-Loss: 725.00 USDT (just below the recent structure low and horizontal support)
• Take-Profit: 780.22 USDT (Fibonacci target + psychological resistance)
• Risk: 11.78 USDT (~1.60%)
• Reward: 42.94 USDT (~5.82%)
• Risk-Reward Ratio: ~3.65 — favorable for swing-long positions
________________________________________
🧭 Key Zones to Watch
The support zone between 707.54 and 691.35 USDT is now the major demand base. As long as BNBUSDT holds above this area, the bullish thesis remains intact. A retest of this level followed by a bounce would further strengthen the ongoing uptrend.
Immediate resistance is at 737.28 USDT, but the market is attempting to flip this level. If it holds as support on the next retest, upside continuation to 780.22 USDT becomes highly probable.
If bulls fail to defend the 725 USDT level, we could see a deeper retracement toward 707 or 691 USDT, but currently that risk remains low given the strength of the latest breakout.