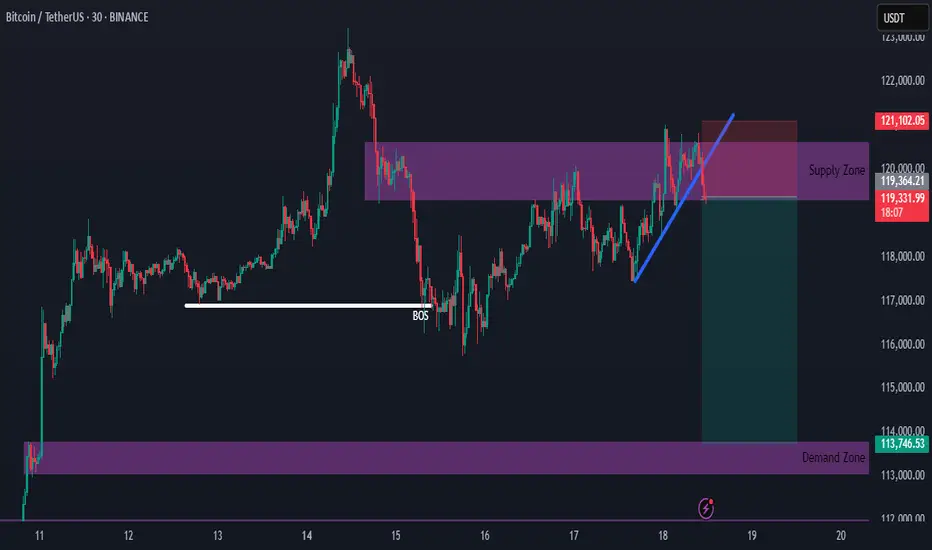
Bitcoin Supply Zone Intact — New Short Setup DevelopingHello everybody!
The supply zone we discussed in the previous idea is still holding.
We have a new opportunity to go short upon the break of the upward trendline.
The most likely target is around 114,000.
Supply and Demand
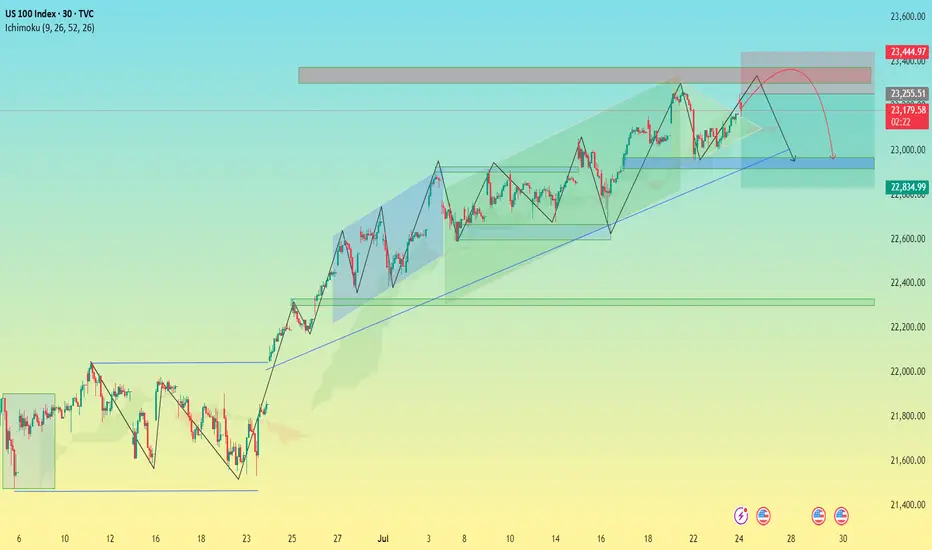
US100 Index – Potential Bearish Reversal in Key Resistance Zone🧠 US100 Index – Potential Bearish Reversal in Key Resistance Zone
Timeframe: 30-Minute | Chart Published: July 24, 2025
---
🔍 Overview
The US100 (NASDAQ) has been trading in a well-structured ascending channel, forming higher highs and higher lows. However, recent price action suggests that the index is testing a critical supply zone near 23,400, with signs of weakening bullish momentum. This may signal a potential corrective phase or bearish reversal.
---
📈 Technical Analysis Breakdown
🔵 Trend Structure:
Price is respecting a clear ascending trendline (blue), connecting multiple higher lows.
Multiple bullish flag/channel formations have been completed within the uptrend, showing healthy momentum until the current point.
🟥 Resistance Zone:
Strong supply zone marked between 23,250 – 23,450.
Price action shows stalling candles and rejection wicks within this zone, indicating buyer exhaustion.
⚠ Bearish Patterns:
The red path projection suggests a head and shoulders-like structure forming at the top of the channel.
This, along with divergence in wave strength and shrinking momentum, supports a potential reversal.
🔵 Key Support:
First support lies around 23,000 — aligning with the ascending trendline and previous consolidation.
If broken, next demand zone is around 22,835 – 22,900, where historical consolidation took place.
---
🔁 Projected Scenario (as per visual path)
1. Price may attempt one last push into the 23,400–23,450 zone (possible false breakout).
2. Rejection from this level could trigger a fall toward the ascending trendline support.
3. A confirmed break of the trendline can lead to a larger correction toward the 22,800 zone.
---
🧠 Unique Insight
This chart combines multi-timeframe structure recognition with a real-time reversal formation inside a long-standing bullish trend. The analysis doesn’t just rely on textbook patterns—it recognizes real-time price behavior shifts, which makes it valuable for proactive traders.
---
📌 Conclusion
While the trend remains bullish overall, caution is warranted as the US100 approaches a historically significant resistance zone. The setup offers a compelling risk-reward short opportunity for aggressive traders, especially if the price confirms a break below trendline support.
---
🔧 Next Steps for Viewers
> “Watch for a clean rejection candle or lower high at resistance before entering short. If trendline breaks cleanly, 22,835 could be the next target zone.”
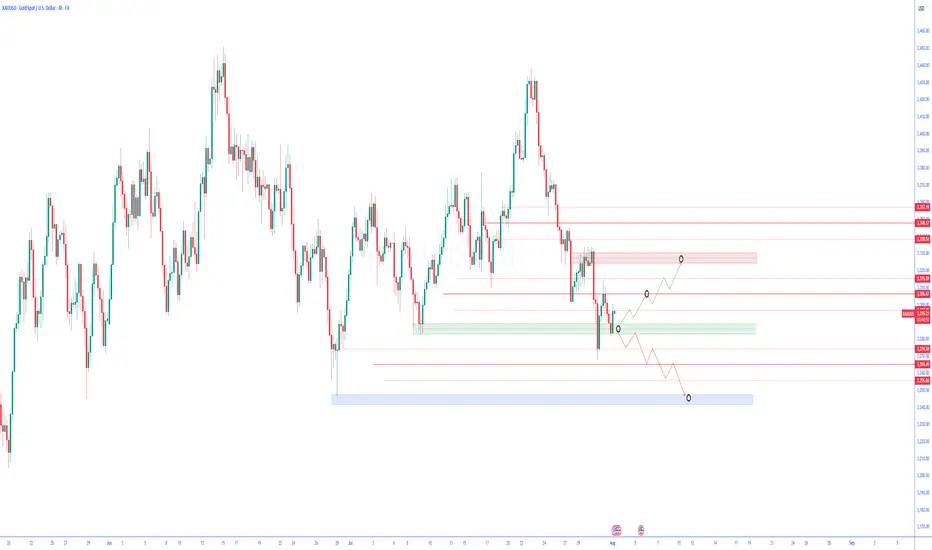
Technical Analysis of Gold Chart (XAU/USD) – 4-Hour TimeframeTechnical Analysis of Gold Chart (XAU/USD) – 4-Hour Timeframe
Following the heavy selling pressure seen in recent days, the price of gold has now reached a zone that has repeatedly shown reactions in the past. This green-colored support area can currently play a decisive role in the market’s next move.
Price Movement Outlook:
Scenario 1 – Bullish Correction Move:
If buyers manage to take control of the market in this zone, it is expected that gold will gradually pass through intermediate resistance levels and first enter the medium-term resistance area. If momentum is maintained, the price could then move toward higher highs. This move can be interpreted as a technical correction against the recent bearish wave and may attract short-term traders until reaching strong supply zones.
Scenario 2 – Continuation of the Downtrend:
Conversely, a confirmed break of this support with high volume and strong bearish candles could lead to a further decline in price toward previous lows. In this case, the blue-colored area at the lowest part of the chart would serve as the next demand zone.
Key Point:
The market is currently in a decision-making phase. Confirmation of reactions at this support area is extremely important in determining the market’s future direction. Therefore, entering the market prematurely without waiting for confirmation of price behavior could involve high risk.
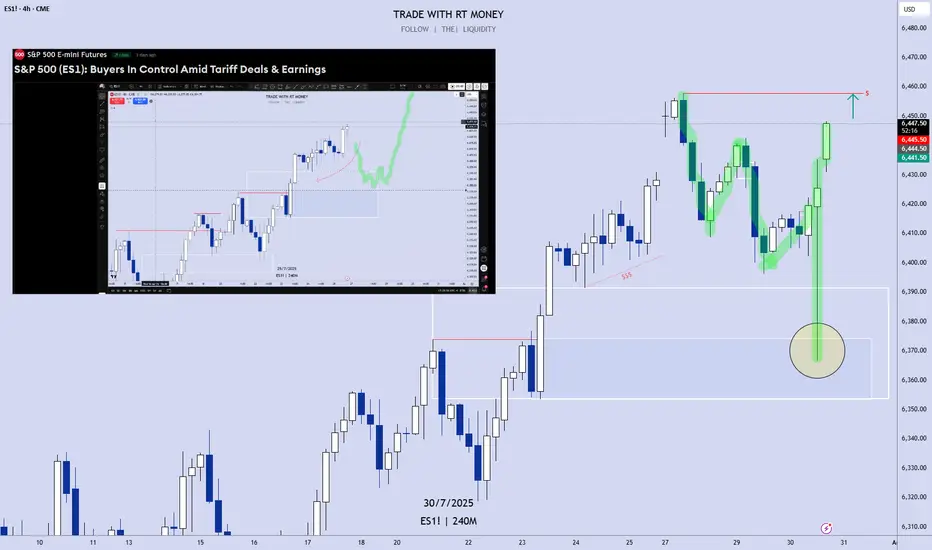
S&P 500 (ES1): Post FOMC, Buyers Pushing Back To The Highs!In this video, we will analyze the following FX market for July 31 - Aug 1st.
S&P 500 (ES1!)
In the Weekly Forecast for the S&P 500, we highlighted:
- price is bullish, and expected to go higher. It did move to ATH before pulling back.
- the sell side liquidity under the ascending lows would draw price.... which it did.
- the Area of Fair Value below the lows, with the Demand Zone as the potential level where a
a high probability long could setup.... which was spot on!
Did you benefit from the forecast? Let me hear from you if you did, in the comment section.
Enjoy!
May profits be upon you.
Leave any questions or comments in the comment section.
I appreciate any feedback from my viewers!
Like and/or subscribe if you want more accurate analysis.
Thank you so much!
Disclaimer:
I do not provide personal investment advice and I am not a qualified licensed investment advisor.
All information found here, including any ideas, opinions, views, predictions, forecasts, commentaries, suggestions, expressed or implied herein, are for informational, entertainment or educational purposes only and should not be construed as personal investment advice. While the information provided is believed to be accurate, it may include errors or inaccuracies.
I will not and cannot be held liable for any actions you take as a result of anything you read here.
Conduct your own due diligence, or consult a licensed financial advisor or broker before making any and all investment decisions. Any investments, trades, speculations, or decisions made on the basis of any information found on this channel, expressed or implied herein, are committed at your own risk, financial or otherwise.
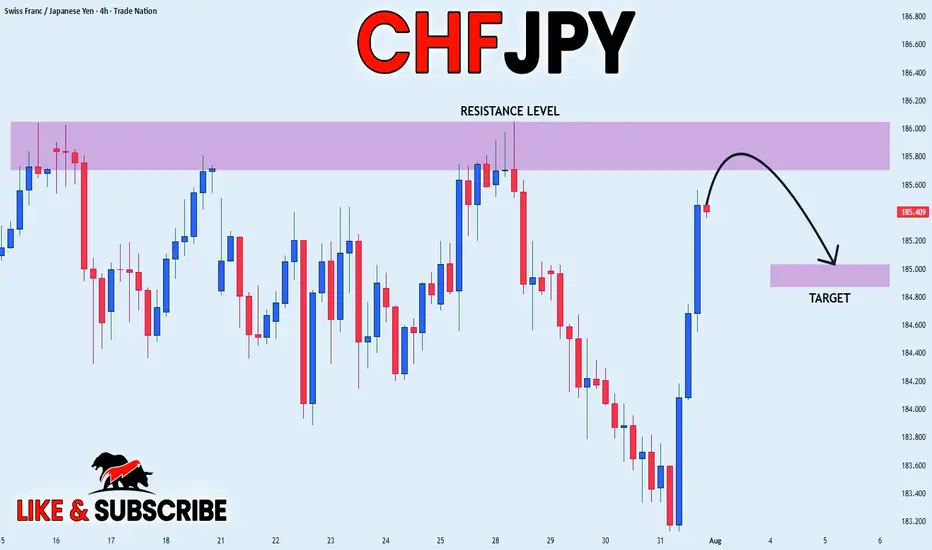
CHF_JPY LOCAL SHORT|
✅CHF_JPY has been growing recently
And the pair seems locally overbought
So as the pair is approaching a
Horizontal resistance of 186.000
Price decline is to be expected
SHORT🔥
✅Like and subscribe to never miss a new idea!✅
Disclosure: I am part of Trade Nation's Influencer program and receive a monthly fee for using their TradingView charts in my analysis.
AUDCADThe price is currently at a key level. We need confirmation on the 15-minute or 5-minute timeframe before considering a long entry.
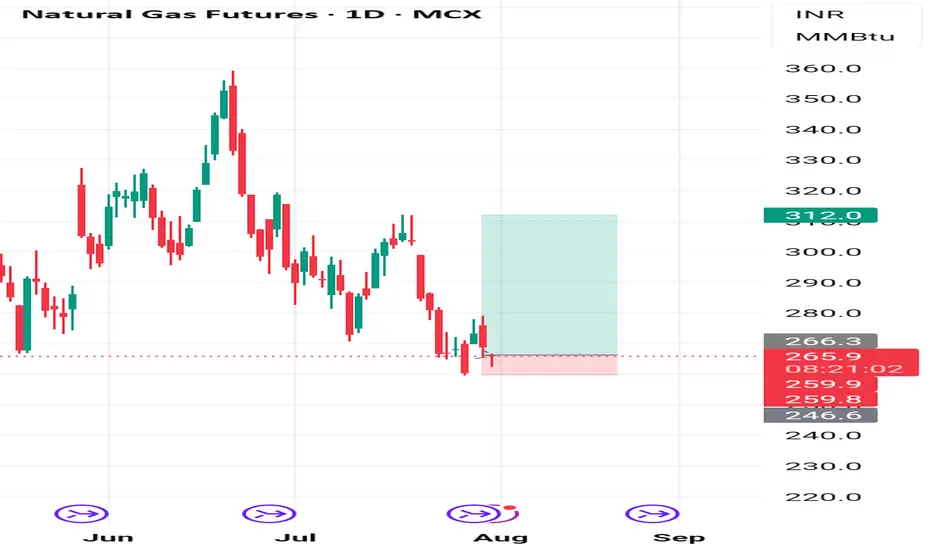
NatGas short term long opportunity Natgas MCX future may go upside target of 300+ from Cmp - 265 , SL - 259. If Buyer Accumulate and sustain level of 265 . Time horizon - 4-6 weeks
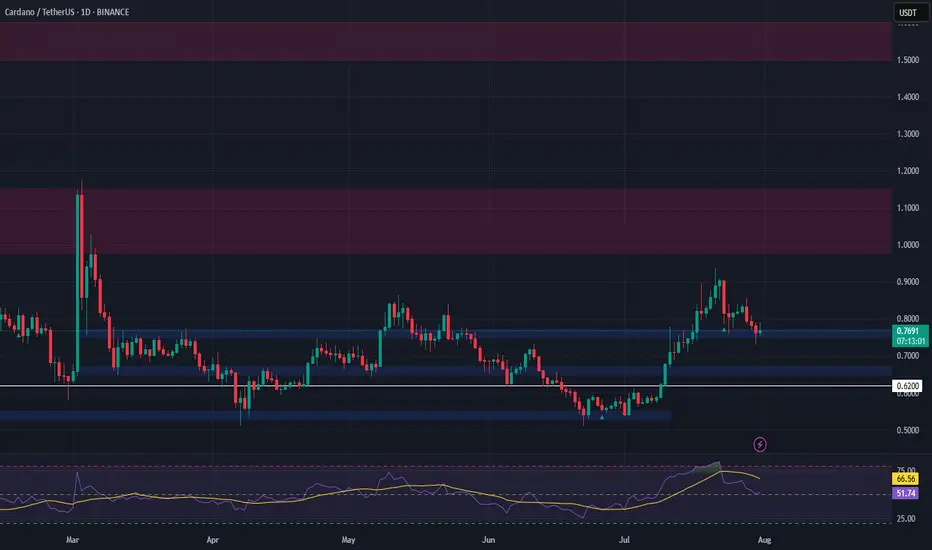
ADA Setup – Eyeing Entry After 70%+ RallyCardano (ADA) has surged over 70% in recent weeks. A healthy pullback is underway, and we’re watching the key support zone for a potential long entry targeting the next leg higher.
📌 Trade Setup:
• Entry Zone: $0.65 – $0.67
• Take Profit Targets:
o 🥇 $0.98 – $1.15
o 🥈 $1.50 – $1.60
• Stop Loss: Just below $0.62
XAUUSD: BUYThere are some good trading opportunities in the market. That's when to buy. Gold prices haven't fallen further since falling back to 3390. There's no further negative news. Therefore, there won't be a significant short-term decline. Our focus will be on tomorrow's non-farm payroll data update. This is a crucial factor that can cause gold prices to rise or fall significantly in the short term.
I'll update you with real-time buy and sell opportunities. This is based on research from the Swing Trading Center. It's highly authoritative. Don't miss out! Remember to stay tuned.
XAUUSD: BUY 3292-3282 TP 3320. SL 3265

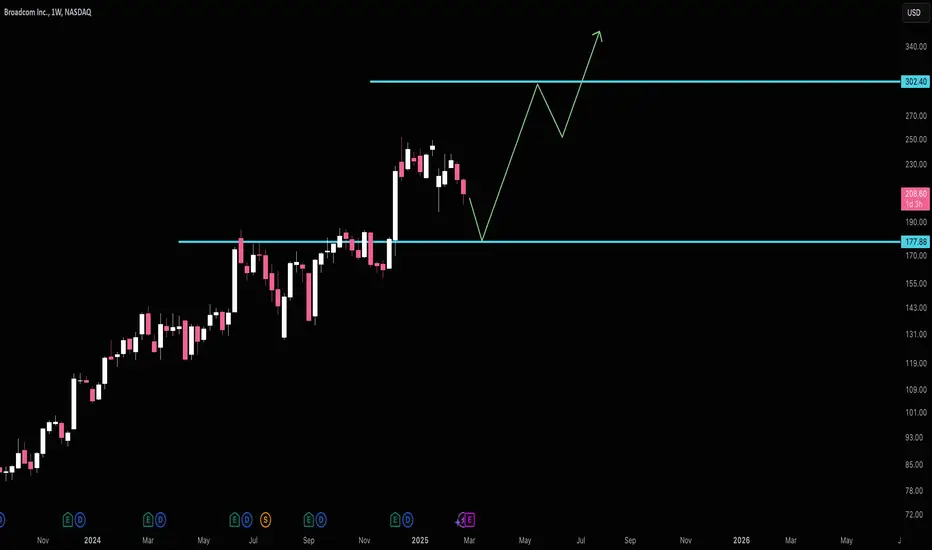
Broadcom Middle of Range RisksI like Broadcom if it gets down to $178. Right now it's still floating from the AAPL news. I wouldn't be inclined to sell here, but if looking to buy (like myself) I'd wait in hopes for $178.
Target (Potential Next Support) $302.
Good luck!
USDJPY: The Fed & BOJ Likely To Keep Rates In Place. Buy It!Welcome back to the Weekly Forex Forecast for the week of July 28 - Aug 1st.
In this video, we will analyze the following FX market:
USDJPY
The FED and BOJ are expected to keep their perspective interest rates, come Wednesday. The USD is stabilizing, a US-Japanese tariff deal inked, and investors are slowing moving money from the Yen safe haven to riskier assets.
Look for USDJPY to slowly move higher.
Enjoy!
May profits be upon you.
Leave any questions or comments in the comment section.
I appreciate any feedback from my viewers!
Like and/or subscribe if you want more accurate analysis.
Thank you so much!
Disclaimer:
I do not provide personal investment advice and I am not a qualified licensed investment advisor.
All information found here, including any ideas, opinions, views, predictions, forecasts, commentaries, suggestions, expressed or implied herein, are for informational, entertainment or educational purposes only and should not be construed as personal investment advice. While the information provided is believed to be accurate, it may include errors or inaccuracies.
I will not and cannot be held liable for any actions you take as a result of anything you read here.
Conduct your own due diligence, or consult a licensed financial advisor or broker before making any and all investment decisions. Any investments, trades, speculations, or decisions made on the basis of any information found on this channel, expressed or implied herein, are committed at your own risk, financial or otherwise.

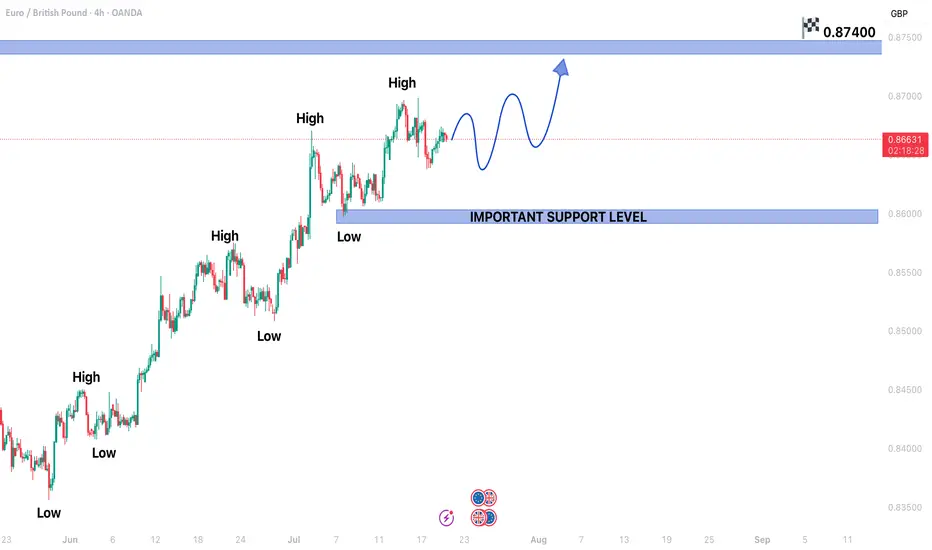
EURGBP CONTINUING BULLISH TREND STRUCTUREEURGBP CONTINUING BULLISH TREND STRUCTURE IN 4H TIME FRAME.
Price is currently in a secondary trend.
Price is expected to end the secondary trend and start primary trend again.
On higher side market may hit the targets of 0.87400
On lower side 0.85950 may act as a key support level.
HEAD & SHOULDER PATTERN SPOTTED IN EUR/CADHEAD & SHOULDER PATTERN SPOTTED IN EUR/CAD.
Price is expected to remain bearish in upcoming trading sessions.
On higher side 1.61100 level may act as a key resistance level.
On lower side market may hit the target of 1.58150.

LONG ON EUR/USDEUR/USD is currently at a major demand level after sweeping sell side liquidity.
The Dxy (Dollar) is overall bearish. I expect the dollar to fall and EUR/USD to rise to the previous high / supply level for over 200-300 pips.
News most likely will affect this pair in terms of volatility.

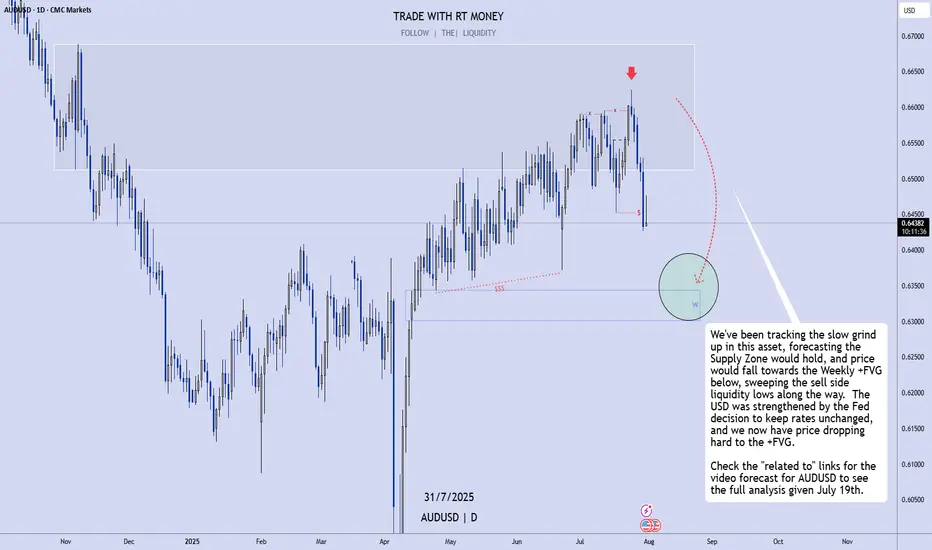
AUDUSD: Dropping To the Weekly FVG, As Expected!In this video, we will analyze the following FX market for July 31 - Aug 1st.
AUDUSD
Been waiting and watching for this move, and we've tracked it for weeks! It's happening now!
Look for it to continue until we reach the +FVG!
Enjoy!
May profits be upon you.
Leave any questions or comments in the comment section.
I appreciate any feedback from my viewers!
Like and/or subscribe if you want more accurate analysis.
Thank you so much!
Disclaimer:
I do not provide personal investment advice and I am not a qualified licensed investment advisor.
All information found here, including any ideas, opinions, views, predictions, forecasts, commentaries, suggestions, expressed or implied herein, are for informational, entertainment or educational purposes only and should not be construed as personal investment advice. While the information provided is believed to be accurate, it may include errors or inaccuracies.
I will not and cannot be held liable for any actions you take as a result of anything you read here.
Conduct your own due diligence, or consult a licensed financial advisor or broker before making any and all investment decisions. Any investments, trades, speculations, or decisions made on the basis of any information found on this channel, expressed or implied herein, are committed at your own risk, financial or otherwise.
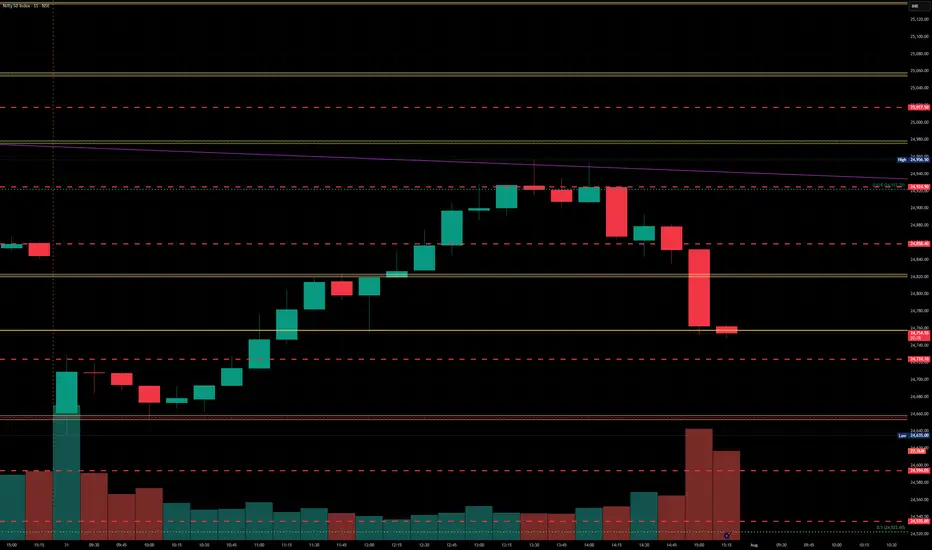
Nifty levels - Aug 01, 2025Nifty support and resistance levels are valuable tools for making informed trading decisions, specifically when combined with the analysis of 5-minute timeframe candlesticks and VWAP. By closely monitoring these levels and observing the price movements within this timeframe, traders can enhance the accuracy of their entry and exit points. It is important to bear in mind that support and resistance levels are not fixed, and they can change over time as market conditions evolve.
The dashed lines on the chart indicate the reaction levels, serving as additional points of significance to consider. Furthermore, take note of the response at the levels of the High, Low, and Close values from the day prior.
We hope you find this information beneficial in your trading endeavors.
* If you found the idea appealing, kindly tap the Boost icon located below the chart. We encourage you to share your thoughts and comments regarding it.
Wishing you success in your trading activities!
BankNifty levels - Aug 01, 2025Utilizing the support and resistance levels of BankNifty, along with the 5-minute timeframe candlesticks and VWAP, can enhance the precision of trade entries and exits on or near these levels. It is crucial to recognize that these levels are not static, and they undergo alterations as market dynamics evolve.
The dashed lines on the chart indicate the reaction levels, serving as additional points of significance. Furthermore, take note of the response at the levels of the High, Low, and Close values from the day prior.
We trust that this information proves valuable to you.
* If you found the idea appealing, kindly tap the Boost icon located below the chart. We encourage you to share your thoughts and comments regarding it.
Wishing you successful trading endeavors!

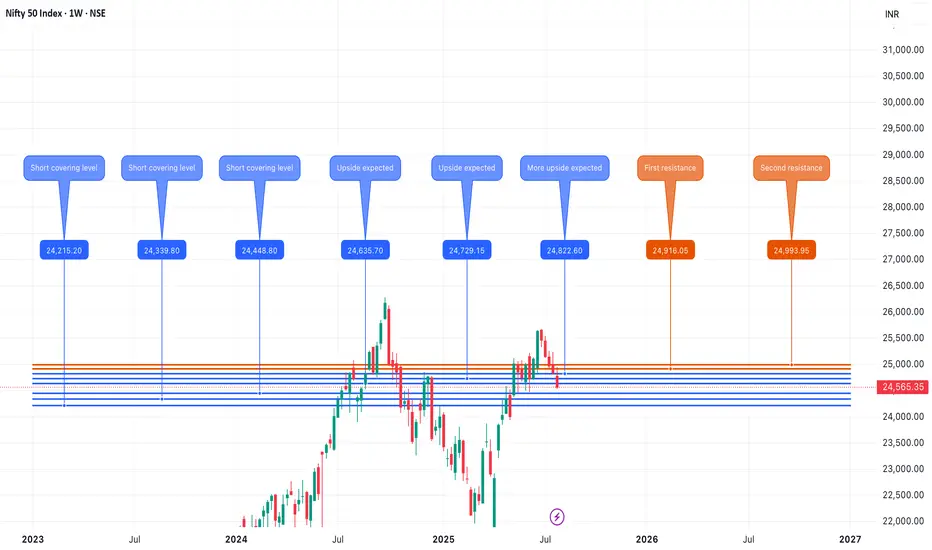
Nifty August 1st week analysisThe Nifty index looks positive for the upcoming week, despite global uncertainties and tariffs. This is a bold take, but my chart analysis supports it. The charts do not indicate a fall below 24,200 in the coming week. Three short-covering levels are marked: 24,448, 24,339, and 24,215. On the upside, a key level to watch is 24,635. If Nifty crosses and sustains above 24,635, we can expect upward momentum to continue toward 24,900–25,000. All levels are marked in the chart posted.
Kion Group AG Quote | Chart & Forecast SummaryKey Indicators On Trade Set Up In General
1. Push Set Up
2. Range Set Up
3. Break & Retest Set Up
Notes On Session
# Kion Group AG Quote
- Double Formation
* (Diagonal Shift)) - *50 EMA Crossing(S&R) | Subdivision 1
* Stop Loss - *(Range Allocation)) | No Size Up | Completed Survey
- 170 bars, 238d | Date Range
- Triple Formation
* (P1)) / (P2)) & (P3)) | Subdivision 2
* Daily Time Frame | Trend Settings Condition | Subdivision 3
- (Hypothesis On Entry Bias)) | Regular Settings
* Stop Loss Feature Varies Regarding To Main Entry And Can Occur Unevenly
- Position On A 1.5RR
* Stop Loss At 46.00 EUR
* Entry At 52.00 EUR
* Take Profit At 60.00 EUR
* (Uptrend Argument)) & No Pattern Confirmation
- Continuation Pattern | Not Valid
- Reversal Pattern | Not Valid
* Ongoing Entry & (Neutral Area))
Active Sessions On Relevant Range & Elemented Probabilities;
European-Session(Upwards) - East Coast-Session(Downwards) - Asian-Session(Ranging)
Conclusion | Trade Plan Execution & Risk Management On Demand;
Overall Consensus | Buy

Bitcoin buy setupHi everyone.
I think this area has a good potential to set an order and take at least 1% profit out of it..
Let's see how it reacts to this level...
Please consider the risk management.
Goodluck

BTCUSDT: Elliot Wave AnalysisAs you can see in the chart, the fourth wave has ended and there is a possibility of an increase in the next stage to the level between 128,000 and 131,000, followed by a correction for a larger fourth wave and finally the last leg of the increase to the fifth wave, which has the possibility of reaching 139,000 to 140,000.

SOL BEARISH CONTINUATIONAs the market continues to create new lows, something caught my eye.
3 areas of unwicked impulsive moves (FVG's) lying around 165.18 - 166.80, 167.65 - 169.69 and 170.32 - 172
With this, I identified two order blocks
.
I'm traditionally wired to prefer the latter because there's more confluence factors;
A liquidity pool 169.70 - 170.3 established by price struggling to close above that level followed immediately by a FVG into an OB.
Price would have an instant reaction downwards if it traded to those levels.
However, the buying pressure might not be sufficient to push price to those levels before the crash.
Hence the other order block.
I'd be paying close attention to observe how it plays out.

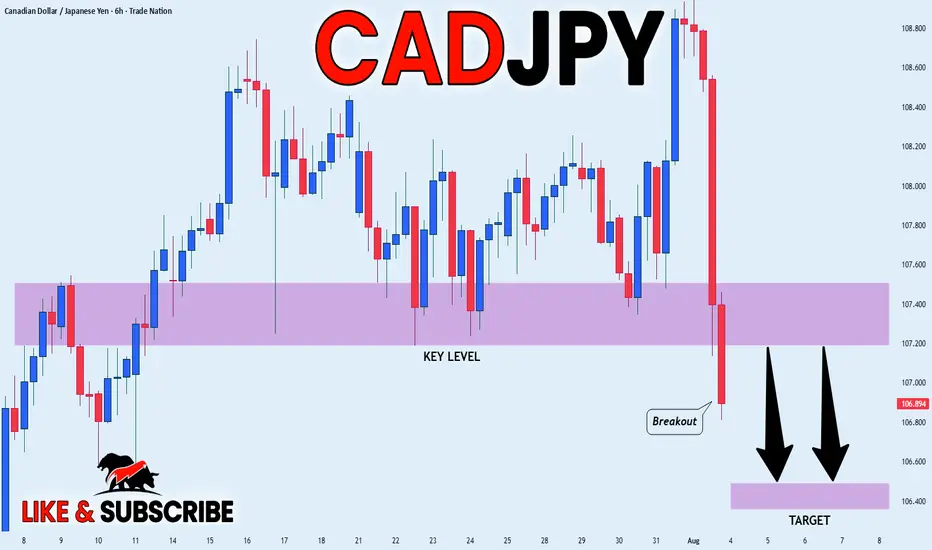
CAD_JPY BEARISH BREKAOUT|SHORT|
✅CAD_JPY broke the key structure level of 107.400
While trading in an local downtrend
Which makes me bearish
And I think that after the retest of the broken level is complete
A rebound and bearish continuation will follow
SHORT🔥
✅Like and subscribe to never miss a new idea!✅
Disclosure: I am part of Trade Nation's Influencer program and receive a monthly fee for using their TradingView charts in my analysis.