Gold is in the bullish direction after correcting the supportHello Traders
In This Chart GOLD HOURLY Forex Forecast By FOREX PLANET
today Gold analysis 👆
🟢This Chart includes_ (GOLD market update)
🟢What is The Next Opportunity on GOLD Market
🟢how to Enter to the Valid Entry With Assurance Profit
This CHART is For Trader's that Want to Improve Their Technical Analysis Skills and Their Trading By Understanding How To Analyze The Market Using Multiple Timeframes and Understanding The Bigger Picture on the Charts
Supply and Demand
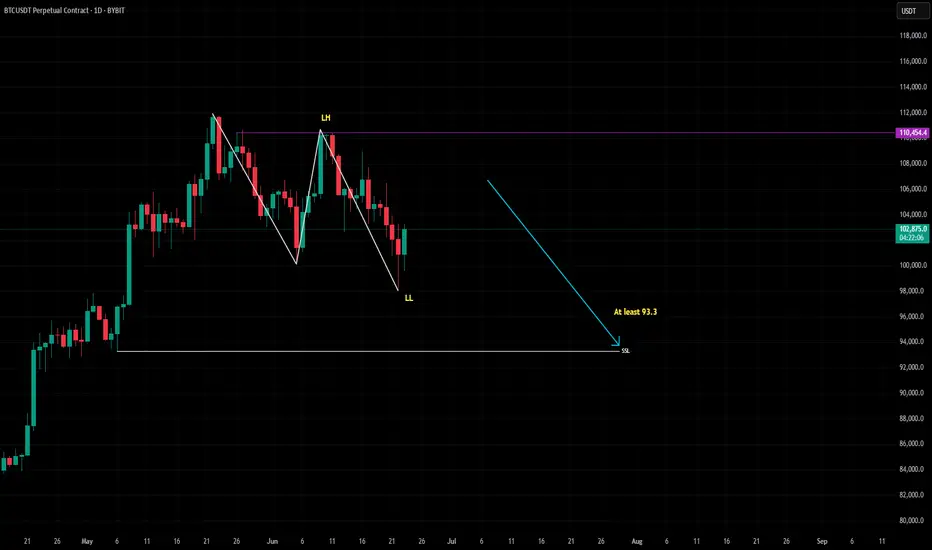
BTC Short to 93.3My target is at least SSL on 93.3
WTF, there is no need to post a huge text description to understand what is depictured on the chart!
QNTUSDT | Attractive Zone, But Buyer Strength Still LackingQNTUSDT left behind a clean demand zone on its way up, and that area could offer a decent long opportunity with the right confirmation.
However, if you ask for my broader view, I’m still cautious. Buyers haven’t proven enough strength yet. CDV isn’t convincing, and order flow lacks aggression.
That said, this week started with noticeable buyer presence across the board. If that momentum spills into QNTUSDT, this zone might hold and push price higher.
It’s early for full conviction, but not a bad place for a calculated entry — as long as risk is controlled.
📌I keep my charts clean and simple because I believe clarity leads to better decisions.
📌My approach is built on years of experience and a solid track record. I don’t claim to know it all but I’m confident in my ability to spot high-probability setups.
📌If you would like to learn how to use the heatmap, cumulative volume delta and volume footprint techniques that I use below to determine very accurate demand regions, you can send me a private message. I help anyone who wants it completely free of charge.
🔑I have a long list of my proven technique below:
🎯 ZENUSDT.P: Patience & Profitability | %230 Reaction from the Sniper Entry
🐶 DOGEUSDT.P: Next Move
🎨 RENDERUSDT.P: Opportunity of the Month
💎 ETHUSDT.P: Where to Retrace
🟢 BNBUSDT.P: Potential Surge
📊 BTC Dominance: Reaction Zone
🌊 WAVESUSDT.P: Demand Zone Potential
🟣 UNIUSDT.P: Long-Term Trade
🔵 XRPUSDT.P: Entry Zones
🔗 LINKUSDT.P: Follow The River
📈 BTCUSDT.P: Two Key Demand Zones
🟩 POLUSDT: Bullish Momentum
🌟 PENDLEUSDT.P: Where Opportunity Meets Precision
🔥 BTCUSDT.P: Liquidation of Highly Leveraged Longs
🌊 SOLUSDT.P: SOL's Dip - Your Opportunity
🐸 1000PEPEUSDT.P: Prime Bounce Zone Unlocked
🚀 ETHUSDT.P: Set to Explode - Don't Miss This Game Changer
🤖 IQUSDT: Smart Plan
⚡️ PONDUSDT: A Trade Not Taken Is Better Than a Losing One
💼 STMXUSDT: 2 Buying Areas
🐢 TURBOUSDT: Buy Zones and Buyer Presence
🌍 ICPUSDT.P: Massive Upside Potential | Check the Trade Update For Seeing Results
🟠 IDEXUSDT: Spot Buy Area | %26 Profit if You Trade with MSB
📌 USUALUSDT: Buyers Are Active + %70 Profit in Total
🌟 FORTHUSDT: Sniper Entry +%26 Reaction
🐳 QKCUSDT: Sniper Entry +%57 Reaction
📊 BTC.D: Retest of Key Area Highly Likely
📊 XNOUSDT %80 Reaction with a Simple Blue Box!
📊 BELUSDT Amazing %120 Reaction!
📊 Simple Red Box, Extraordinary Results
📊 TIAUSDT | Still No Buyers—Maintaining a Bearish Outlook
📊 OGNUSDT | One of Today’s Highest Volume Gainers – +32.44%
I stopped adding to the list because it's kinda tiring to add 5-10 charts in every move but you can check my profile and see that it goes on..

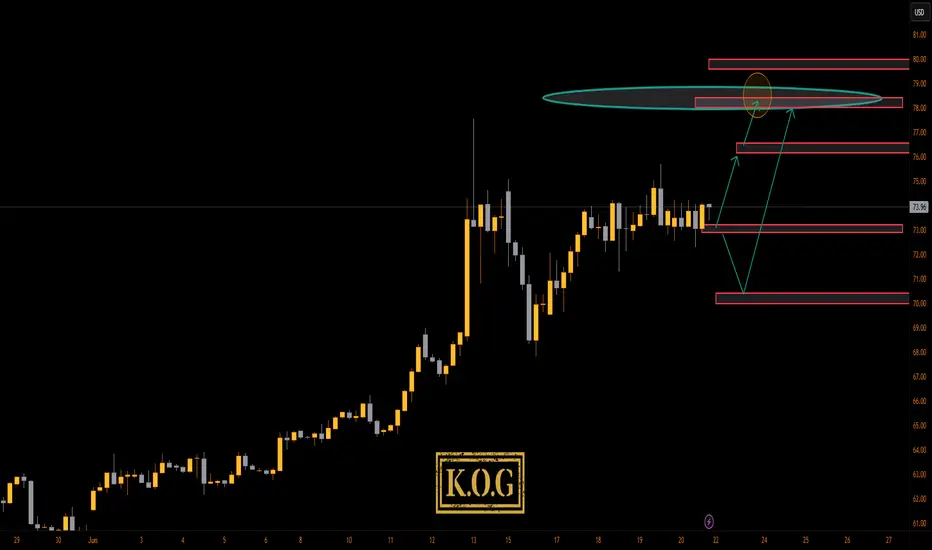
KOG - OILQuick look at Oil. There is a pivot here in the golden zone around the 70.5 level which we can dip into. Above that level, we would be looking for higher oil with the potential target level on the chart. Note, oil is due a huge pull back, so rejection from one of these resistance levels can give us that pull back in order to get better pricing to long.
We've added the red boxes from the indicator to help you navigate the move.
Please do support us by hitting the like button, leaving a comment, and giving us a follow. We’ve been doing this for a long time now providing traders with in-depth free analysis on Gold, so your likes and comments are very much appreciated.
As always, trade safe.
KOG
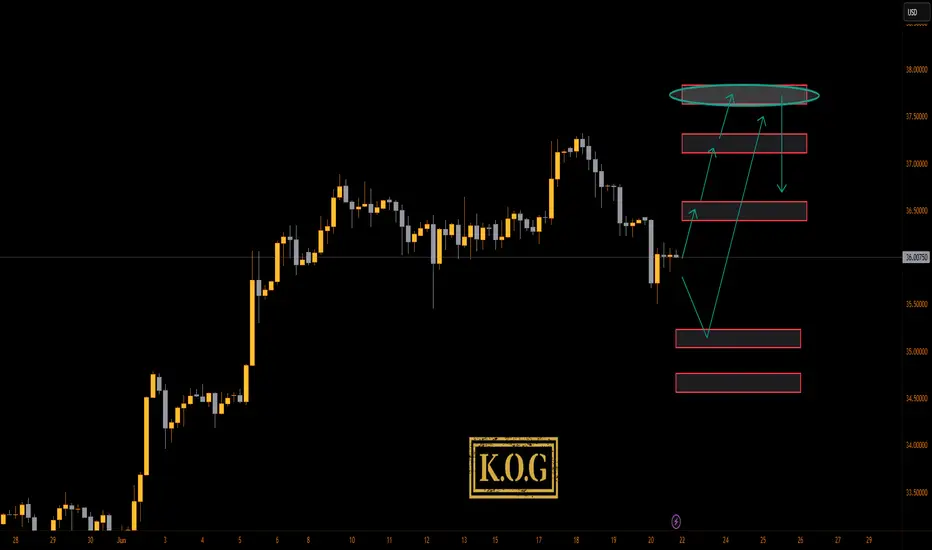
KOG - SILVERSILVER
As with gold and oil, looking at this expecting a gap on open and potential for a move driven by the news. If we do spike down, the red box is the level to watch with the red box levels above as potential target levels on the breaks.
Please do support us by hitting the like button, leaving a comment, and giving us a follow. We’ve been doing this for a long time now providing traders with in-depth free analysis on Gold, so your likes and comments are very much appreciated.
As always, trade safe.
KOG
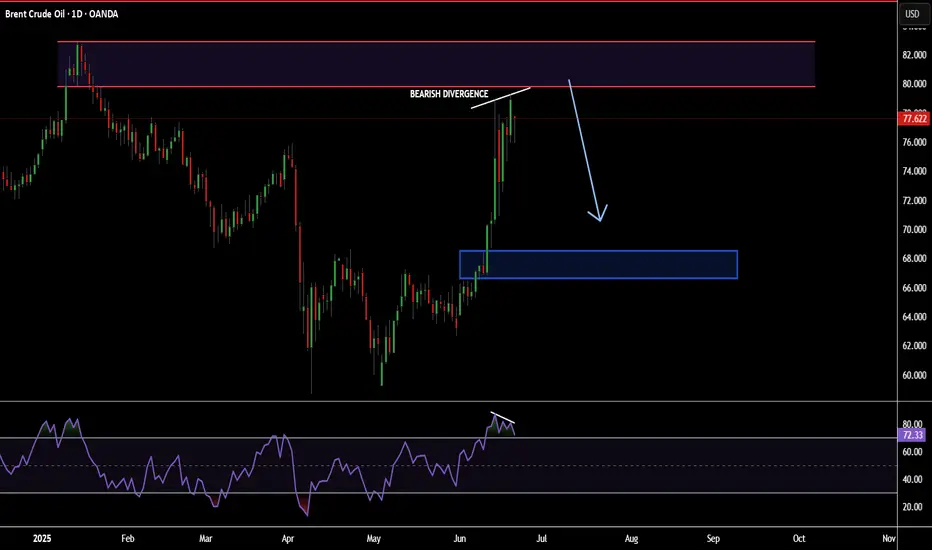
POTENTIAL SHORT OPPORTUNITY ON BRENT CRUDE OIL...SWING TRADEHey hey TradingView community!!! Hope you guys are doing amazing and having an amazing weekend! Just wanted to come make a post on a counter-trend trade I potentially see here on Brent Crude Oil. So put your seat belts on and let's dive in!!
OK so first thing first. Oil has recently seen a huge run in price from 63-80 a barrel so obviously a dramatic increase in price & USUALLY when we see these very strong decisive moves in an asset there is usually a corrective period in prices because that is how supply & demand and how markets works :) OK so let's now go to the technical reasoning!
1. Weekly price overextended/ RSI overbought
2. Daily momentum of buyers slowing down/ Bearish Divergence forming
3. Sitting around a weekly fib level
4. Hourly's lining up with this bias also mainly momentum
Very simple setup and potential here! May have to wait for that buyer to die out/ slow down a little more but keep eyes out for this move. Obviously trading against the trend is a little more "risky" but stay patient and let's see how it plays out!
Cheers!
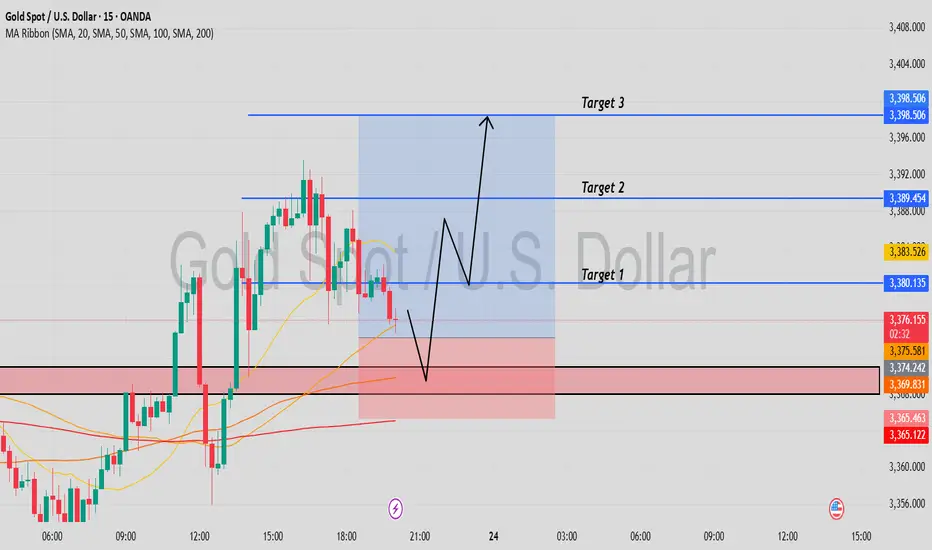
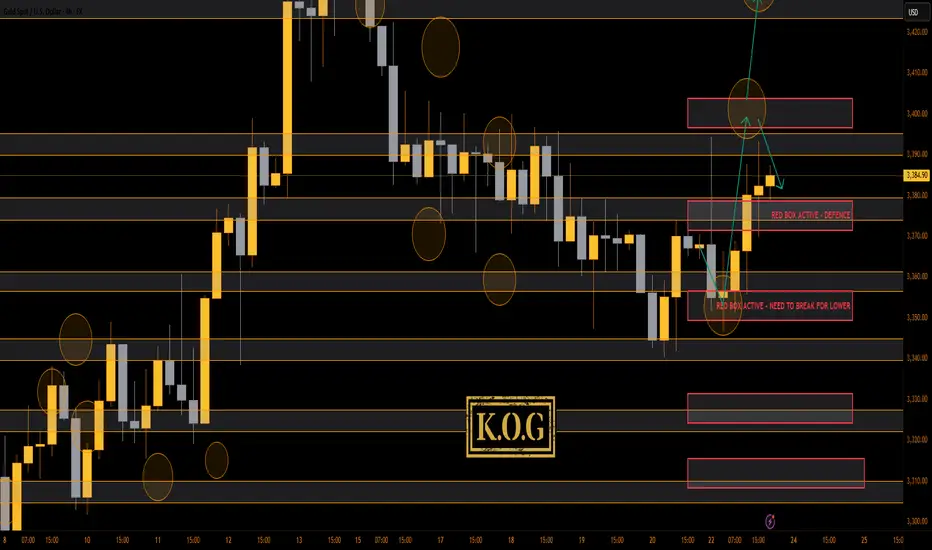
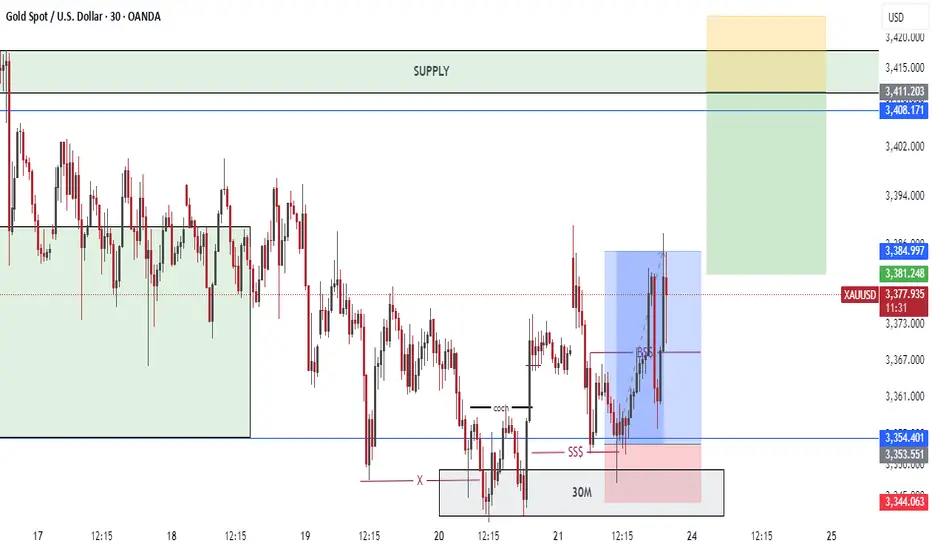
THE KOG REPORT - Update End of day update from us here at KOG:
Following on from the KOG report, we said there was a huge caveat to the idea, that being that we will tap into that red box resistance and then make the drop rather than just continuing upside. This move worked out well not only giving the RIP but also terminating at the red box and bias level which gave us the long trade upside to where we are now.
For now we have resistance at the 3395 level which still needs to break upside, while support is the 3370-75 level. Ideally, what we want to see over the Asian session is a break above the 3400 level, then a dip into the 3380-75 level before resuming the path we have anticipated in the report. For that reason, we won't change anything in our plans for now.
Please note, a break below 3370 is needed to change the structure.
Key Levels:
Red box defence 3375-80, needs to be broken
Red box defence 3350, needs to be broken
KOG’s bias of the week:
Bullish above 3340 with targets above 3375✅, 3390✅, 3395✅ and above that 3410
Bearish on break of 3340 with targets below 3330, 3320, 3310, 3306 and below that 3298
RED BOX TARGETS:
Break above 3375 for 3378✅, 3390✅, 3395✅, 3406, 3410 and 3419 in extension of the move
Break below 3365 for 3355✅, 3350✅, 3340, 3336, 3330 and 3323 in extension of the move
Please do support us by hitting the like button, leaving a comment, and giving us a follow. We’ve been doing this for a long time now providing traders with in-depth free analysis on Gold, so your likes and comments are very much appreciated.
As always, trade safe.
KOG
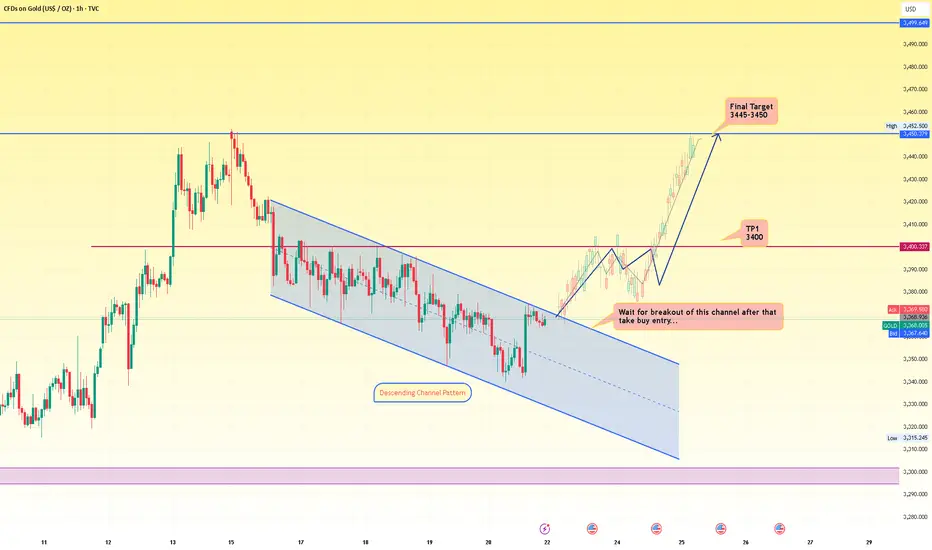
Bullish Momentum Expected Next Week, With Geopolitical tensions 🌍 Fundamental Catalyst – Middle East Tensions Driving Gold Higher
Gold is gaining strong safe-haven demand due to escalating geopolitical tensions between Iran and Israel, further amplified by a recent U.S. military strike on Iran. These developments have sparked fears of a broader regional conflict, pushing investors to seek the stability that gold traditionally offers during periods of uncertainty. We may again see an All-Time New High of gold because things are getting closer to a new WWIII, which we never want, so these tensions will boost the gold prices.
Key Fundamentals Supporting Bullish Gold:
🛡️ Safe-Haven Demand: Gold historically rallies during military conflict and political instability.
💥 Risk-Off Sentiment: Equities may weaken while commodities like gold attract capital inflow.
🔐 Market Uncertainty: Any further escalation will likely trigger another wave of buying pressure in gold.
With this level of geopolitical uncertainty, we may soon witness a new all-time high (ATH) in gold prices. If further military actions occur, we could potentially see an explosive move of 600 to 1000 pips as early as tomorrow.
At the same time, while we analyze the market and act accordingly, our hope remains that peace will soon prevail. These conflicts are deeply painful and harmful to humanity. Let’s all hope for de-escalation and the return of stability — not just for the markets, but for the well-being of people across the world.
Technical Overview:
> The chart shows a descending channel pattern, which is still valid, but the thing is now gold will follow fundamental, not technical levels.
> Don't need to wait for the breakout of this channel, you can enter to buy a trade from here once the market opens.
> Regarding the targets we mentioned below.
>> TP1: 3400 <<
>> Final Target Zone: 3445–3450 <<
: NOTE
Given the geopolitical backdrop and historical behavior of gold in such environments, a bullish trend is expected in the coming sessions. Traders and investors should monitor developments closely, as any further escalation may act as a strong catalyst for gold to surge.
Thank you traders, for reading our idea. If any of you want to suggest something, must comment here as we can explore more. If you agreed with my idea, so must support us for more updates.
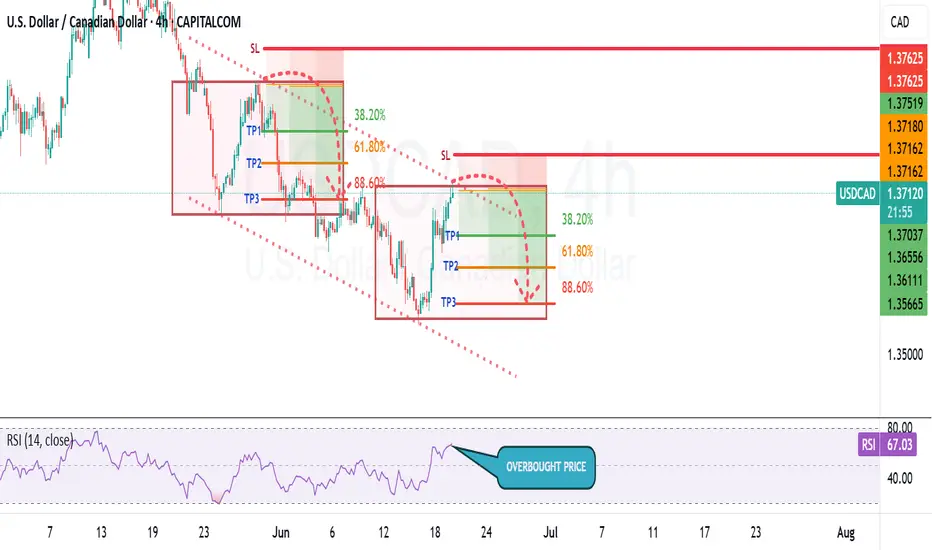
SELL USDCADOverbought price after FOMC release yesterday has elevated price action to a sweet sell kill zone, we expect a deep bearish correction however remember that anything is possible.
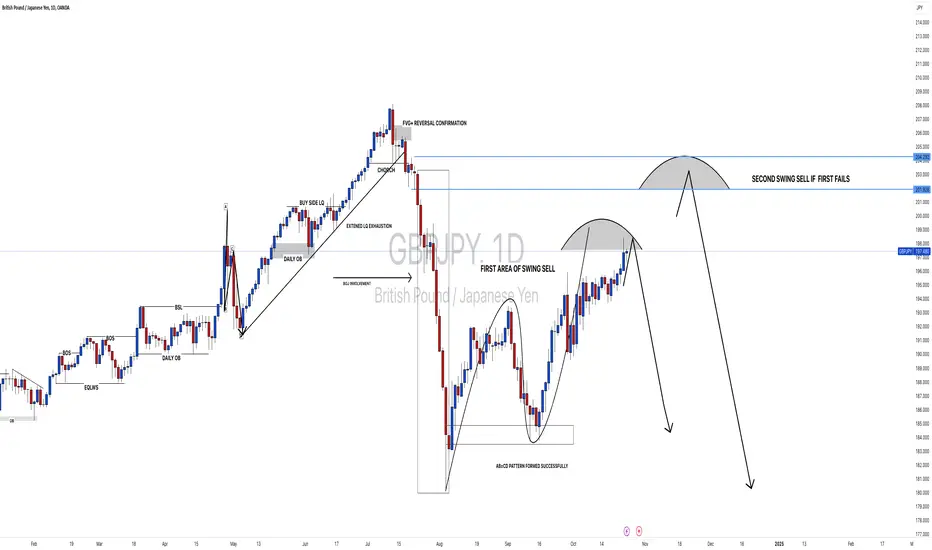
#GBPJPY: UPDATED VIEW 24/10/2024 **GBPJPY UPDATED VIEW BASED ON PREVIOUS ANALYSIS**
Dear Traders,
I hope you are doing well. Based on our previous analysis of GBPJPY, we identified two potential selling opportunities within the market.
However, the bullish sentiment in the DXY currency pair has had a significant impact on JPY, causing it to fall short of its full value within the daily timeframe. As of today, we have observed a potential exhaustion of DXY’s bullish momentum, with four-hour candles indicating a strong bearish pressure. This development presents an opportunity for JPY to rebound, potentially allowing us to secure substantial profits within the market.
Now, let’s focus on the GBPJPY currency pair. The price has extended its bullish trend, although there is a possibility of a reversal from its current position. We recommend implementing appropriate stop-loss orders for any sell entries taken from the current market price. If the initial entry fails, we are confident that the price is likely to reverse from our second entry.
Before making any decisions based on this analysis, it is essential to conduct your own research. This analysis is solely for educational purposes and should not be considered financial advice.
We appreciate your feedback and support. If you find our work valuable, please consider liking and commenting on our ideas. Additionally, following us will provide us with encouragement and motivation.
Best regards,
Team SetupsFX_
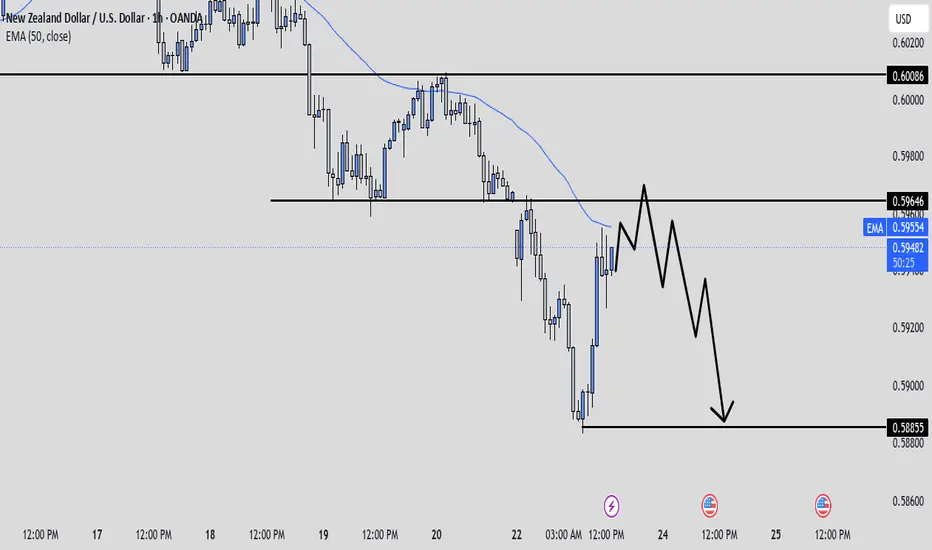
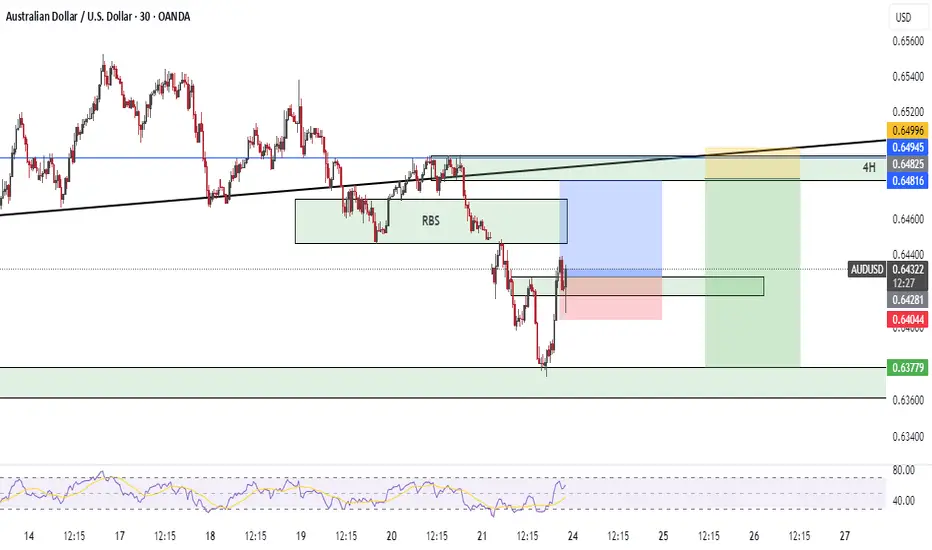
NzdUsd Trade IdeaNzdUsd is another bearish pair. There is a level of resistance on the higher time frame where price could potentially respect and flip structures at that specific level. If all goes well we could expect some sort of bearish range. I'll be looking to short the pair for a 1:3rr if the set up plays out as planned.
AudUsd Trade IdeaAU is currently bearish on higher time frames with smaller time frames still respecting a Lower High. If price can give the pullback to retest the LH then we could expect price to continue with bearish structures where a 1:3rr could come into play. We could even expect price to tap back into the previous low or even hit the level I have marked below. We'll see what happens.
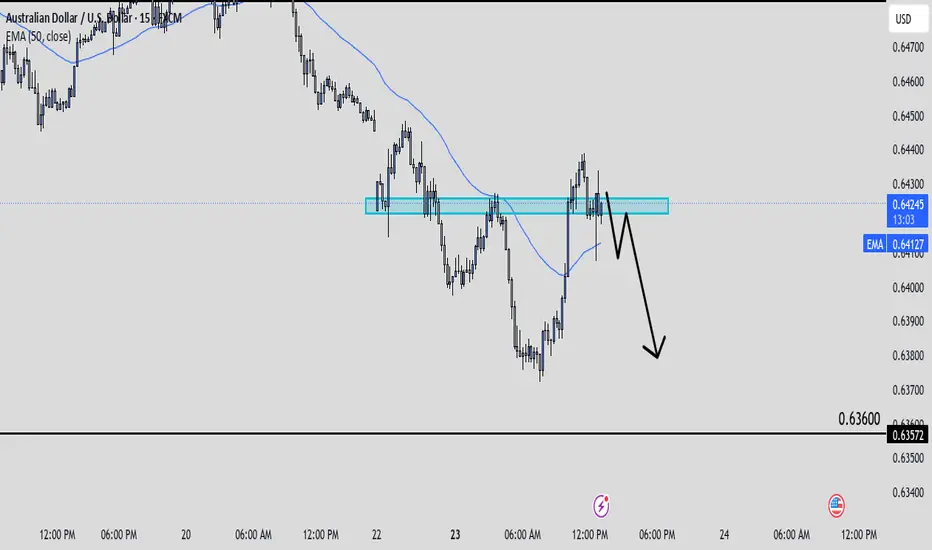
AUDUSD SETUPWe will enter the given setup .
Watch for market shift on LTF for confirmation entry .
Please follow to support me !
CadJpy Trade IdeaWith CJ failing to create bullish structures above the previous high and above a level of resistance we could potentially look for price to pullback and retest the level of resistance. We have a clean break of structure on smaller time frames indicating a possible range continuation. Looking for a 1:3rr if all goes well. We'll see what happens.

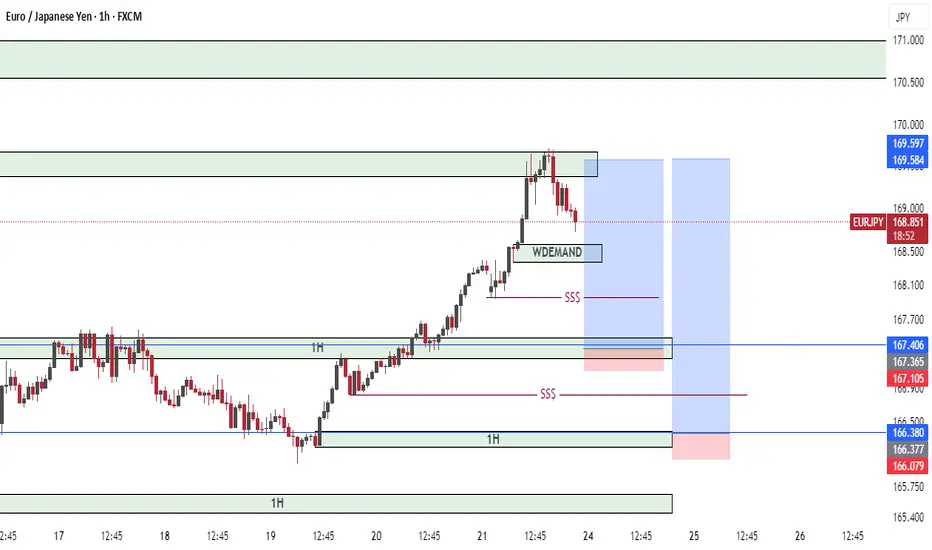
EURJPY BUY SETUPThe zone has been depicted in the chart for buy entry.
we will wait for the market structure shift on LTF to enter .
Please follow to support me.
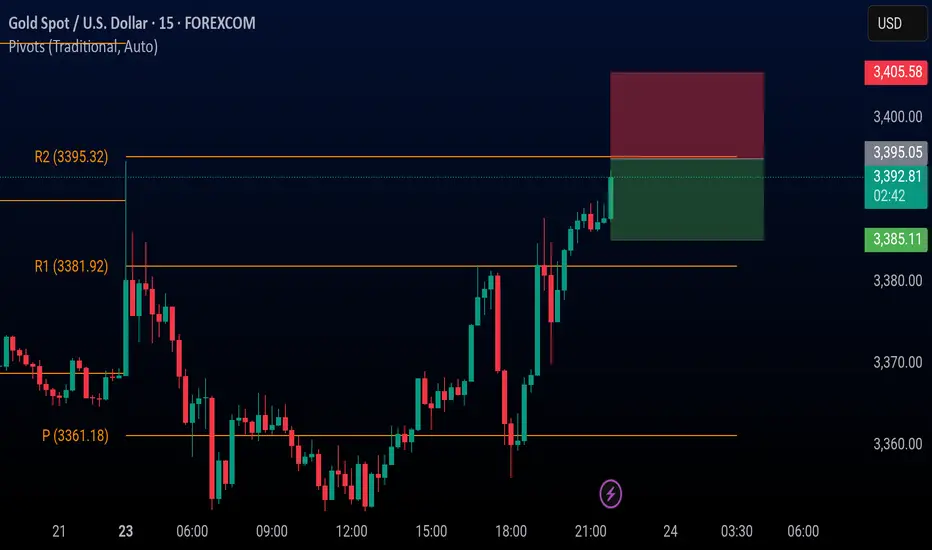
XAUUSD INTRADAY KEY LEVELS Greetings,
Hello traders, this is the XAU-USD 15m pivot resistance zone.
Based on market trend and previous day movement.
Intraday resistance 2 is represented by the yellow line. 3395.32
And circular figure 3100 may act as a resistance zone.
Key levels;
Entry: 3395.32
Target: 3385.32
Stop loss: 4095.32
Risk Reward Ratio 1:1
Your likes and boosts motivate us to keep learning and sharing ideas!
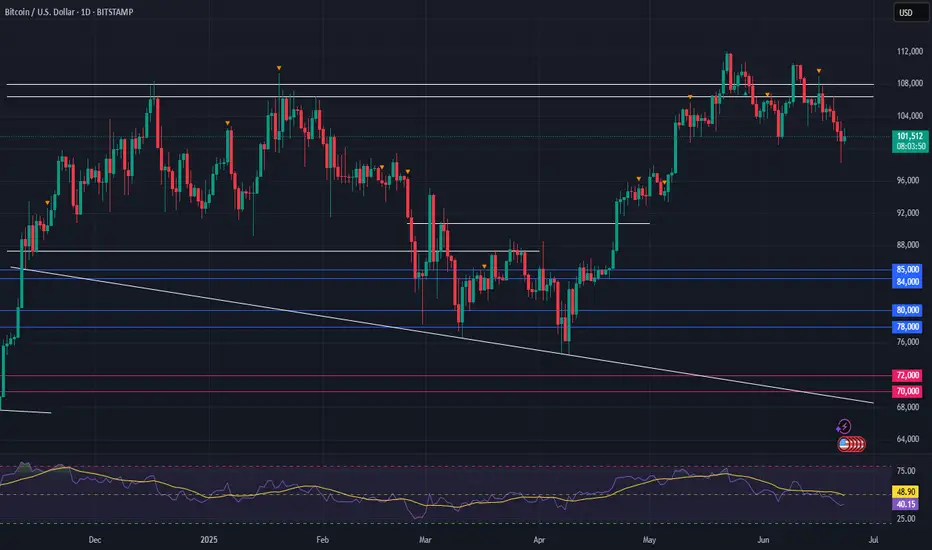
Bitcoin Tests Key Support-Healthy Correction Within Bull MarketHealthy Pullback, Strong Structure:
Bitcoin’s recent dip is a constructive correction within a broader bull trend, as it tests the critical $100,000–$105,000 support zone—a former resistance area from early 2025.
Institutional Demand Holds the Line:
Maintaining levels above the psychologically important $100,000 mark highlights continued institutional accumulation and reinforces the underlying strength of the trend.
Momentum Reset, Base Building:
This pullback has helped reset overbought conditions from the prior rally, laying the foundation for the next potential leg higher.
Key Levels to Watch:
Support: $100,000–$105,000
Breakout Trigger: A close above $108,000 would confirm uptrend continuation
Outlook: Bullish bias remains valid as long as support holds
Investor Opportunity:
With structure intact and downside contained, this consolidation presents a favorable risk-reward setup for long-term investors looking to position ahead of a potential breakout.
#Bitcoin #BTC #CryptoMarket #TechnicalAnalysis #SupportAndResistance #BullMarket #RiskReward #InstitutionalBuying #MarketOutlook #PriceAction
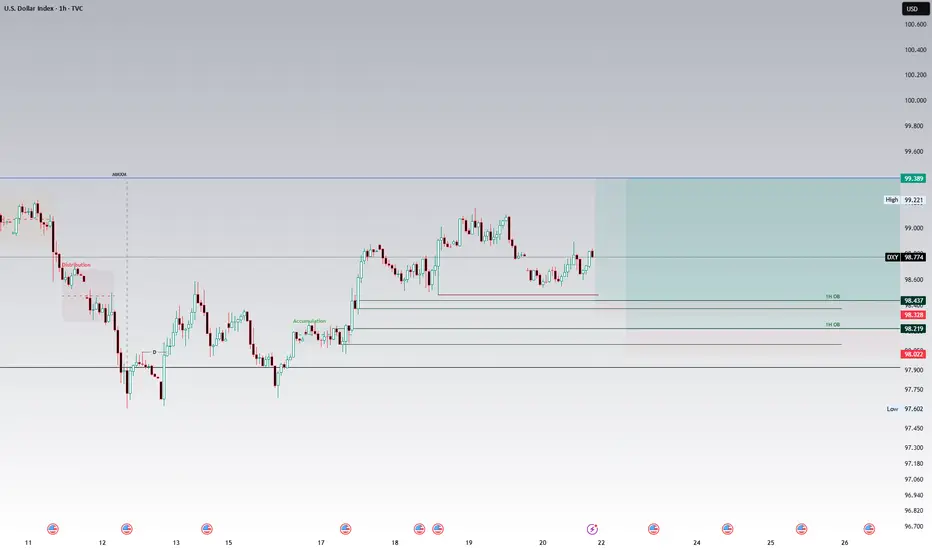
Potential Bullish Scenario for DXY, target objective is 99.392Higher timeframe analysis
As discussed in last week's analysis of the DXY, the higher timeframe draw on liquidity is the bearish monthly Fair value gap set at 101.977. This warrants a higher timeframe bullish bias until this level has been achieved.
Intermediate timeframe analysis
We note the relative equal highs on the daily and 1H chart at 99.392. This serves as a intermediate timeframe draw on liquidity and target objective.
Also note that the buyside of the curve of the market maker buy model has commenced which further fuels bullish sentiment.
Scenario 1
On the 1H chart, note the relative equal lows at 98.482. These lows are expected to be ran to serve as a liquidity primer for the bullish 1H order block at 98.436 which is expected to be respected and held. This poses a rather handsome risk to reward ratio.
Scenario 2
Should price push past the invalidation point of the bullish 1H order block we could see it head to the bullish 1H order block at the initial accumulation at 98.219. The reward on this setup would make up for the loss of scenario 1.
Disclaimer
The above analysis is intended for educational purposes only and should not be interpreted as financial advice.
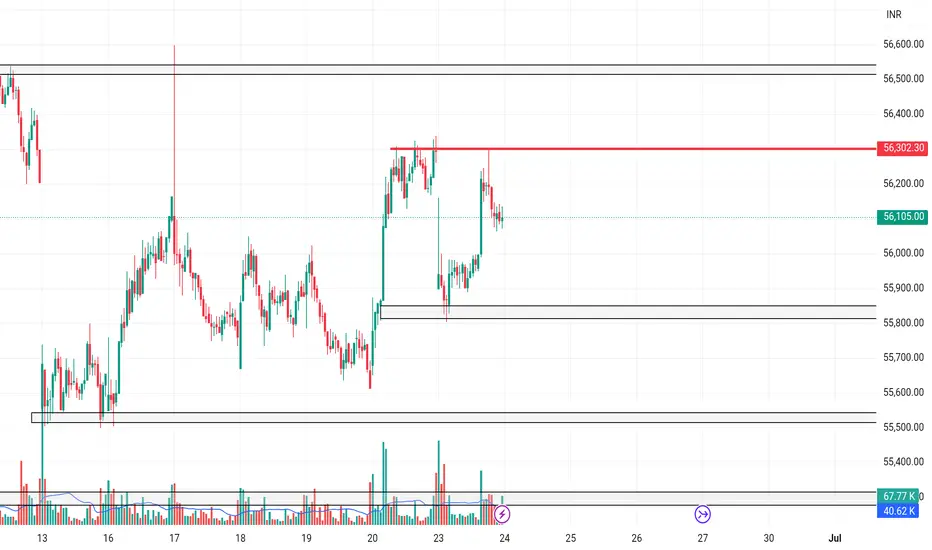
BANKNIFTYBanknifty levels are based on imbalances
1. gapup 56300 long
2. 56300-55800 trade breakout
3. gapdown 55800 short
XAUUSD Trade ideaPrice has given us tp in buy now we are waitin patiently for our sell setup.
Watch market structure on LTF .
Please follow to support .
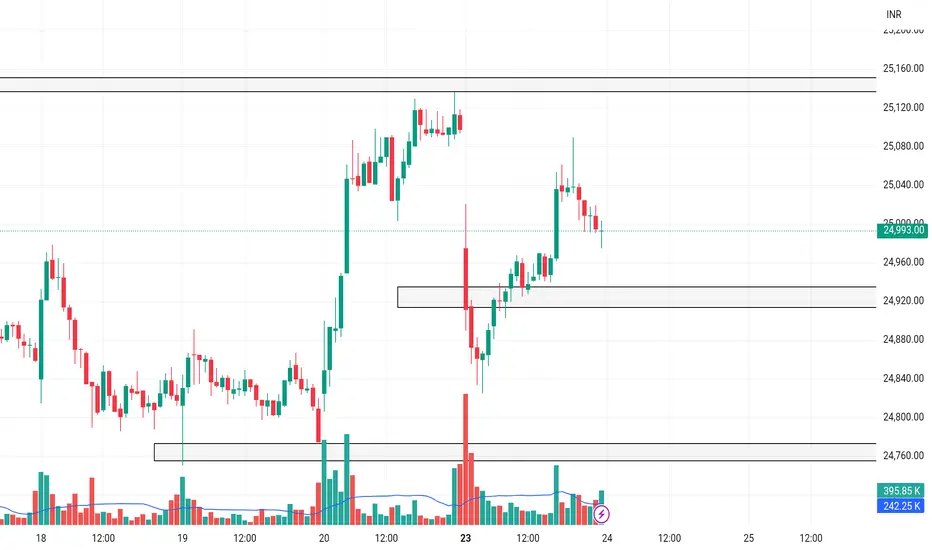
NIFTYNifty levels are based on imbalances
1. gapup 25150 long
2. 25150-24950 trade breakout
3. gapdown 24900 short
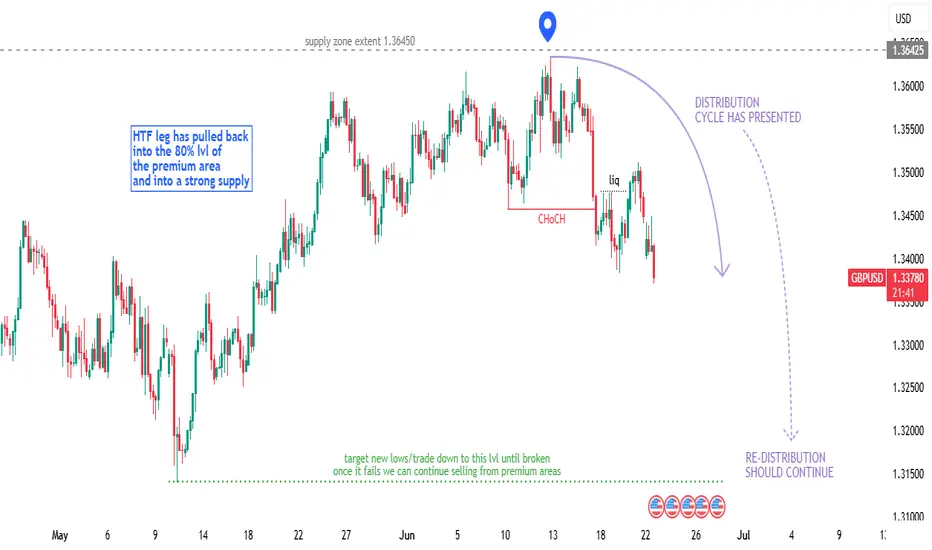
GBPUSD - Technical Outlook (Long + Short Term)In this article, I’ll share my current outlook on GBPUSD, highlighting both higher time frame (HTF) and intraday considerations.
Higher Time Frame Analysis
The overall trend remains bearish. Price is still trading within the previous structural leg, with the key level at 1.42500. Unless we see a decisive break above this level, my bias will remain bearish for this pair.
Recently, we’ve witnessed what looks like institutional manipulation to the upside, followed by a sharp bearish reaction from the weekly supply zone. This price action aligns with a classic Wyckoff distribution cycle, which often signals that the prevailing trend is likely to continue.
Intraday Advice
For short-term traders, it’s best to wait for lower time frame (LTF) pullbacks and signs of manipulation before considering short positions. If price continues to push lower, there should be opportunities to ride the trend down over the coming weeks, with multiple entry points along the way.
Trading Considerations
If this analysis plays out, there’s potential to maximize gains through both swing and intraday trades. However, patience and risk management are key. Losses are inevitable - what matters is managing risk and staying disciplined.
Key Points to Remember:
Wait for clear pullbacks before entering trades.
Stick to your risk management plan.
Stay patient and let the market come to you.
This is an exciting time to trade FX:GBPUSD , but always assess if the risk is worth the reward before entering any position.
Happy hunting predators...
Apex out!
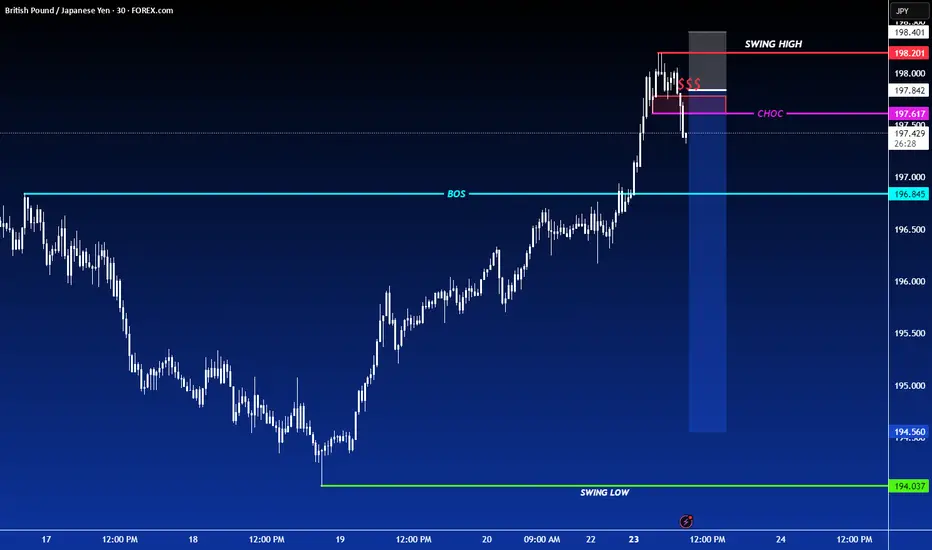
SHORT ON GBP/JPYGJ has given us a CHOC (change of character) on the Lower timeframes breaking a strong low.
I will be selling GJ to the next demand level basically catching the pullback to its overall UPTREND.
looking to catch 200-300 pips this week.