Nifty levels - Jul 18, 2025Nifty support and resistance levels are valuable tools for making informed trading decisions, specifically when combined with the analysis of 5-minute timeframe candlesticks and VWAP. By closely monitoring these levels and observing the price movements within this timeframe, traders can enhance the accuracy of their entry and exit points. It is important to bear in mind that support and resistance levels are not fixed, and they can change over time as market conditions evolve.
The dashed lines on the chart indicate the reaction levels, serving as additional points of significance to consider. Furthermore, take note of the response at the levels of the High, Low, and Close values from the day prior.
We hope you find this information beneficial in your trading endeavors.
* If you found the idea appealing, kindly tap the Boost icon located below the chart. We encourage you to share your thoughts and comments regarding it.
Wishing you success in your trading activities!
Supply and Demand

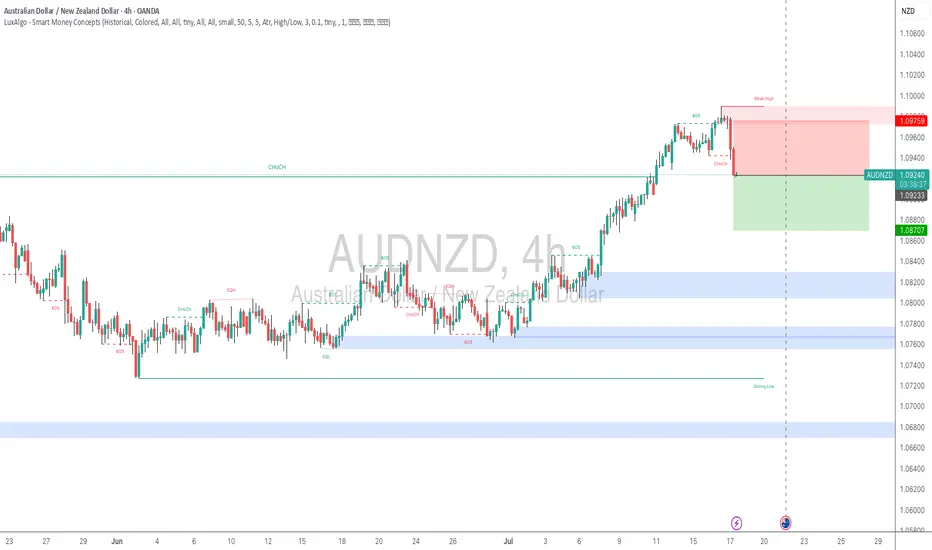
AUDNZD - Short-Term Pullback Expected from Key ResistanceAUDNZD - Short-Term Pullback Expected from Key Resistance
📈 Setup Overview:
AUDNZD has been trending bullish but has now reached a critical resistance level that aligns with the upper boundary of the ascending trendline. This confluence suggests a potential short-term pullback opportunity.
🔍 Analysis:
Strong bullish wave structure intact
Price testing key resistance + ascending trendline upper boundary
Expecting retracement toward trendline support
Overall bullish structure remains favorable for continuation after pullback
📊 Trade Details:
Entry: Sell Stop at 1.091745
Risk Management: 1:2 Risk-to-Reward Ratio
Bias: Short-term bearish pullback within larger bullish trend
⚠️ Risk Disclaimer: This is not financial advice. Trade at your own risk and always use proper position sizing.
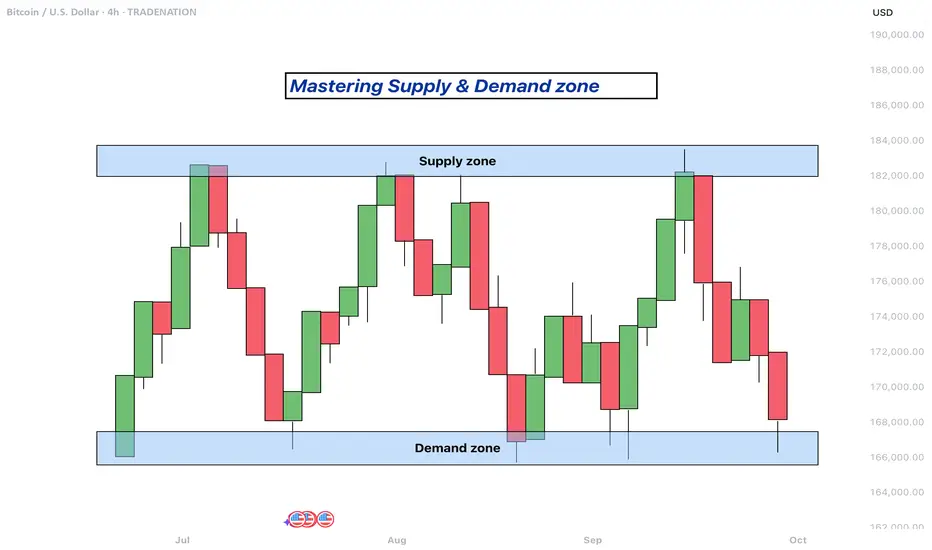
Mastering supply and demand zones - how to use it in trading?Supply and demand zones are key concepts in technical analysis used by traders to identify potential price reversal areas on a chart. They are based on the idea that prices move due to an imbalance between buyers (demand) and sellers (supply).
-------------------------
What will be discussed?
- What are supply and demand zones?
- How to detect supply and demand zones?
- Examples from supply and demand zones?
- How to trade using supply and demand zones?
-------------------------
What are supply and demand zones?
Supply and demand zones are areas on a price chart where the forces of buying and selling are strongly concentrated, causing significant movements in price. In simple terms, a supply zone is an area where selling pressure exceeds buying pressure, often leading to a drop in price. It usually forms when price moves upward into a region where sellers begin to outnumber buyers, pushing the price back down. On the other hand, a demand zone is a region where buying pressure exceeds selling pressure, typically resulting in a rise in price. This occurs when price moves downward into a region where buyers see value and begin to outnumber sellers, causing the price to increase again.
These zones reflect areas of imbalance in the market. In a supply zone, sellers are more eager to sell than buyers are to buy, often due to overbought conditions, news, or fundamental changes. In a demand zone, buyers are more eager to buy than sellers are to sell, often because the price has become attractive or undervalued. Traders look for these zones because they provide clues about where price may reverse or stall, offering potential entries or exits for trades.
-------------------------
How to detect supply and demand zones?
Identifying supply and demand zones involves analyzing price action on a chart, typically using candlestick patterns. A common way to detect a supply zone is to look for a sharp upward move followed by a sudden reversal or strong drop in price. The area where the price stalled before falling sharply is likely to be a supply zone. This zone includes the highest candle body or wick before the drop, and a few candles before it that mark where the selling pressure began.
To identify a demand zone, you would look for a sharp drop in price followed by a strong rally upward. The area where the price paused before rising significantly can be considered a demand zone. Like with supply zones, the demand zone includes the lowest candle before the price reversed and a few candles leading up to it.
These zones are not exact price levels but rather ranges. Price does not have to touch an exact line to react; it often moves within the general area. For more accuracy, traders often refine their zones by identifying them on higher time frames such as the 4-hour or daily chart, then adjusting them slightly on lower time frames like the 1-hour or 15-minute chart.
-------------------------
Examples from supply and demand zones:
-------------------------
How to trade using supply and demand zones?
Trading supply and demand zones involves anticipating how price is likely to behave when it returns to one of these key areas. A common method is to wait for price to enter a zone and then watch for confirmation that it is going to reverse. For example, if price rises into a supply zone, you might look for signs like a bearish candlestick pattern, a drop in volume, or a rejection wick to signal that sellers are stepping in again. This would be an opportunity to enter a short trade with the expectation that price will fall.
Conversely, if price falls into a demand zone, you would wait for bullish signals—such as a strong bullish candle, a double bottom pattern, or clear rejection of lower prices—to confirm that buyers are returning. This would be a potential setup for a long trade, expecting the price to move up from the zone.
Traders often place stop losses just beyond the zone to limit risk in case the level fails. For a supply zone, the stop loss would go just above the zone, while for a demand zone, it would go just below. Targets can be set at recent support or resistance levels, or by using risk-reward ratios like 1:2 or 1:3 depending on the trader’s strategy.
Patience and discipline are important when trading these zones. Not every zone will lead to a reversal, and false breakouts can occur. Therefore, combining supply and demand analysis with other tools such as trendlines, moving averages, or indicators can improve the chances of a successful trade.
In summary, supply and demand zones help traders understand where large buying or selling forces are likely to influence price. By learning to identify these zones and waiting for confirmation signals, traders can enter high-probability trades with clear risk and reward levels.
-------------------------
Disclosure: I am part of Trade Nation's Influencer program and receive a monthly fee for using their TradingView charts in my analysis.
Thanks for your support. If you enjoyed this analysis, make sure to follow me so you don't miss the next one. And if you found it helpful, feel free to drop a like and leave a comment, I’d love to hear your thoughts!
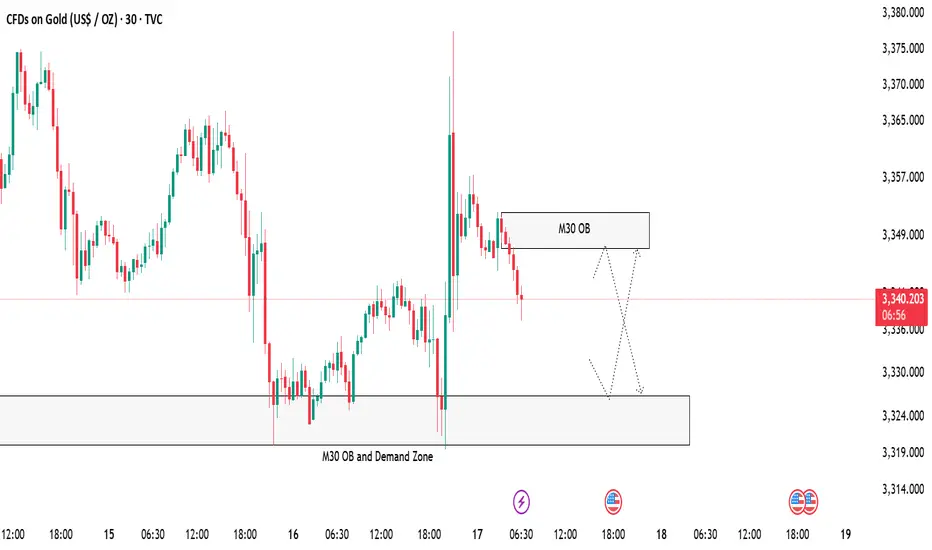
Gold 30-Minute OB and Demand Zone SetupGold is now approaching a 30-Minute Order Block along with a strong demand zone 🟢. We are expecting some clean reactions from these areas.
📌 Plan:
Scenario 1:
👉 If price respects the M30 OB and Demand zone area at 3327 -3320, we can look for bullish signs like rejection wicks or bullish candles to enter buy positions 📈, targeting the upper zone M30 OB zone near 3347 🎯.
Scenario 2:
👉 If price tap the above 30 min OB near 3347 we take our sell or short side entries for a reaction from there entering short ✅.
Both scenarios are possible, so we will watch the price action closely 🧐 and only trade with confirmation!
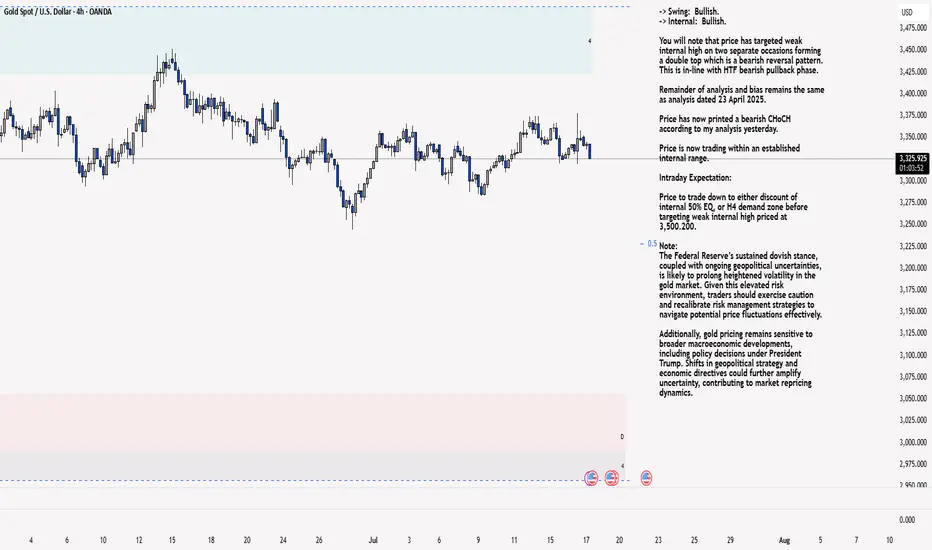
XAU/USD 17 July 2025 Intraday AnalysisH4 Analysis:
-> Swing: Bullish.
-> Internal: Bullish.
You will note that price has targeted weak internal high on two separate occasions forming a double top which is a bearish reversal pattern. This is in-line with HTF bearish pullback phase.
Remainder of analysis and bias remains the same as analysis dated 23 April 2025.
Price has now printed a bearish CHoCH according to my analysis yesterday.
Price is now trading within an established internal range.
Intraday Expectation:
Price to trade down to either discount of internal 50% EQ, or H4 demand zone before targeting weak internal high priced at 3,500.200.
Note:
The Federal Reserve’s sustained dovish stance, coupled with ongoing geopolitical uncertainties, is likely to prolong heightened volatility in the gold market. Given this elevated risk environment, traders should exercise caution and recalibrate risk management strategies to navigate potential price fluctuations effectively.
Additionally, gold pricing remains sensitive to broader macroeconomic developments, including policy decisions under President Trump. Shifts in geopolitical strategy and economic directives could further amplify uncertainty, contributing to market repricing dynamics.
H4 Chart:
M15 Analysis:
-> Swing: Bullish.
-> Internal: Bullish.
H4 Timeframe - Price has failed to target weak internal high, therefore, it would not be unrealistic if price printed a bearish iBOS.
The remainder of my analysis shall remain the same as analysis dated 13 June 2025, apart from target price.
As per my analysis dated 22 May 2025 whereby I mentioned price can be seen to be reacting at discount of 50% EQ on H4 timeframe, therefore, it is a viable alternative that price could potentially print a bullish iBOS on M15 timeframe despite internal structure being bearish.
Price has printed a bullish iBOS followed by a bearish CHoCH, which indicates, but does not confirm, bearish pullback phase initiation. I will however continue to monitor, with respect to depth of pullback.
Intraday Expectation:
Price to continue bearish, react at either M15 supply zone, or discount of 50% internal EQ before targeting weak internal high priced at 3,451.375.
Note:
Gold remains highly volatile amid the Federal Reserve's continued dovish stance, persistent and escalating geopolitical uncertainties. Traders should implement robust risk management strategies and remain vigilant, as price swings may become more pronounced in this elevated volatility environment.
Additionally, President Trump’s recent tariff announcements are expected to further amplify market turbulence, potentially triggering sharp price fluctuations and whipsaws.
M15 Chart:
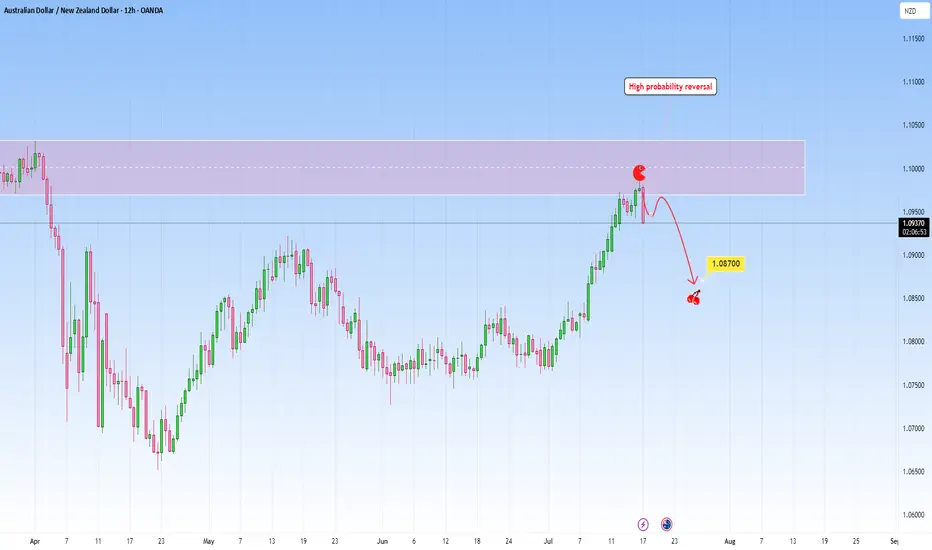
AUDNZD: Ongoing Reversal from ResistanceI am watching for a reversal on AUDNZD as marked on my chart, expecting a reversal with a downside target at around 1.08700.
This is a high probability setup taken into account the overextended upside move to this resistance zone.
Just sharing my thoughts for the charts, this isn’t financial advice. Always confirm your setups and manage your risk properly.
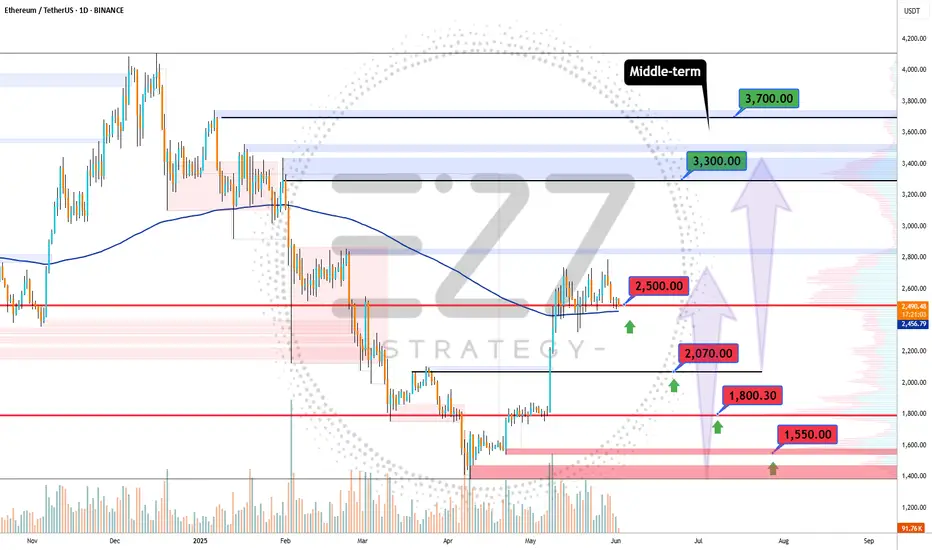
ETHUSDT minor trendsEthereum BINANCE:ETHUSDT is downtrend with lower highs from the bottom is nearly finished 📉 . For a stronger rise, it needs to stabilize above $2500 ⚡. Mid-term targets are $3300 (end of second leg) and $3700 (major resistance) 🎯. Key supports are $2500, $2070, $1800, and $1550, the base where the uptrend began 🛡️.
Supports & Resistances:
Supports: \$2500, \$2070, \$1800, \$1550
Resistances: \$2500 (critical level), \$3300, \$3700
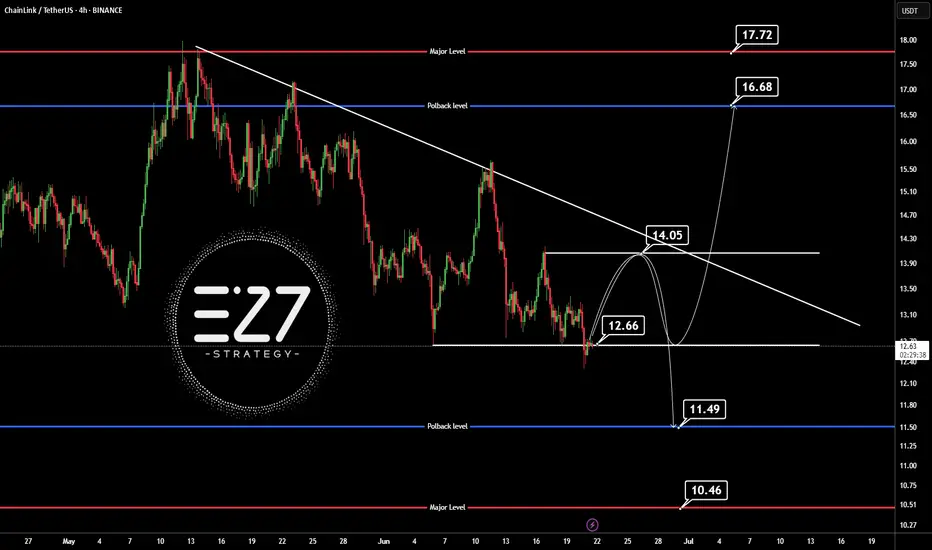
LINKUSDTThis is chart ready for pump but wait for break 14$. BINANCE:LINKUSDT
I in below say best supports and resistance's.
Support:
12.66
11.50
10.50
resistance's:
14
16.68
17.70
⚠️Contorl Risk management for trades.
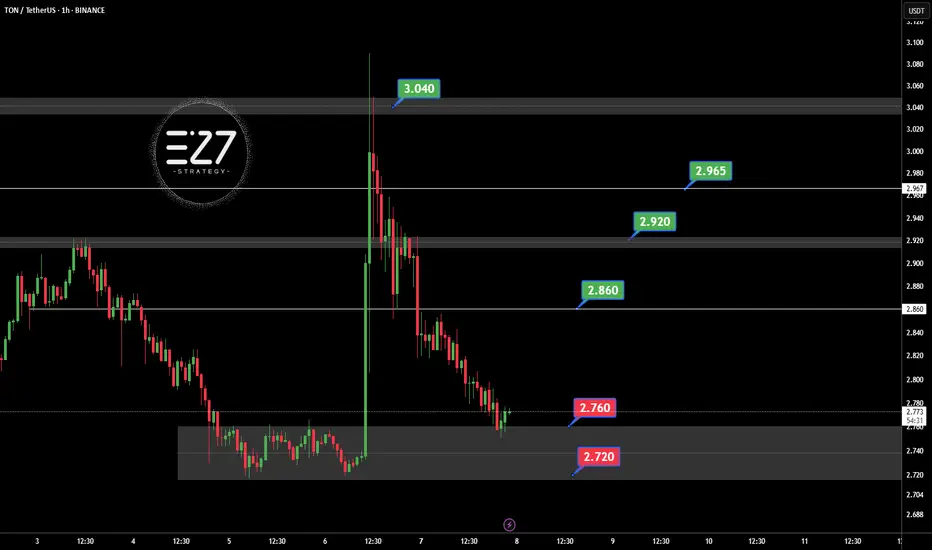
TONUSDT Following the official denial by UAE authorities regarding the possibility of obtaining a golden visa through staking OKX:TONUSDT , the bullish momentum driven by that rumor has faded. Selling pressure has increased, and TON is now consolidating within the key support zone of 2.720 to 2.760 USDT. If this support breaks, further downside is likely. However, if the price holds and reclaims the 2.860 USDT resistance, it could trigger a recovery toward 2.920 and 2.965 USDT. For now, the market sentiment remains bearish with a corrective bias.
Key Points:
UAE officially denied TON-based golden visa claims, weakening sentiment.
Current support zone: 2.720–2.760 USDT.
Key resistance: 2.860 USDT, then 2.920 USDT.
Break below 2.720 = further decline.
Break above 2.860 = potential bullish reversal.
⚠️ Please Control Risk Management in trades.
gold sellsGold sells from 3340
Trying to flow with price
Idk what else to write lol tradingview keeps saying its a brief description
closed at 3332

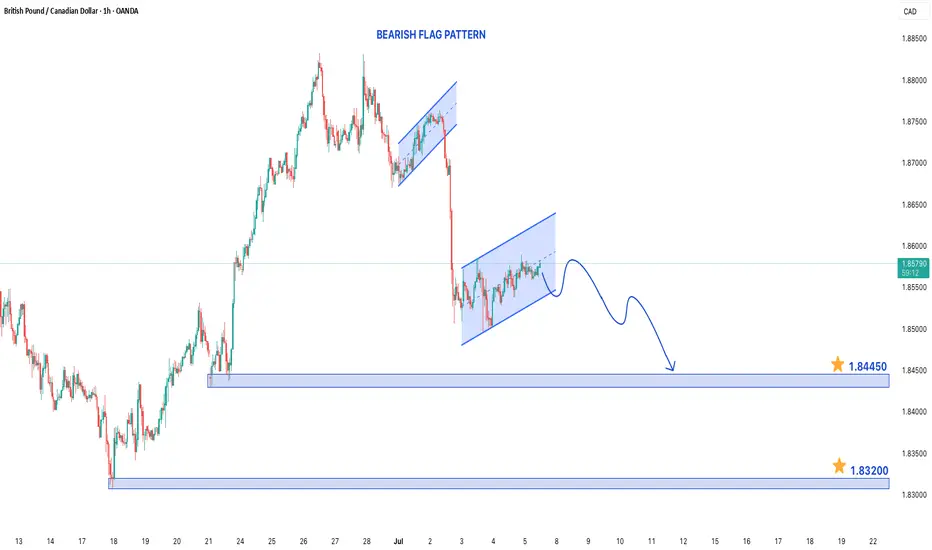
GBPCAD FORMING BEARISH FLAG PATTERNGBPCAD Bearish Trend Analysis (1-Hour Time Frame)
The GBPCAD pair is currently exhibiting a bearish trend on the 1-hour chart, with the market forming lower lows, confirming a sustained downward momentum. This price action indicates that sellers are in control, and the bearish sentiment is likely to continue in the upcoming trading sessions.
Bearish Flag Pattern Signals Further Decline
The price is forming a bearish flag pattern, a continuation pattern that often leads to further downside movement. This pattern suggests that after a brief consolidation, the pair may resume its downward trajectory. Traders should watch for a breakdown below the flag’s support, which could accelerate the decline.
Key Support and Resistance Levels
- Downside Targets: If the bearish momentum continues, the pair could test 1.84500, followed by 1.83200. These levels may act as potential take-profit zones for short positions.
- Upside Resistance: On the higher side, 1.87700 remains a critical resistance level. A break above this level could temporarily halt the bearish trend, but as long as the price stays below it, the downtrend remains intact.
Trading Strategy
- Short positions could be considered near resistance levels, with stop-loss orders placed above 1.87700 to manage risk.
- A confirmed breakdown below the bearish flag may present additional selling opportunities.
- Traders should monitor price action around support levels (1.84500 & 1.83200) for potential pullbacks or continuation signals.
Conclusion
With the lower lows formation and the bearish flag pattern, GBPCAD is expected to remain under selling pressure. Traders should watch for breakdowns below key support levels while keeping an eye on resistance at 1.87700 for any trend reversal signals.
Bitcoin Buy analysis/ideaThis analysis is based on the 4-hour and 1-hour timeframes and executed using Supply and Demand trading and trend formation. Complete explanation in the video!

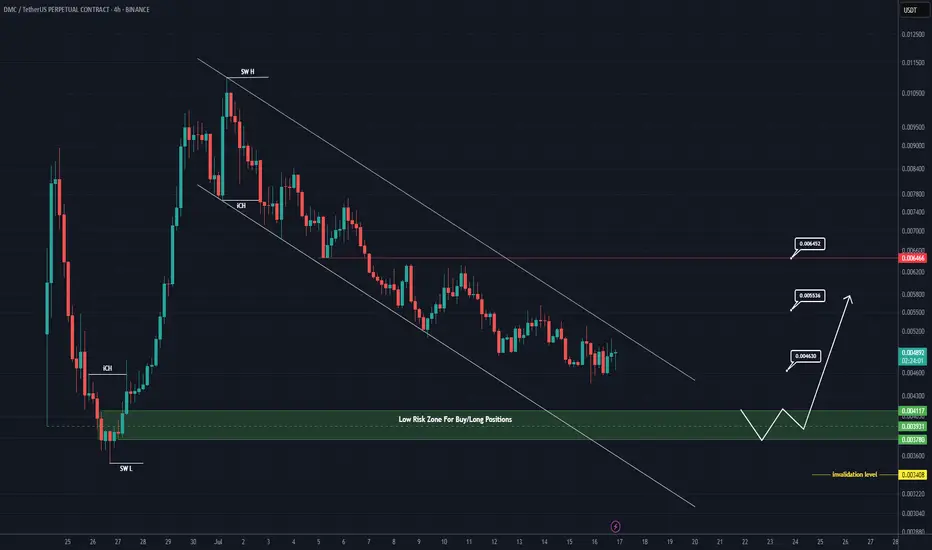
DMC Buy/Long Setup (4H)After a time-consuming bullish move in a compressed structure, the price is now approaching a key support origin.
Buy/long positions can be considered around the green zone.
Targets are marked on the chart.
A daily candle closing below the invalidation level will invalidate this analysis.
For risk management, please don't forget stop loss and capital management
When we reach the first target, save some profit and then change the stop to entry
Comment if you have any questions
Thank You
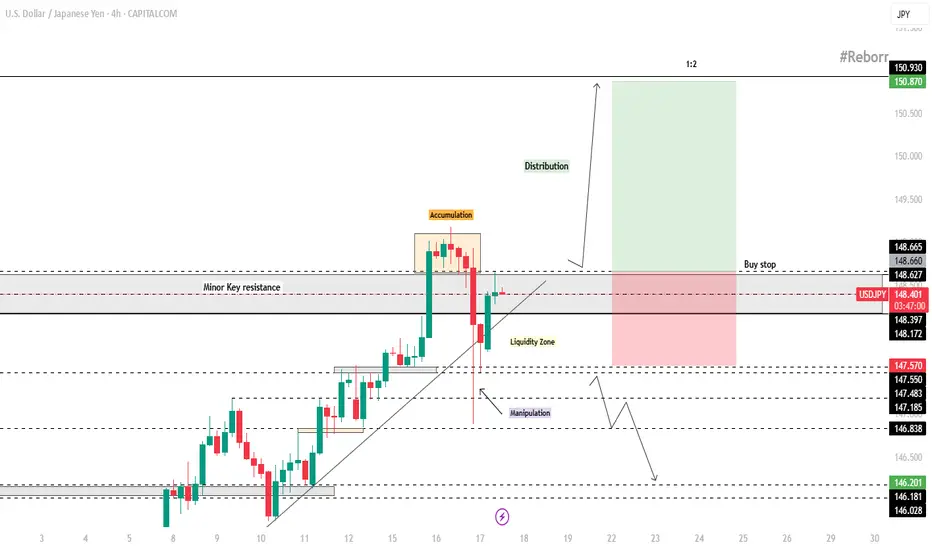
USD/JPY – 4H Technical and Fundamental AnalysisUSD/JPY – 4H Technical and Fundamental Analysis
USD/JPY continues to gain bullish momentum, driven by stronger U.S. inflation data and rising Treasury yields. These macroeconomic factors have tempered expectations of aggressive Fed rate cuts, strengthening the dollar across the board—including against the yen. The Federal Reserve’s cautious tone, amid inflation tied to tariff pressures, further supports dollar strength.
Meanwhile, Japan faces ongoing political uncertainty with an upcoming election, and US-Japan trade negotiations remain sluggish. This creates hesitation around any near-term monetary tightening from the Bank of Japan (BOJ), keeping the yen under pressure and enhancing the bullish outlook for USD/JPY.
From a technical perspective, USD/JPY has broken above the key resistance level at 148.300, signaling renewed buying interest. After a brief consolidation—interpreted as an accumulation phase—price executed a liquidity hunt, triggering stop-losses placed above the resistance. This manipulation move set the stage for a potential continuation higher. Price is currently hovering near a minor key level.
We are now watching for a clear candle close above the 148.300 zone to validate further upside momentum. Once confirmed, we aim to enter long on a breakout play.
📍 Buy Setup
Entry: Buy Stop at 148.660
Stop Loss: 147.570
Take Profit: 150.870
📌 Disclaimer:
This is not financial advice. Always wait for proper confirmation before executing trades. Manage risk wisely and trade what you see—not what you feel.
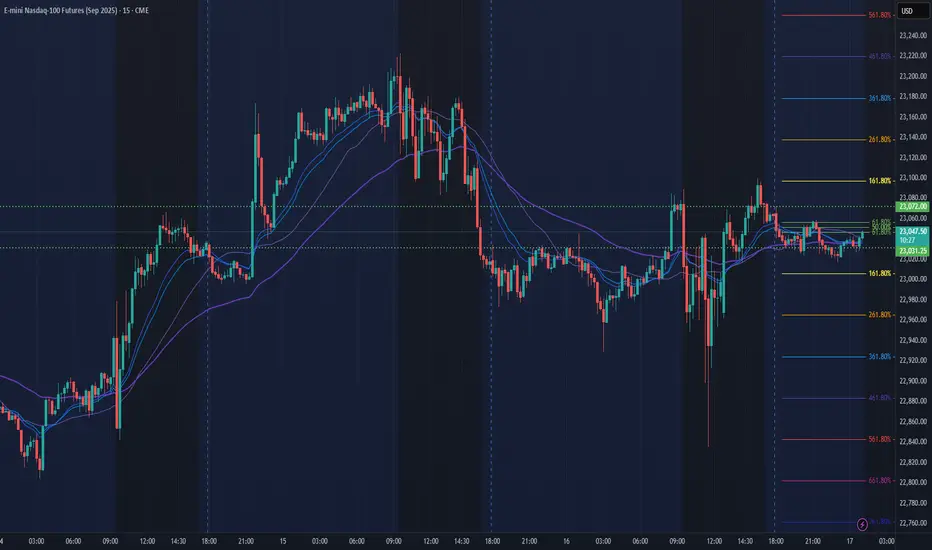
NQ Power Range Report with FIB Ext - 7/17/2025 SessionCME_MINI:NQU2025
- PR High: 23072.00
- PR Low: 23031.25
- NZ Spread: 91.25
Key scheduled economic events:
08:30 | Initial Jobless Claims
- Retail Sales (Core|MoM)
- Philadelphia Fed Manufacturing Index
Session Open Stats (As of 12:35 AM 7/17)
- Session Open ATR: 274.88
- Volume: 18K
- Open Int: 268K
- Trend Grade: Neutral
- From BA ATH: -0.8% (Rounded)
Key Levels (Rounded - Think of these as ranges)
- Long: 23239
- Mid: 21525
- Short: 20383
Keep in mind this is not speculation or a prediction. Only a report of the Power Range with Fib extensions for target hunting. Do your DD! You determine your risk tolerance. You are fully capable of making your own decisions.
BA: Back Adjusted
BuZ/BeZ: Bull Zone / Bear Zone
NZ: Neutral Zone
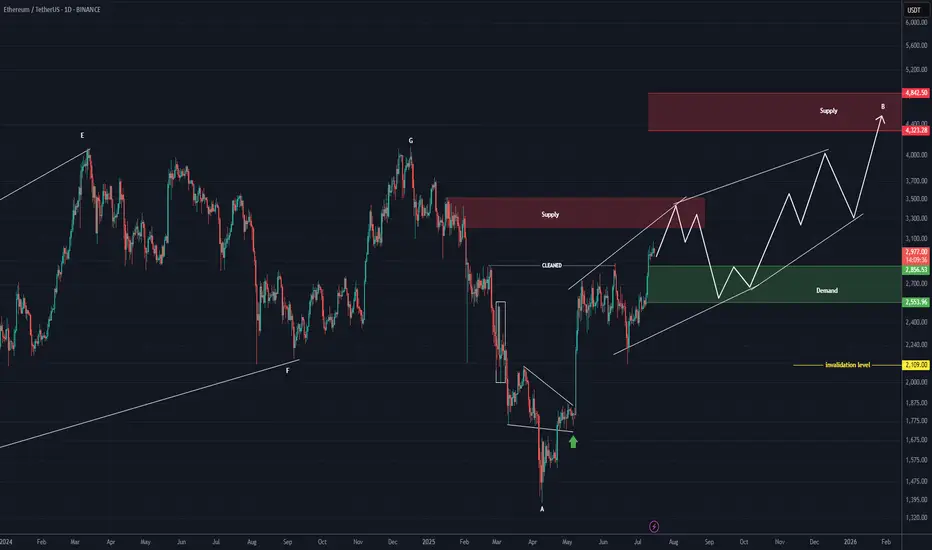
ETHEREUM Roara Map (1D)The previous phase of Ethereum appears to have been a completed diametric, and now it seems we are in a flat pattern.
It can be said that we are currently in wave B of the flat, which itself appears to be a diametric.
This diametric could even extend to the 4300–4800 range.
The green zone is the rebuy area.
A daily candle close below the invalidation level would invalidate this analysis.
For risk management, please don't forget stop loss and capital management
Comment if you have any questions
Thank You
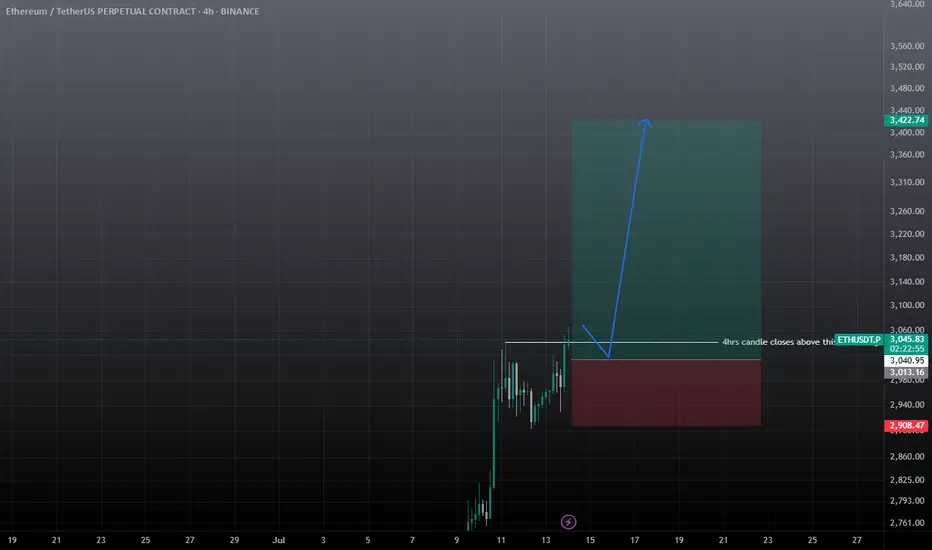
ETHUSDT BUY / Long SetupThis 4hrs candle closes above the mentioned level, then took long from 50% fib level of the fvg, and put sl below the recent swing low, I will update the trade whether it's active or not? tp towards 3.3-3.4k , while btc.d getting recked so becareful shorting any altcoin.
EURJPY ANALYSIS After seeing the previous daily candle close bearish and close below the low of the previous bullish candle and also a break if the 4hr structure support, we could expect this pair to make a sell off to the downside

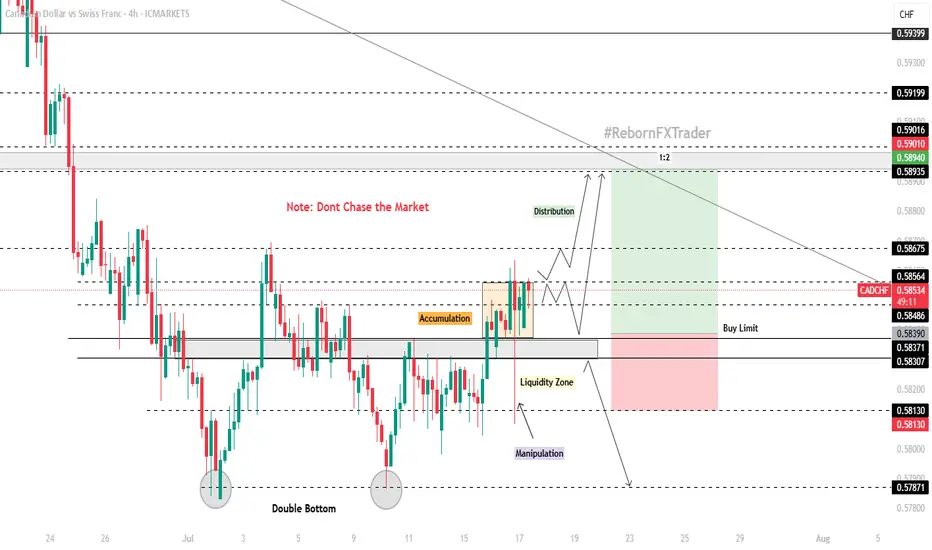
CAD/CHF 4H Technical and Fundamental AnalysisCAD/CHF 4H Technical and Fundamental Analysis
CAD/CHF has shown bullish potential this week, supported by strengthening fundamentals and a technical breakout. From a macro perspective, the Canadian dollar (CAD) continues to benefit from rising crude oil prices, a key Canadian export. With WTI crude trading above $80 per barrel, the commodity-backed CAD gains further momentum. Meanwhile, the Swiss franc (CHF)—often viewed as a safe haven—is seeing mild outflows as risk appetite improves globally and capital shifts toward higher-yielding assets.
From a central bank standpoint, the Bank of Canada (BoC) has struck a cautiously optimistic tone regarding inflation, while the Swiss National Bank (SNB) has already begun cutting interest rates—creating a divergent policy path that favors CAD strength against CHF.
On the technical side, CAD/CHF recently found strong support in the 0.57800–0.58100 zone, where price formed a potential double bottom pattern just below key resistance—a signal often associated with bullish reversal. A minor key level at 0.58300 was broken, followed by a clear accumulation phase. After consolidation, price grabbed liquidity with a long wick but closed above the key level, forming a bullish engulfing candle, suggesting strong buying pressure.
We now await a retracement into our zone of interest to position long entries with favorable risk-reward.
📍 Buy Setup:
Entry: Buy Limit at 0.58390
Stop Loss: 0.58130 (below liquidity grab)
Take Profit: 0.58940 (next key resistance)
📌 Disclaimer:
This is not financial advice. Always wait for proper confirmation before executing trades. Manage risk wisely and trade what you see—not what you feel.
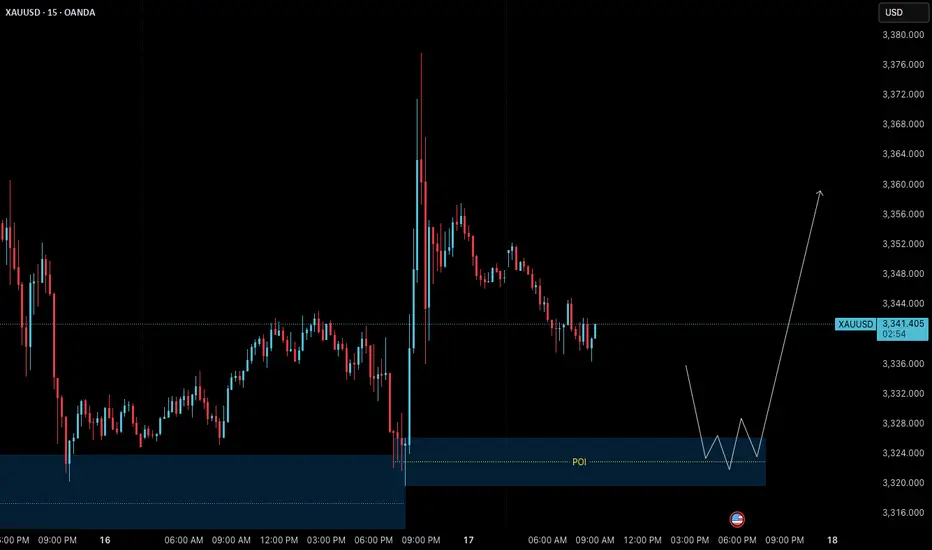
Gold (XAUUSD) – 17 July Analysis | Demand Zone in Play🟢 Gold (XAUUSD) – 17 July Analysis | Demand Zone in Play
Gold continues to follow the bullish structure we’ve been tracking in our recent posts. Yesterday's news-driven price action pushed the market to a new swing high near 3377.600 , confirming strength in higher timeframes. Now, price is currently in a retracement/pullback phase , pulling back toward a key intraday demand zone at 3326–3320 — offering potential opportunity for the next leg upward.
🔍 Where Are We Now?
The market is currently pulling back toward a key M15 demand zone: 3326–3320 . This level also aligns with a higher timeframe order block on the H4, making it a critical confluence area for structure-based traders.
This 3326–3320 zone is crucial because:
→ It’s a fresh M15 demand zone inside a higher timeframe bullish structure
→ It aligns with the H4 OB that previously acted as a launchpad
→ The overall trend remains bullish unless this zone is decisively broken
If the zone holds and we get LTF confirmation (such as M1 internal structure shift + micro-BoS), it may present a high-probability long setup.
⚙️ Structure Summary:
✅ H4: Bullish continuation structure with recent higher high
✅ M15: Pullback within bullish order flow
✅ M1 (for entry): Awaiting ChoCH + BoS as entry trigger inside POI
📌 Trade Setup Plan (upon confirmation):
→ Entry: From 3326–3320 demand zone
→ Stop Loss: 40 pips below entry
→ Take Profit: 120 pips (targeting new HH based on H4 projection)
→ Risk-to-Reward Ratio: 1:3
🧠 Key Trading Insight:
We never predict — we prepare .
We don’t chase price — we position with confirmation .
Discipline means waiting for price to invite us in , not entering just because a level looks attractive.
📈 Summary & Expectations:
➡️ Price is retracing into a structurally significant demand zone
➡️ Market bias remains bullish unless this zone fails
➡️ If the zone holds with valid M1 confirmation, we’ll consider a long setup targeting a new high
➡️ No confirmation = no trade. Patience > prediction.
📘 Shared by @ChartIsMirror
This analysis is part of our ongoing structure-based approach to trading Gold. All entries are derived from pure price action, multi-timeframe structure alignment, and trader discipline — as taught in our book:
“The Chart Is the Mirror: Mastering Gold with Structure, Stillness, and Price Action”
Gold Trade Setup Eyes on 15M Demand ZonePrice is coming close to 3338, where we have a 15-Minute Order Block (OB) 📍. This is a fresh demand zone and can give a bullish reaction when price taps into it 🟢.
📌 Plan:
We will wait for price to tap the OB ✅
If we see bullish signs like rejection wicks or bullish candles, we will enter a buy 📈
Our target will be near 3366, just below the bearish FVG 🎯

DOGE Short SetupTight SL, 1:3 Risk-Reward.
We might go higher, but current key levels and price actions tells me to go short setup.

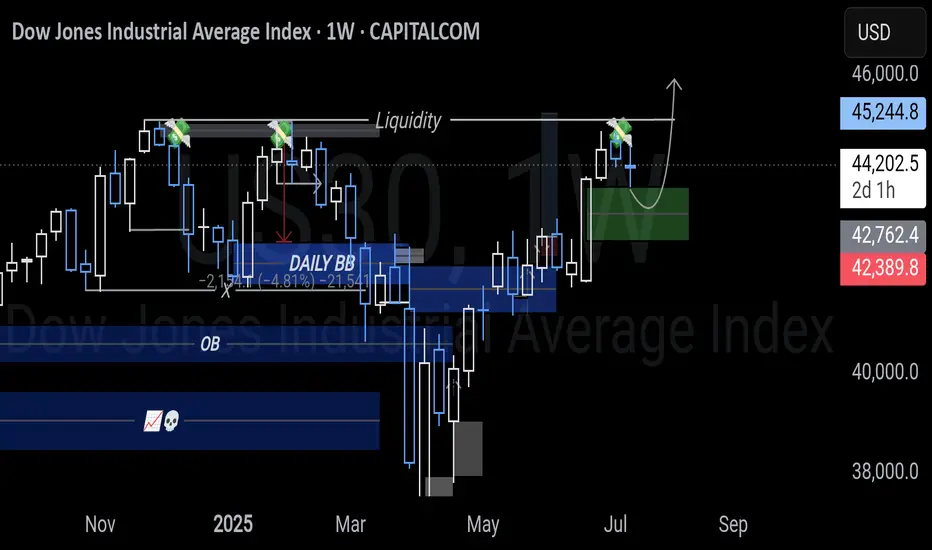
US30 DOW BULLISH ANALYSIS Triple tops are the next liquidity targets from a fvg support as shown. the tops are week as we have seen NASDAQ and S&P500 hav3 liquidated their highs its. Lear US30 is following the same path.