[$CLSK] CleanSpark Inc. - Farming [$BTC] LongNASDAQ:CLSK
no finanical advice
📑market outlook
+ Fed rate cut priced in --> short term risk-on environment
+ total FIAT-debasement in motion --> Precious &Crypto are poomping
- geo-political risk can drag down the 'weaker ANTI-Fiat' risk-on positions
💡idea
we want to farm BTC indirectly by selling covered-calls /placing cash secured puts
🧪approach
derivatives options with i.e. 0.1 BTC ~ 10,000 USD
🏁target
get 2% yield per month
⚠️ caution
Only weekly options: --> Crypto Cycle could take hits of -50% which would basically demolish your position
--> check weekly volume/sentiment on BTC
Don't forget:
⏳ Theta is our alley. Always have been!
Supply and Demand

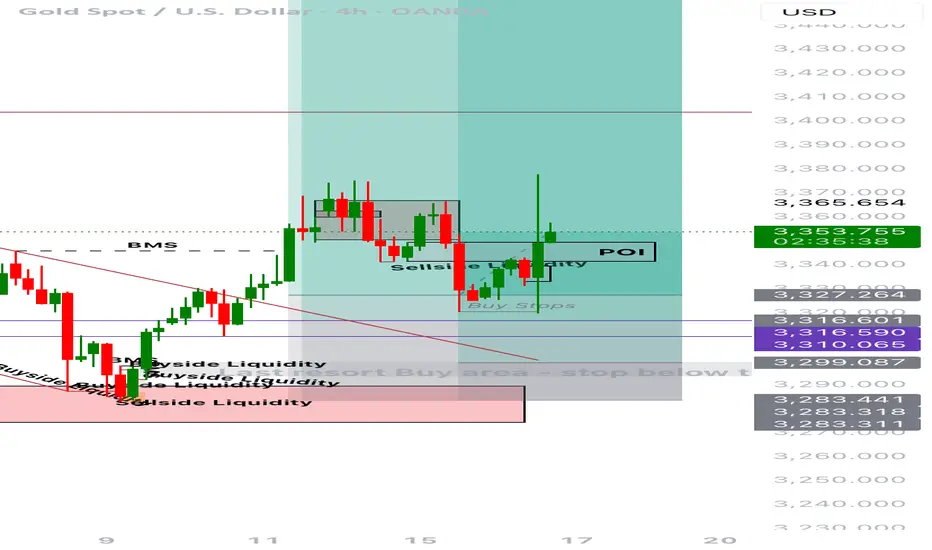
Potential buys?Trade Journal Entry – XAUUSD (Gold Spot)
Date: July 16, 2025
Platform: TradingView (Demo Account)
Timeframe: 4H
Direction: Long
Status: Active, In Profit
Unrealized Profit: +301.54 GBP
Entry: ~3,327
Stop Loss: Below 3,316 zone
Take Profit (TP): ~3,492
Risk:Reward Estimate: ~1:4 or better
Market Context
Previous pullback into the sell-side liquidity and POI zone held firmly.
Price rejected from POI and aggressively moved upward, confirming bullish order flow.
POI (Point of Interest) is marked intentionally — awaiting a return to the zone after price closes above the wick.
A full buy confirmation is expected only upon a bullish close above the wick, followed by a retest into the POI.
Trade Logic
Trade was initiated based on:
- Break of market structure (BMS)
- Sweep of sell-side liquidity
- Bullish intent shown via momentum candles
- Expectation: price returns to POI after wick close for full confirmation
Management Plan
- Consider partial TP at 3,365–3,375 zone.
- Trail SL below latest higher low on lower TF.
- Wait for price to revisit POI after close above wick before scaling in full size.
Emotional Reflection
Feeling composed. The trade plan is well-structured with a POI-based confirmation strategy. No rush to fully size until POI is respected post-wick close.
Reflection Questions
- Did I stick to my POI confirmation logic?
- Am I patient enough to wait for a close above the wick?
- Is my entry risk properly managed while awaiting confirmation?
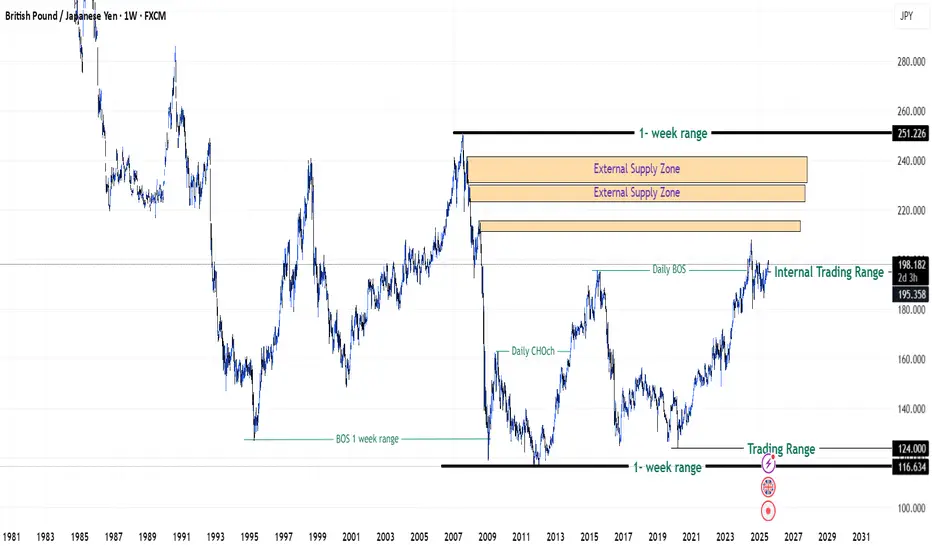
GBPJPY in Premium Zones of 2008 Financial Crisis - {17/07/2025}Educational Analysis says that GBPJPY (FX pair) may give trend Trading opportunities from this range, according to my technical analysis.
Broker - FXCM
So, my analysis is based on a top-down approach from weekly to trend range to internal trend range.
So my analysis comprises of two structures: 1) Break of structure on weekly range and 2) Trading Range to fill the remaining fair value gap
Will Jpy start to lose value like it is doing since 2019 or it will do free fall same like 2008 crisis.
Let's see what this FX pair brings to the table for us in the future.
Please check the comment section to see how this turned out.
DISCLAIMER:-
This is not an entry signal. THIS IS FOR EDUCATIONAL PURPOSES ONLY.
I HAVE NO CONCERNS WITH YOUR PROFIT OR LOSS,
Happy Trading.
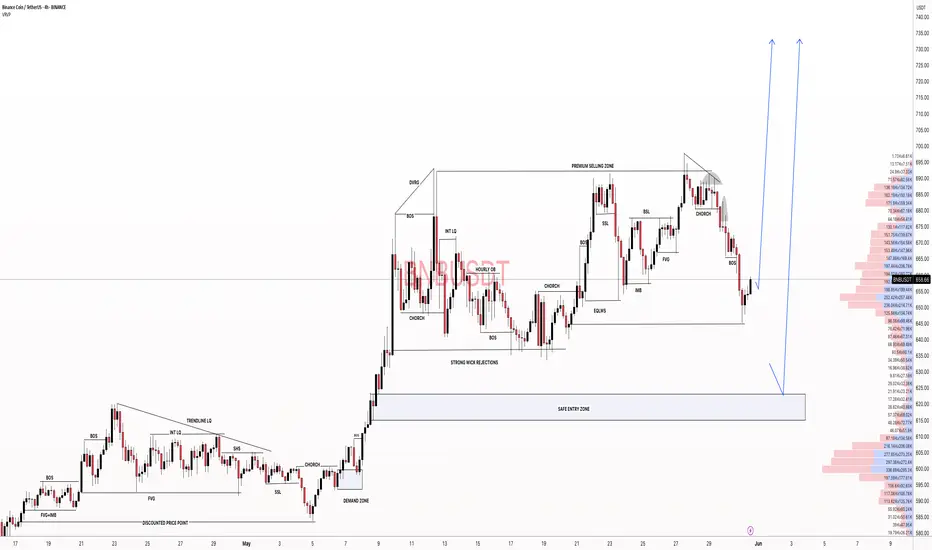
#BNBUSDT: A Major Bull Move Incoming $1000 Target! Binance coin is currently in consolidation phase, with no clear direction of where it will go. We consider two possible areas where it may reverse. Both of these areas have a chance to hit $1000, which we believe the price could head towards once reversed.
If you like our idea, please like and comment!
Good luck and trade safely,
Team Setupsfx_
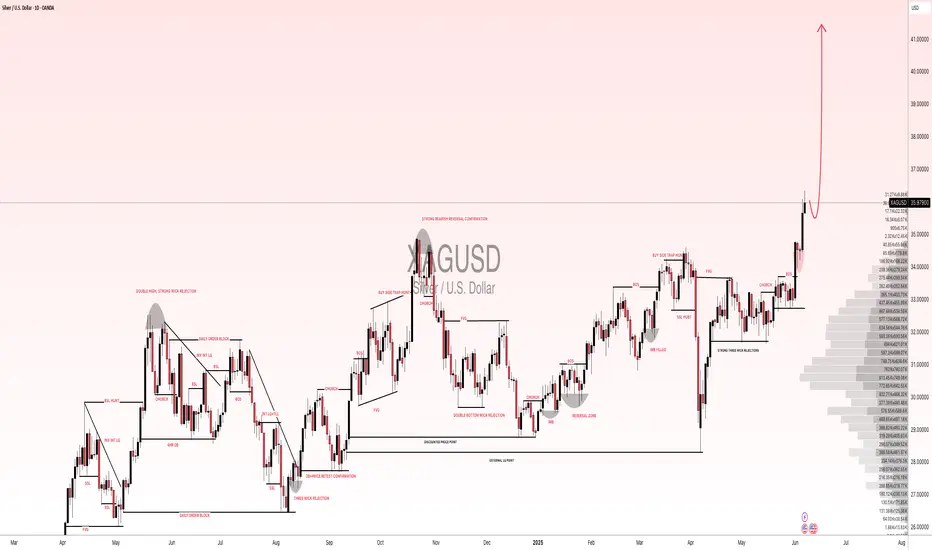
XAGUSD(SILVER):To $60 the silver is new gold, most undervaluedSilver has shown remarkable bullish behaviour and momentum, in contrast to gold’s recent decline. Despite recent news, silver remains bullish and unaffected by these developments. We anticipate that silver will reach a record high by the end of the year, potentially reaching $60.
There are compelling reasons why we believe silver will be more valuable in the coming years, if not months. Firstly, the current price of silver at 36.04 makes it the most cost-effective investment option compared to gold. This presents an attractive opportunity for retail traders, as gold may not be suitable for everyone due to its nature and price.
Silver’s price has increased from 28.47 to 36.25, indicating its potential to reach $60 in the near future. We strongly recommend conducting your own analysis before making any trading or investment decisions. Please note that this analysis is solely our opinion and does not guarantee the price or future prospects of silver.
We appreciate your positive feedback and comments, which encourage us to provide further analysis. Your continuous support over the years means a lot to us.
We wish you a pleasant weekend.
Best regards,
Team Setupsfx
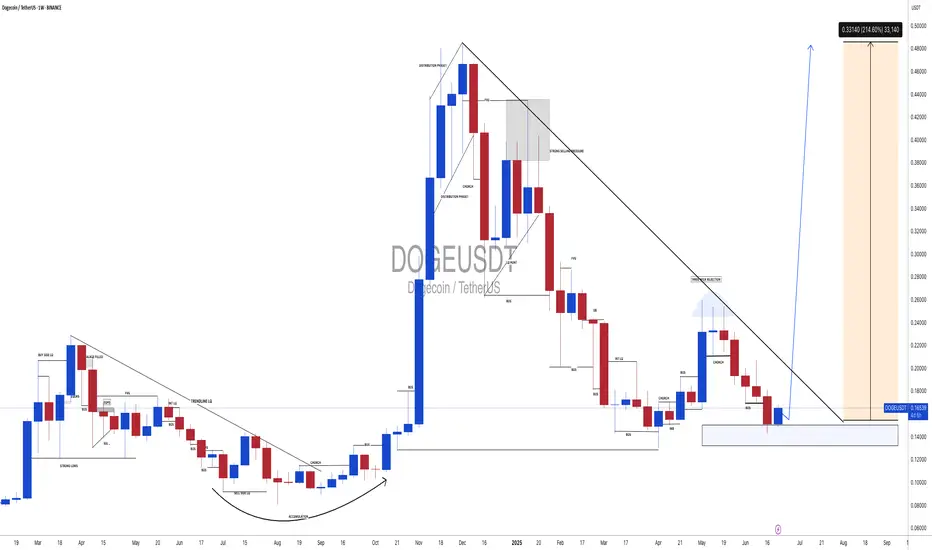
DOGEUSDT: Time For Bulls To Rule! The Dogecoin is currently trading at a key buying level, making it a potential opportunity to buy. However, we need confirmation before making a purchase or entering a trade. This trade could take time to develop as we are currently in the accumulating phase. To be certain of the price direction, we need to enter the distribution phase. While a single swing trade could be a target, you can set your own risk management parameters.
Good luck and trade safely!
Team Setupsfx_
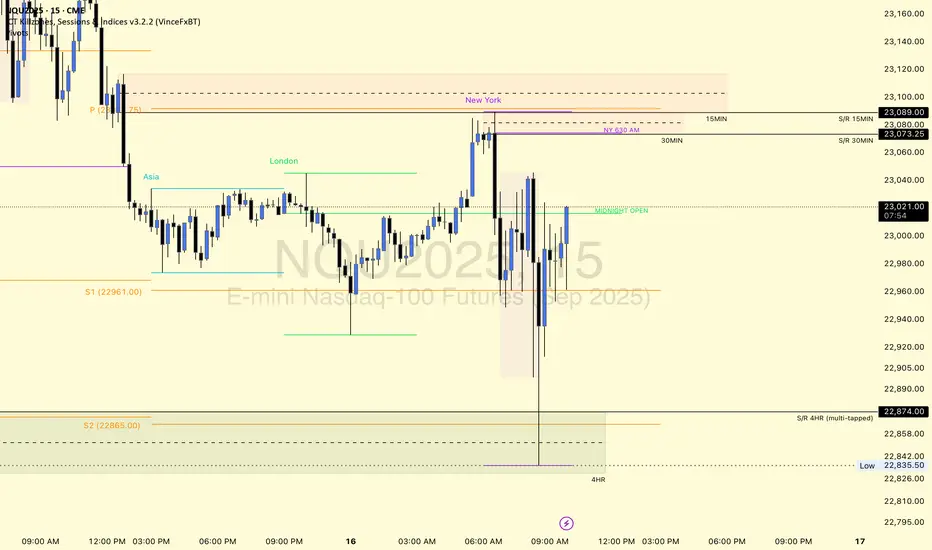
$NQ Supply and Demand Zones 7/16/25This is for SEED_ALEXDRAYM_SHORTINTEREST2:NQ chart specifically.
Posting for the YouTube fam and to hold myself accountable.
We broke through many demand zones after failing to break newer highs and the 2 news releases.
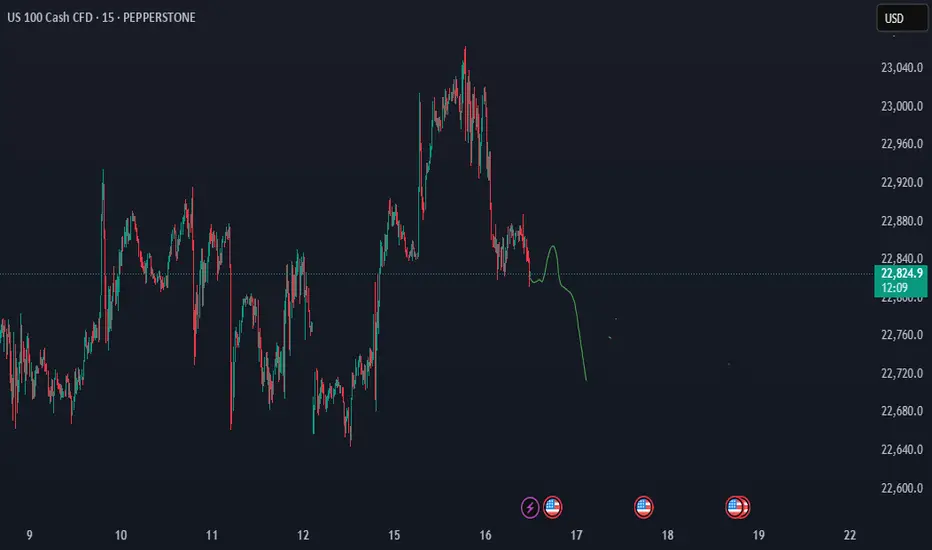
NASDAQ possible Down Reverse Zone For Short Term According to the current market situation, the strength of sellers getting little bit stronger as yesterday news makes USD stronger. Let's see how things going on and waiting for a one up pullback for make day trading sell entry
Roblox to $110I don't know much about Roblox except that my nieces play it and their gross profits are insane. Should be a pretty likely move to $110. It's currently trading at 12X revenue. My best guess is Hindenburg did a number on keeping this stock down.
Good luck if you take this trade!

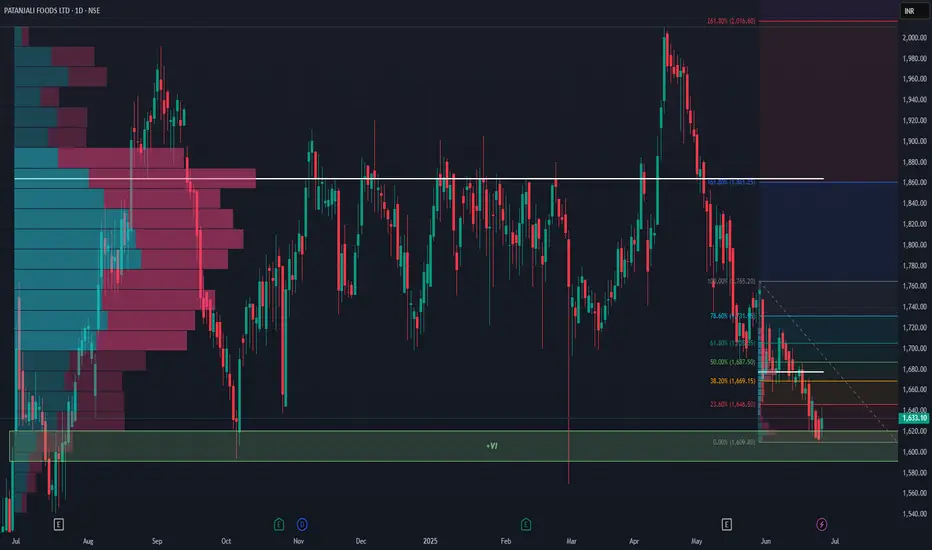
Patanjali Foods: A Potential Reversal Brewing Near Demand Zone?The price has now retraced back into a key value zone between 1,610 - 1,635, which has previously acted as a strong base. This zone also coincides with high volume activity on the visible range volume profile - suggesting accumulation interest.
Technically, the stock is near the 0% Fibonacci extension with multiple confluences of past support and volume, forming a potential base.
If this holds, look for retracement targets:
• First bounce zone: ₹1,687 (50% Fib)
• Further recovery: ₹1,745–₹1,775 (Fib 61.8–78.6%)
Long-term: ₹1,861 (161.8% Fib extension), ₹2,016 (261.8%)
Fundamentals Snapshot:
• Market Cap: ~₹58,000 Cr
• P/E: ~34x | P/B: ~3.8x
• Promoter Holding: 80.82% (No pledging)
• Debt-to-Equity: ~0.25
• ROCE: ~13.2% | ROE: ~10.4%
• FII Holding: 3.6%, DII Holding: 6.3%
Patanjali’s brand strength in edible oils, packaged foods, and growing FMCG integration offers secular demand visibility. The recent correction seems sentiment-driven, not structural.
Keep in Focus:
A decisive close above 1,660 could indicate a short-term reversal.
This chart is for educational use only and not a buy/sell recommendation.
GBPUSD – Levels, Adjustments, and Scenario PlanningAs mentioned in our pinned analysis, we had two levels on GBPUSD —
✅ Both of them were broken.
📉 After the break of the first level, we shorted the pullback and took a great profit.
📍 Now after the second level has also broken, I’ve adjusted the level slightly —
There’s a chance price retraces to 1.35774 before continuing its drop.
🟢 Below, there’s a solid buy zone.
🔁 My Updated Scenarios:
✅ If price pulls back to the short level before hitting the buy zone → I’ll take the short.
⚠️ But if price touches the buy zone first, then any short afterward will just be partial or used for pyramiding — not a major trade.
Let’s stay patient and let the market tell us what to do.
📌 All previous scenarios are still valid.

EURCAD – Two Key Levels, One Solid PlanOn this pair, we have two important levels:
🟡 The first level might act as a trap (stop hunting).
So don’t rush to buy — wait for confirmation.
🟢 The second level offers a safer buy opportunity.
As always, our plan stays firm —
we don’t tell the market what to do, we follow it.
🔻 If a clean break and valid pullback occurs on the first level,
a short trade toward the lower level is possible.
⚠️ This pullback short scenario is only valid until price reaches the lower level.
If price hits the lower level and starts moving up,
any short position becomes much riskier.
Discipline > Prediction.

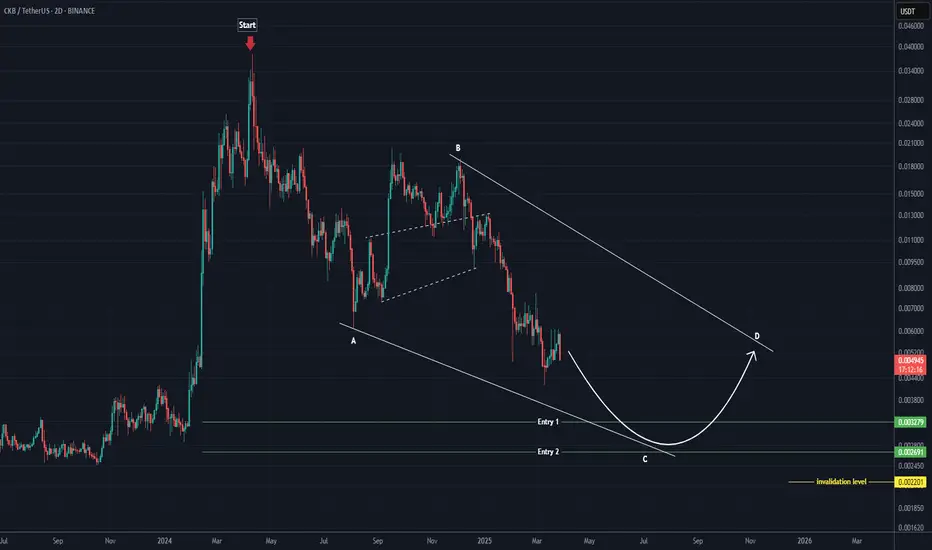
Where is the rebuy zone for CKB? (2D)From the point where we placed the red arrow on the chart, the CKB correction has begun.
It seems that CKB is in a bearish wave C.
We have identified two entry points for rebuy, where a position can be taken in the spot market.
A daily candle closing below the invalidation level will invalidate this analysis.
For risk management, please don't forget stop loss and capital management
Comment if you have any questions
Thank You
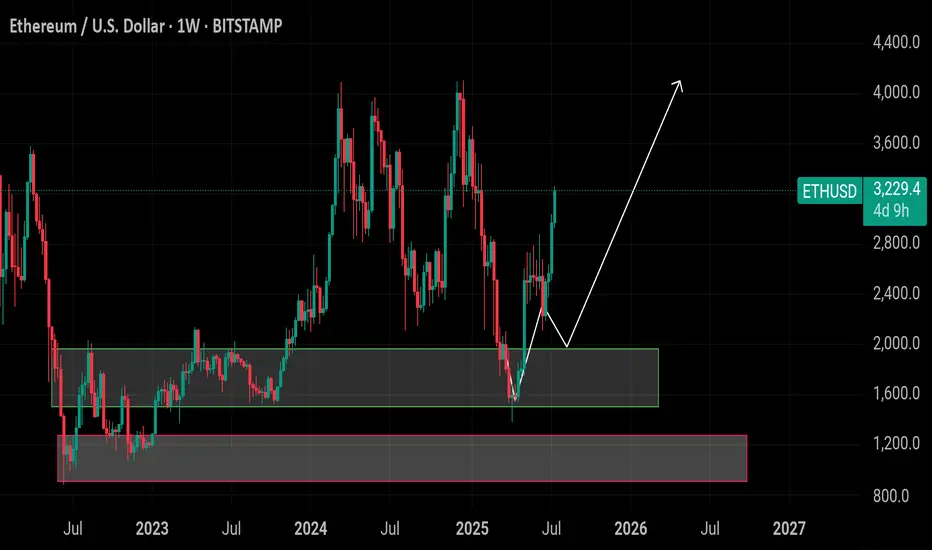
Ethereum $ETH – Perfect Accumulation to Rally Move!
🔸 Ethereum CRYPTOCAP:ETH – Perfect Accumulation to Rally Move!
ETH perfectly hit our long-term buying zone between $1,900 – $1,500, where we accumulated heavily. This range once again acted as a strong demand zone and launchpad.
🔸 Target: $4,000 – $4,500
After hitting our buying range, ETH has now rallied to $3,250 — showing strong bullish momentum. If price continues to hold above $3,000, the next target zone is $4,000 – $4,500.
🔸 Risk Level:
Any breakdown below $2,200 would weaken the structure and shift the bullish outlook. This is our invalidation level on a higher time frame.
🔸 Outlook:
Partial profit-taking around $3,200 – $3,500 zone
Hold remaining positions for $4,000+ targets
Use $2,900 – $3,100 zone for fresh or re-entries on dips
Maintain tight stop loss under $2,200 if adding new exposure
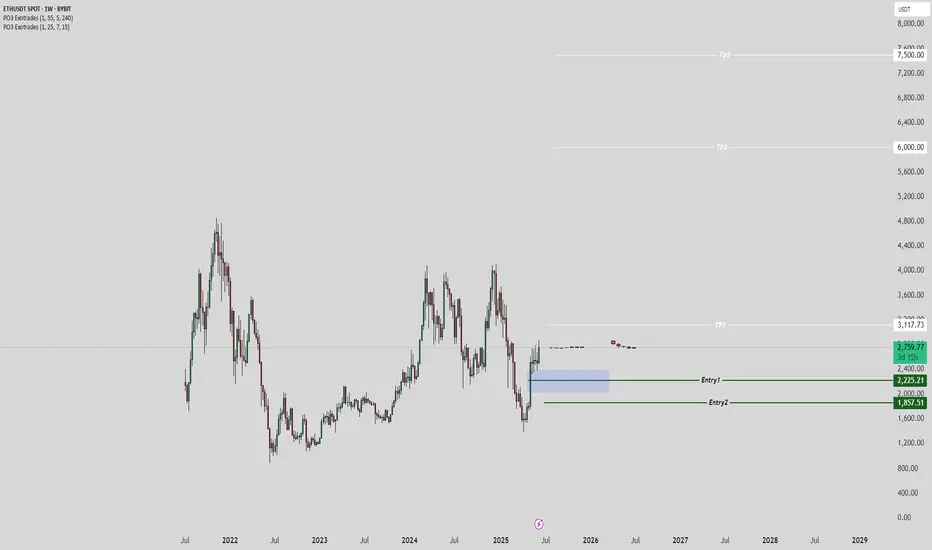
Ethereum's Road to $7500 – Strategic Entries & Profit Optimizati🔵 Entry Zone: My first position is placed at $2225.5, aligning with a strong support level, while a secondary entry at $1857.5 serves as an additional safeguard against unexpected market swings—lowering my average purchase price and protecting capital.
💰 Profit-Taking Strategy: For low-risk traders, securing a 40% profit from the first entry is a prudent move to lock in gains early. However, my long-term target remains ambitious.
🚀 Main Target: Based on valuation models and fundamental news, Ethereum’s upside potential points toward $7500. However, I personally plan to secure 90% of my holdings at $6000, ensuring strong profit realization while leaving room for further upside.
This setup balances risk management, smart positioning, and strategic profit optimization. Let’s see how ETH’s trajectory unfolds!
Entry1: 2225.5
Entry 2: 1857.5
If your second entry is successful, you are required to withdraw 50 to 70 percent of your capital to maintain your capital. I will definitely update this setup.
BTC 16.07.25Looking for LTF distribution to take out liquidity and create a MTF accumulation to then go higher.

NQ - Long Scalp/SwingYo everyone. Here is what I'm seeing for NWQ today. I'm very bullish because of market structure.
Confirmations:
Bullish 1HR Break of Structure
Intermediate Lows holding
Multiple Bullish FVGs
We may not get an entry lower but we ARE going up.
Happy trading!

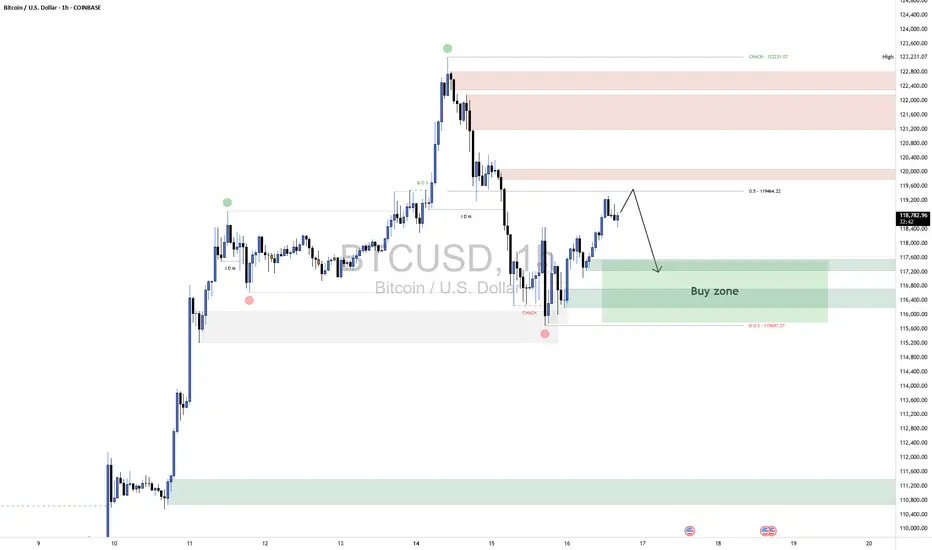
BTCUSD ShortBTCUSD 1H Technical Analysis
⚙️ Scenario Outlook:
Bias: Bearish
Preferred Play: Wait for price to enter the 119,000–120,000 supply zone. If price shows signs of exhaustion or bearish confirmation (e.g. bearish engulfing, strong rejection), a short position becomes favorable.
Targets: First target at 117,200; final target near 115,600–115,000 range, depending on how price behaves within the intermediate demand.
🔼 Supply Zone (Resistance):
Zone: 119,000–120,000
This red zone marks a previously unmitigated supply area aligned with the 50% Fibonacci retracement level from the prior bearish impulse. It's expected to act as the final resistance before the next move lower. A rejection from here would confirm bearish intent and offer optimal risk-to-reward for short setups.
🔽 Demand Zones (Support Targets):
First Demand Zone: 117,200–117,600
This green border is your first liquidity pocket to watch. It may offer a brief reaction or bounce, but if bearish momentum holds, price is likely to continue through it.
Deeper Demand Zone: 115,600–116,200
This is the stronger accumulation area, marked by your lower green zone. It sits just above the previous CHoCH and BOS lows, making it a prime liquidity sweep and reversal candidate if price moves deeply into it.
Rising into big selling volumeIf it holds .60 seems bullish due to selling be absorbed, otherwise looking for it to dip to high volume node at .40 and rise on fundamentals.

Dynemic Ltd: Bullish Setup UnfoldingDynemic Products Ltd (NSE: DYNPRO) is a well-established exporter and manufacturer of synthetic food-grade dyes, lake colors, and D&C colors, catering to global markets. As of July 16, 2025, the stock trades at ₹341 and has recently broken out of a prolonged consolidation zone, indicating renewed investor interest.
From a fundamental perspective, the company’s financials show notable improvements:
🔸 Revenue (FY25): ₹214 crore, up 29% YoY
🔸 Net Profit (FY25): ₹15 crore, up 269% YoY
🔸 EPS (TTM): ₹3.65
🔸 P/E Ratio: ~23× – moderately valued
🔸 P/B Ratio: ~1.56× – near fair book value
🔸 ROE: ~7%, showing improving return to shareholders
🔸 ROCE: ~12.7%, indicating decent operational efficiency
🔸 Debt-to-Equity: ~0.43× – financially stable
🔸 Current Ratio: ~0.95× – slightly below ideal liquidity levels
🔸 Operating Cash Flow: ₹28 crore – healthy cash generation
While the company has a stable balance sheet and growing profitability, investors should note that liquidity remains slightly tight, requiring careful monitoring of working capital and short-term obligations. Nonetheless, the financial turnaround and earnings consistency signal strength.
On the technical front, the stock has shown strong bullish action after breaking above a multi-month resistance:
🔹 Breakout Zone Cleared: ₹325–₹330 (previous resistance)
🔹 Current Price: ₹341
🔹 Reversal Zone (Strong Support): ₹292 to ₹304
🔹 R1: ₹392 – short-term resistance
🔹 R2: ₹469 – medium-term target
🔹 R3: ₹615 – long-term upside if momentum sustains
The breakout is confirmed with increased volume and a clear higher-high, higher-low structure, validating bullish sentiment. The price now rides above a rising trendline, suggesting trend continuation unless a breakdown occurs below ₹292.
In summary, Dynemic Products Ltd currently offers a compelling techno-fundamental setup. The financials have improved significantly, valuations remain reasonable, and the technical breakout suggests potential for further upside. Investors can consider accumulating on dips above ₹304, while swing traders may target ₹392 and ₹469 in the short-to-medium term. A close watch on liquidity and cash flows is advised, but the stock presents a strong growth case in the specialty chemicals space.
Disclaimer: lnkd.in

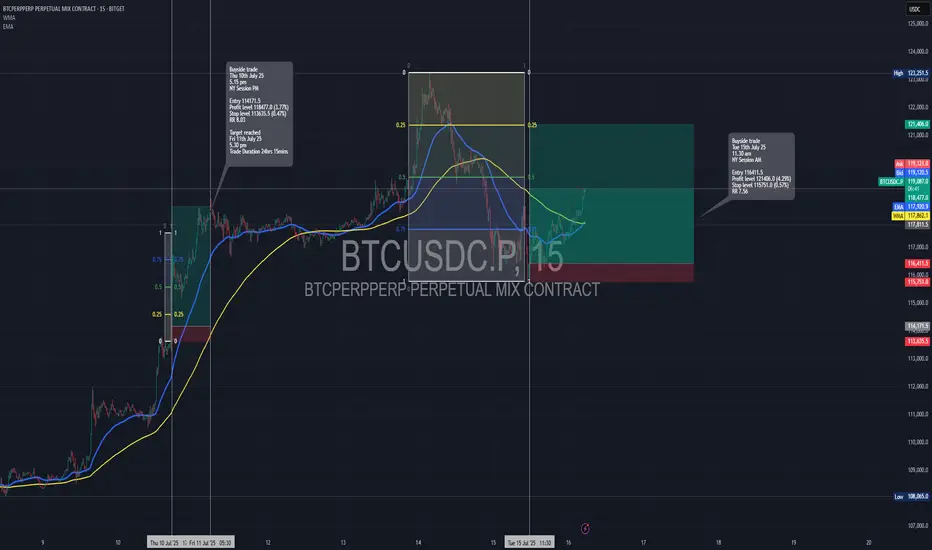
Long trade
15min TF
BTCUSD Perpetual – 15-Minute Chart Analysis
Key Trades Highlighted
Trade #1:
Type: Buyside trade
Entry: 114,171.5
Profit Level: 118,677.0 (+3.97%)
Stop Level: 113,635.5 (–0.47%)
Risk/Reward: 8.63
Entry Time: Thu 10th July 25, 5:15 pm (NY Session PM)
Target Reached: Fri 11th July 25, 5:30 pm
Trade Duration: ~24 hrs 15 min
Trade #2:
Type: Buyside trade
Entry: 116,411.5
Profit Level: 121,406.0 (+4.29%)
Stop Level: 115,751.0 (–0.57%)
Risk/Reward: 7.56
Entry Time: Tue 15th July 25, 11:30 am (NY Session AM)
Chart Structure & Technicals
Trend: Strong bullish impulse, minor retracement, continuation attempt.
Moving Averages:
EMA (blue): 117,873.4 (dynamic support/resistance)
WMA (yellow): 117,858.0 (price riding above, confirming bullish momentum)
Key Levels:
Resistance: 121,406 – 121,390 zone (Profit Target)
Support: 116,416 – 116,411 zone (entry confluence for current trade), 115,751 (stop)
Major Swing Low: 113,635 (protective stop on previous trade)
Volume/Orderflow Insights
Impulse up from below 114k, pausing at 121k resistance.
Volume is considered likely to increase at key support zones (116,400–116,000) and around target/profit-taking regions.
Actionable Trade Ideas
If Long:
Stay in: As long as price holds above the 116,411–116,416 support, with stops below 115,751.
Targets: 121,406 (major), consider partials at prior swing highs or if momentum stalls.
If Not In:
Re-entry Zone: Watch for bullish reaction at 116,416–116,000; enter on confirmation (engulfing, break of LTF structure).
Invalidation: Clean 15-min close below 115,751, or signs of heavy sell pressure.
If Short Bias:
Wait for a break and retest below 115,751 for a possible short to 114,700, but primary bias remains bullish above this zone.
Summary Table
Trade Direction Entry Stop Target R: R Duration Status
#1 Long 114,171.5 113,635.5 118,677.0 8.63 24h 15m Closed TP
#2 Long 116,411.5 115,751.0 121,406.0 7.56 In Progress Active trade
Outlook
Maintain bullish bias as long as 116,400 holds.
Look for trend continuation toward 121k+ on breakout.
Monitor for reversal signals if price fails to reclaim/hold above WMA or EMA.
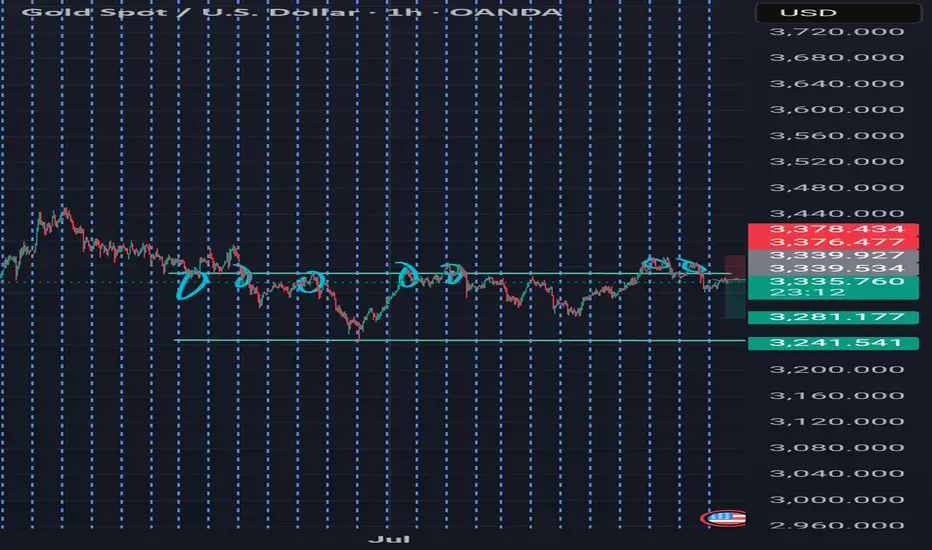
XAUUSD Short Based on a Fakeout + Rejection + Retrace Strategy💡 Strategy Flow
I'm seeing:
1. Fakeout – Price broke above resistance (3349–3350) and wicked into 3368–3372.
2. Rejection – Price quickly fell back below the resistance zone (classic bull trap).
3. Retrace to resistance – Price has now returned to the 3349–3350 zone, which is likely acting as new resistance again.
✅ Current price is sitting at the retrace area, after the initial rejection.
---
🔮 What should happen next?
According to this strategy, the next expected move is:
🔻 Rejection from resistance ➝ Bearish continuation
In detail:
> Price should fail to break resistance again.
> Sellers should step in around this level.
> If valid, price should drop, targeting:
🔹 Conservative TP: 3280
🔹 Aggressive TP: 3241.5
---
🎯 Entry Setup
Type Entry Stop Loss Take Profit Risk-Reward
Conservative 3349.0 3376.5 3280.0 ~1:1.6
Aggressive 3339.5 3378.5 3241.5 ~1:2.5
📍 Entry can be confirmed with bearish rejection candle on the resistance retest.
📈 Targeting previous swing low and major support zone around 3246–3247.
---
Symbol:
$BYBIT:XAUTSDT.P OANDA:XAUUSD
---
🧠 Strategy Logic:
This is a Smart Money-style trap play, where liquidity is swept above a well-known resistance, then price rejects and retraces back for a high-probability entry.
This fakeout–retest–drop sequence is deadly when aligned with market structure and zones like this.
---
🏷️ Hashtags:
#XAUTUSDT #XAUUSD #SmartMoney #LiquidityGrab #PriceAction #Fakeout #Retest #BearishSetup #BreakAndRetest #TradingView #SMC #TechnicalAnalysis #Forex #Crypto #StopHunt
---
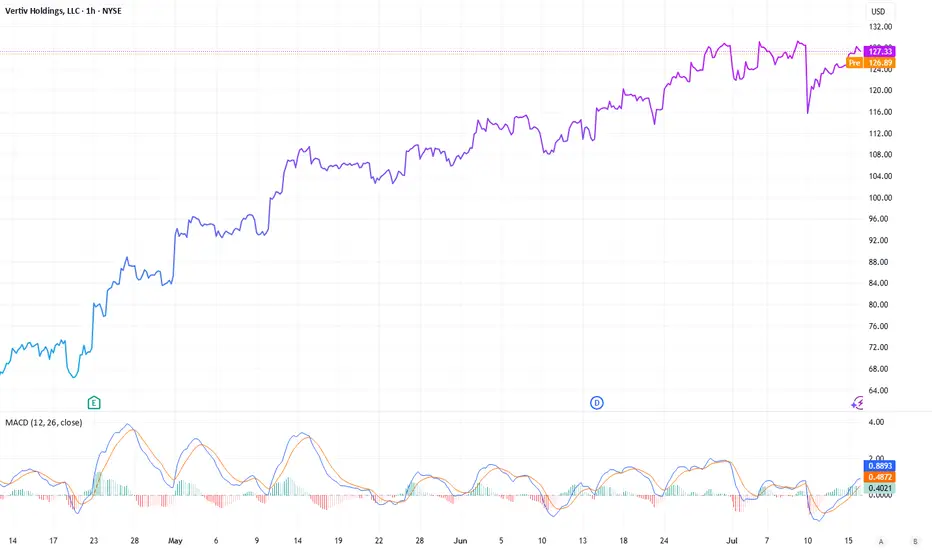
Vertiv Holdings: Powering the AI ProgressionNYSE:VRT NASDAQ:NVDA NASDAQ:META NYSE:ETN NASDAQ:CEG
While investors are engaged in a race “identify the next major microchip manufacturer”, a quieter opportunity is emerging at the crossroads of artificial intelligence (AI), infrastructure, and long-term demand. Vertiv Holdings (VRT), a company often overlooked amidst the hype, could be the backbone of the AI boom. In a recent NVIDIA earnings call, CEO Jensen Huang dropped a pretty interesting statement: the biggest hurdle for future data centers isn’t chips or regulations- it’s power.
The Power and Cooling Conundrum
AI is no longer some futuristic bet, it’s more like the engine of modern enterprise. Data centers, once powered by modest CPUs, now rely on NVIDIA’s superior GPUs to handle complex, multi-task workloads at scale. But this shift has exposed a critical bottleneck: energy supply can’t keep up with compute demand. Think of NVIDIA’s GPUs as high-performance supercars-powerful yet fuel-hungry, requiring premium infrastructure to operate efficiently. Data centers face challenges like high carbon footprints, downtime risks (recall the $10 billion CrowdStrike outage from a faulty software update), and intense cooling needs due to soaring rack densities.
And this is where Vertiv (VRT) comes in. This company designs and delivers essential infrastructure-uninterruptible power supplies, power distribution units, and advanced cooling solutions (both air and liquid-based)-tailored for data centers, telecom, and industrial clients. If NVIDIA’s GPUs are the brain, Vertiv is the heart and lungs, ensuring these systems run without melting down. The cooling challenge, in particular, is a game-changer. With rack densities exceeding 300kW, traditional air cooling falls short, making Vertiv’s liquid cooling innovations a must-have.
A Strategic Edge: The META-Nuclear Play
The AI race isn’t just about chips- it’s also about the infrastructure to sustain them. A telling sign came from META, which recently inked a nuclear power deal with Constellation Energy. Why nuclear? It offers low-carbon, reliable, 24/7 power with massive capacity-ideal for AI’s energy demands. Yet, Constellation’s deal didn’t address cooling, a gap Vertiv fills perfectly. This collaboration points a broader trend: companies are scrambling to solve power and thermal management issues, and Vertiv is at the forefront of this effort.
Financial Momentum and Analyst Backing
Vertiv’s financials back up its strategic importance. In Q1 2025, the company reported $2.04 billion in revenue-a 25% year-over-year jump, surpassing the $1.94 billion estimate. Adjusted earnings per share hit $0.64, beating the $0.615 forecast. Its backlog soared 50% to $6 billion, signaling robust future demand, while free cash flow margins doubled to 13% ($1.48 billion). Earnings before interest, taxes, depreciation, and amortization grew 22.8%, with a manageable 1.6x leverage ratio and over $350 million annually invested in R&D-much of it for cutting-edge liquid cooling.
Looking ahead, analysts project revenue of $10.76 billion by 2026, with EPS growth of 22% annually and free cash flow reaching $1.6 billion, even as capital expenditure rises to 18.2%. The sentiment is overwhelmingly bullish: Bank of America, Goldman Sachs, and Barclays maintain "Buy" ratings, with target prices ranging from $115 to $130. Oppenheimer, a top analyst, recently raised its target to $132, while 75% of analysts recommend buying, with only 6.3% suggesting a hold or sell.
Outpacing the Market
Since its liberation date of April 2, Vertiv has outperformed its peers. While the S&P 500 grew 11.48%, NVIDIA rose 45.62%, Eaton Corporation 30.26%, and Constellation Energy 48.3%, Vertiv surged 69.8%. Its focus on data centers and AI-driven infrastructure is reflected in this outperformance, with even uranium ETFs (42.41%) tied to nuclear power trends being outpaced. Vertiv’s faster free cash flow growth and direct exposure to AI’s power and cooling bottlenecks give it an edge over cyclical chipmakers.
A Long-Term Buy?
The thesis is simple: AI is already here and it will stay, and the infrastructure supporting it-especially cooling- is important factor in ensuring the rotation of the gears. Vertiv is quietly becoming, lets say, the NVIDIA of infrastructure, leveraging strong financials, analyst confidence, and a critical role in solving AI’s energy crisis. At a current price of $127.37, with targets up to $132 within the next 18 months (and potentially higher over 2-3 years), VRT could be a pretty confident long-term buy. Unlike chipmakers facing valuation risks, Vertiv may offer stable growth tied to an urgent need, which one is growing today.
Disclosure: I currently hold no positions in VRT, NVIDIA, Eaton, or Constellation Energy.