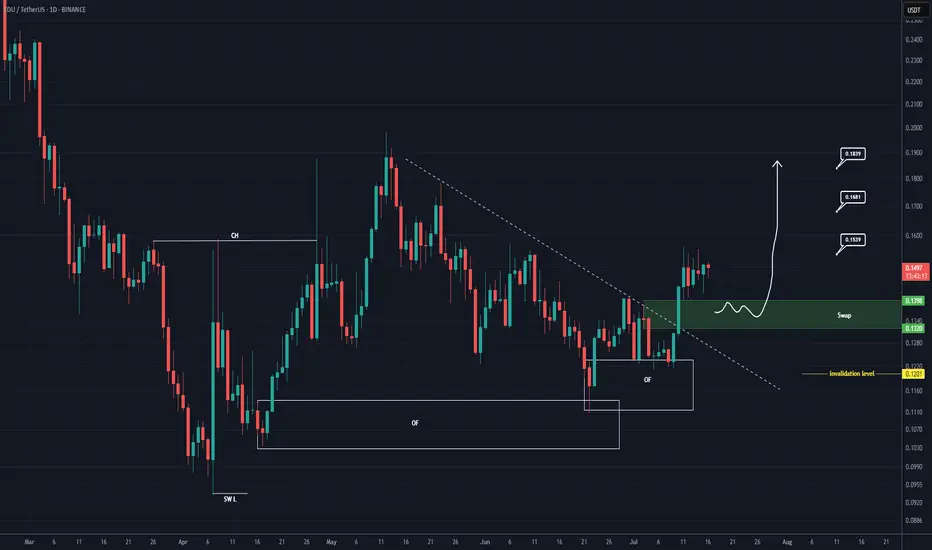
EDU Buy/Long Setup (1D)After forming a swing low, the price has created a bullish Change of Character (CH), and it has flowed well from the origin order blocks.
The trigger line has been broken, and the price has formed a SWAP zone.
Given the bullish signs on the chart, we can consider entering a buy position within the SWAP zone.
The targets are marked on the chart.
A daily candle closing below the invalidation level will invalidate this analysis.
For risk management, please don't forget stop loss and capital management
When we reach the first target, save some profit and then change the stop to entry
Comment if you have any questions
Thank You
Supply and Demand
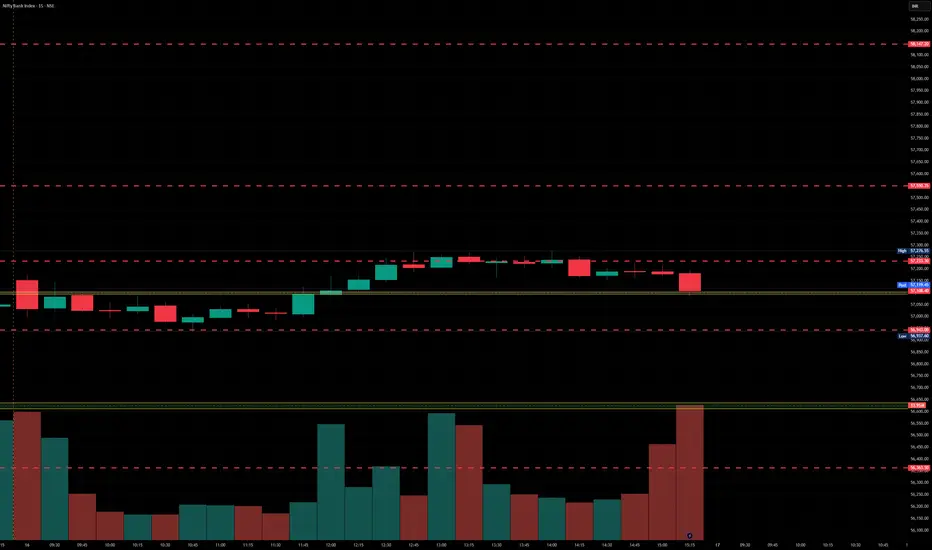
BankNifty levels - Jul 17, 2025Utilizing the support and resistance levels of BankNifty, along with the 5-minute timeframe candlesticks and VWAP, can enhance the precision of trade entries and exits on or near these levels. It is crucial to recognize that these levels are not static, and they undergo alterations as market dynamics evolve.
The dashed lines on the chart indicate the reaction levels, serving as additional points of significance. Furthermore, take note of the response at the levels of the High, Low, and Close values from the day prior.
We trust that this information proves valuable to you.
* If you found the idea appealing, kindly tap the Boost icon located below the chart. We encourage you to share your thoughts and comments regarding it.
Wishing you successful trading endeavors!
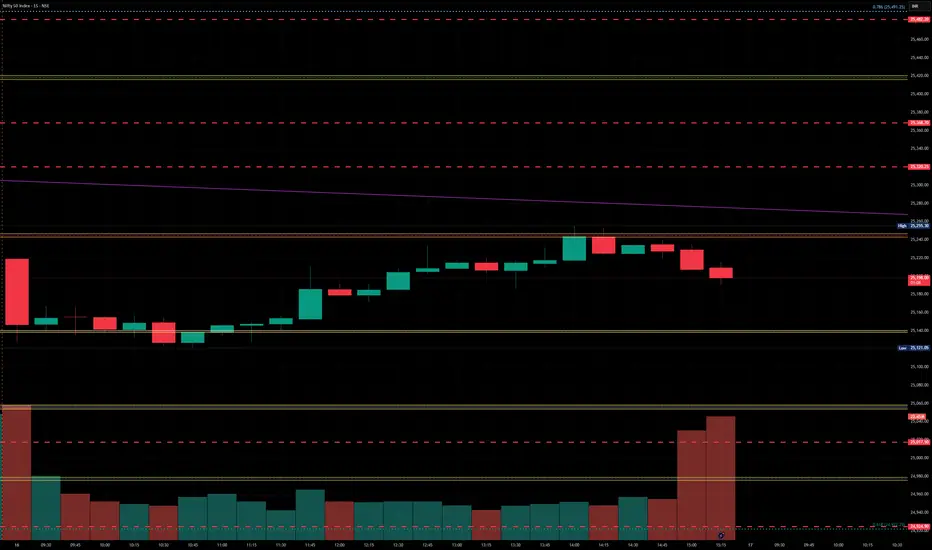
Nifty levels - Jul 17, 2025Nifty support and resistance levels are valuable tools for making informed trading decisions, specifically when combined with the analysis of 5-minute timeframe candlesticks and VWAP. By closely monitoring these levels and observing the price movements within this timeframe, traders can enhance the accuracy of their entry and exit points. It is important to bear in mind that support and resistance levels are not fixed, and they can change over time as market conditions evolve.
The dashed lines on the chart indicate the reaction levels, serving as additional points of significance to consider. Furthermore, take note of the response at the levels of the High, Low, and Close values from the day prior.
We hope you find this information beneficial in your trading endeavors.
* If you found the idea appealing, kindly tap the Boost icon located below the chart. We encourage you to share your thoughts and comments regarding it.
Wishing you success in your trading activities!
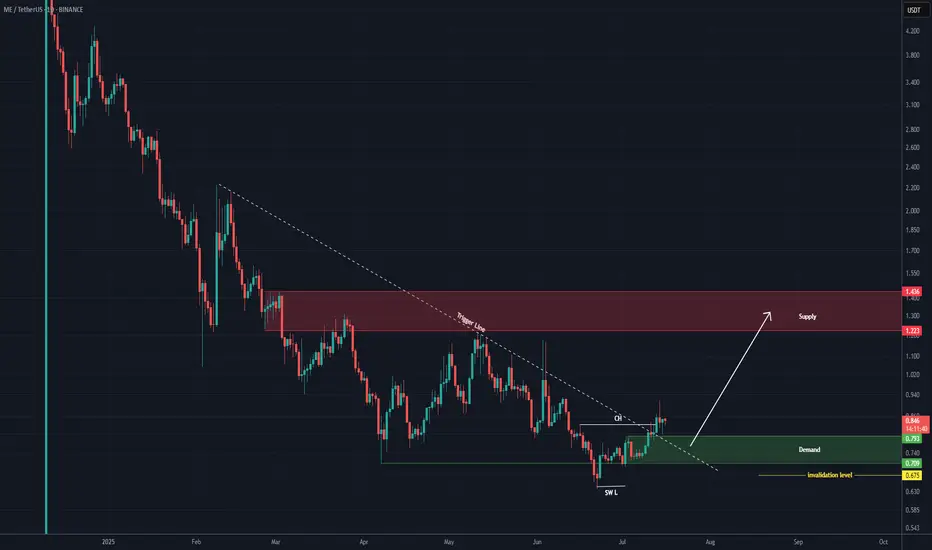
ME Analysis (1D)After holding above the support zone, we have a bullish Change of Character (CH) on the chart, which is a bullish sign. Additionally, the trigger line has been broken.
After a slight pullback, the price may move toward the targets.
The targets are marked on the chart.
A daily candle closing below the invalidation level will invalidate this analysis.
For risk management, please don't forget stop loss and capital management
When we reach the first target, save some profit and then change the stop to entry
Comment if you have any questions
Thank You
BTC/USD 4H Technical & Fundamental AnalysisBTC/USD 4H Technical & Fundamental Analysis
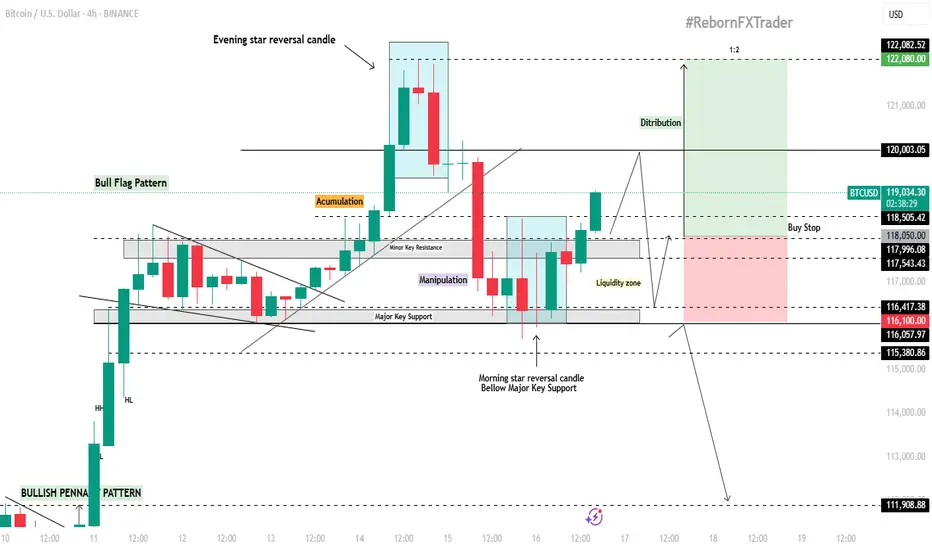
Bitcoin remains fundamentally bullish as institutional adoption continues to rise through Spot ETF inflows, while post-halving supply pressure tightens the available BTC in circulation. Additionally, the upcoming regulatory clarity such as the GENIUS Act could pave the way for major institutions like JPMorgan to issue their own stablecoins, further bridging the gap between crypto and traditional finance. On the technical side, BTC is currently consolidating around the 116,200 level, potentially forming a bull flag pattern on the 4H timeframe. This zone has acted as a major support level due to multiple historical touches.
Previously, price reached an all-time high around 122,000 before forming an Evening Star reversal pattern, leading to a pullback back to the 116,200 zone. A Morning Star reversal then formed on this key support, suggesting renewed bullish momentum.
Our current objective is to wait for price to climb toward the 120,000 level, where we anticipate a potential liquidity grab within the highlighted liquidity zone.
📍Buy Stop Setup:
Buy Stop Entry (AOI): Around 118,050
Stop Loss: 116,100 (below liquidity zone)
Take Profit: 122,080
📌 Disclaimer:
This is not financial advice. Always wait for proper confirmation before executing trades. Manage risk wisely and trade what you see—not what you feel.
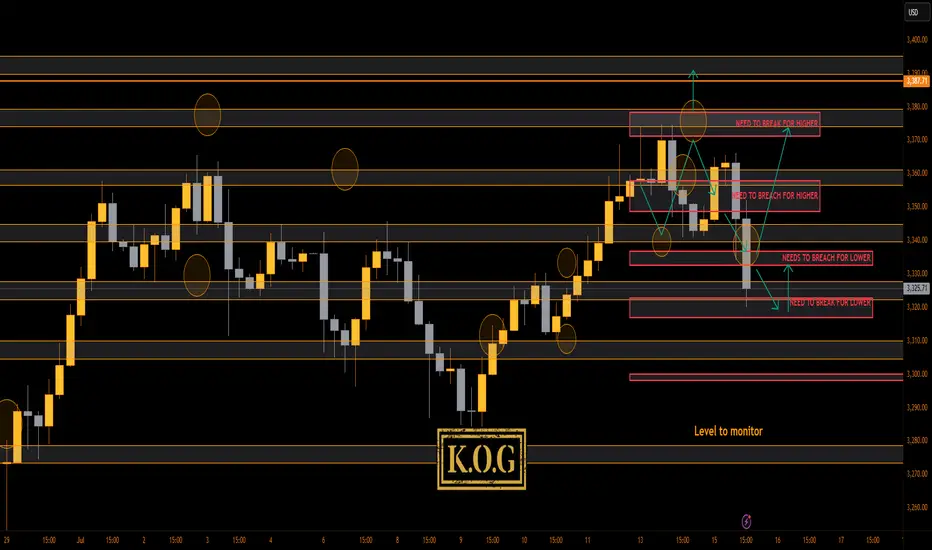
THE KOG REPORT - UpdateEnd of day update from us here at KOG:
Madness on the markets. I can honestly say, if you're less experienced in these markets, and like some of you trading with large lots and large or no SL's, you're unfortunately going to get yourself into a little bit of a pickle.
Did it go to plan today? Yes, and no! We followed the path which worked, but then we wanted support to hold at the bias level 3340 to then push us back upside. We got a small bounce for 100pips on the red box indicators but ideally we wanted this to completed the move up before coming back down. We're now at crucial support 3320 with resistance at the 3335-40 region, which, if we hold here without breaching should be a decent retracement on this move.
Other than that, I can say our plan for today wasn't as we hoped, we took an SL but then got a 100pip bounce. It is what it is
RED BOXES:
Break above 3365 for 3372, 3375, 3388 and 3406 in extension of the move
Break below 3350 for 3335✅, 3330✅, 3326✅ and 3307 in extension of the move
As always, trade safe.
KOG
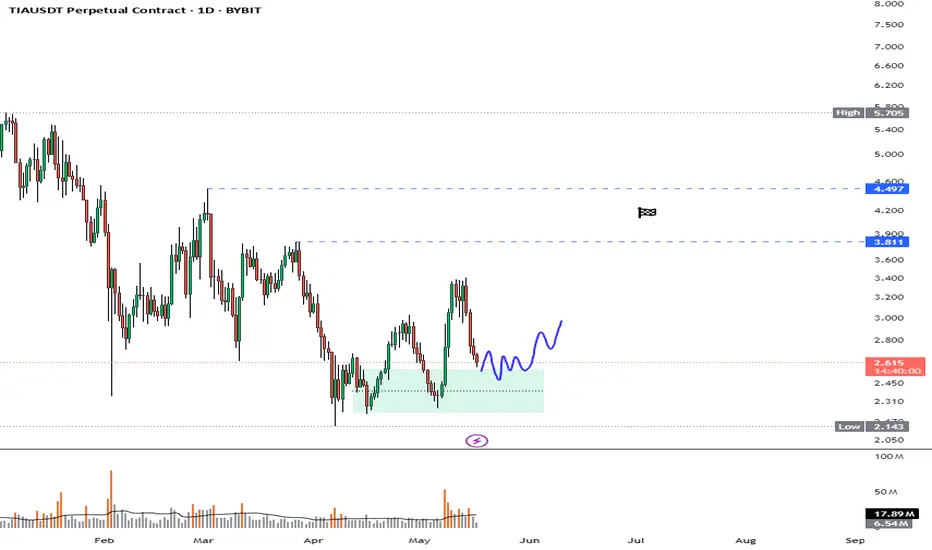
TIA Double Bottomed, $4.5 PossibleBYBIT:TIAUSDT.P bottomed out at the $2.3 level. From there, its initial rally took it to the $3.4 level. If a bottom formation occurs again at its current level, another rally could push it first to the $3.8 level, and if the rally is strong, potentially up to $4.5. Strength into higher levels are critical.
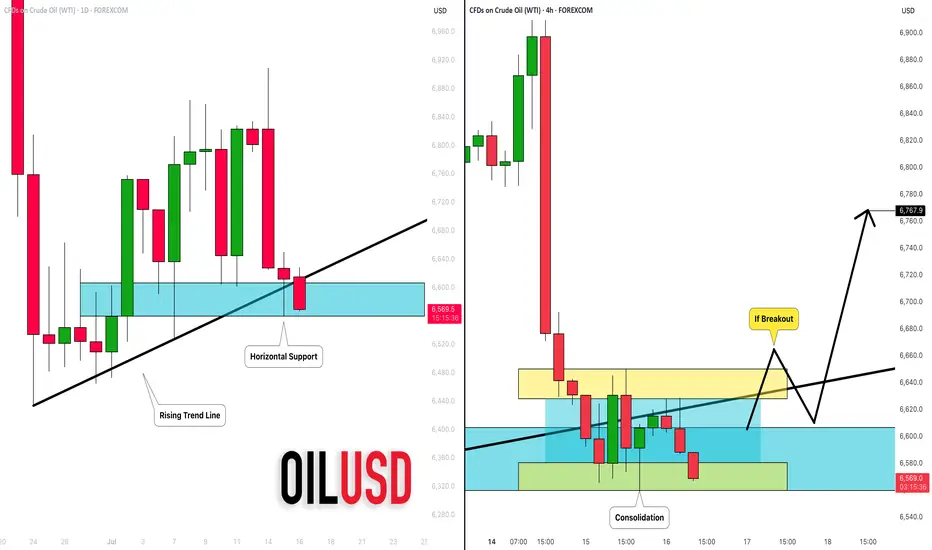
CRUDE OIL (WTI): Your Trading Plan Explained
Do not forget that today we expect Crude Oil Inventories data
release - it will be 10:30 am NY time.
Ahead of this news, the market is testing a significant daily support cluster
that is based on a rising trend line and a horizontal structure.
You signal to buy will be a bullish breakout of a minor intraday
horizontal resistance on a 4H.
4H candle close above 66,5 will be your confirmation.
A bullish continuation will be expected to 67.6 then.
I suggest waiting for the news release first and then check how
the market prices in the news. If our technicals align with fundamentals,
it will provide an accurate setup.
Alternatively, a bearish violation of a blue support will push the prices lower.
❤️Please, support my work with like, thank you!❤️
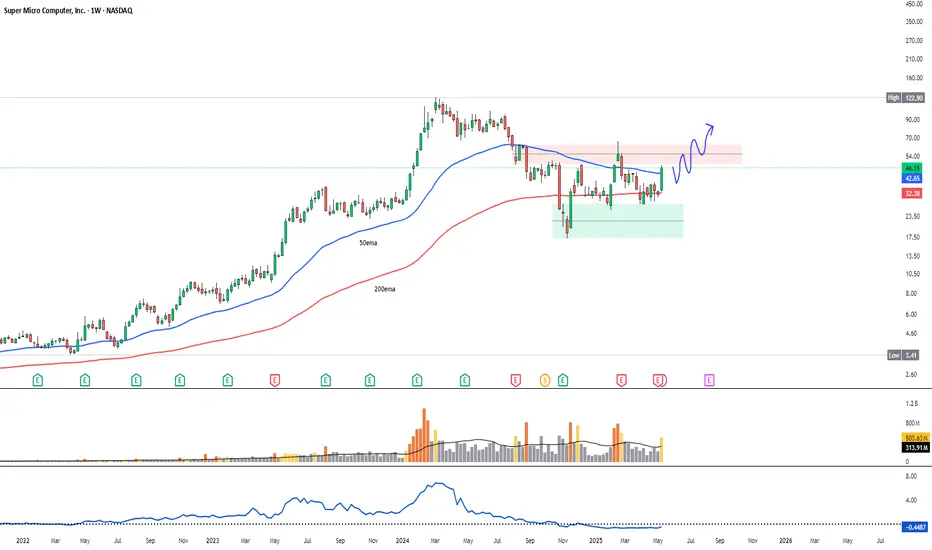
SMCI going to breakout soon, targeting $200NASDAQ:SMCI hasfound support at $28, it is currently trading around the $46 level. It is attempting to test the $50-$61 range for the third time and will likely turn this level into support with a breakout.
$200 could be a good psychological target. The relative strength against the SP:SPX is about to turn positive in favor of the stock, and I expect volume to increase in the coming days.
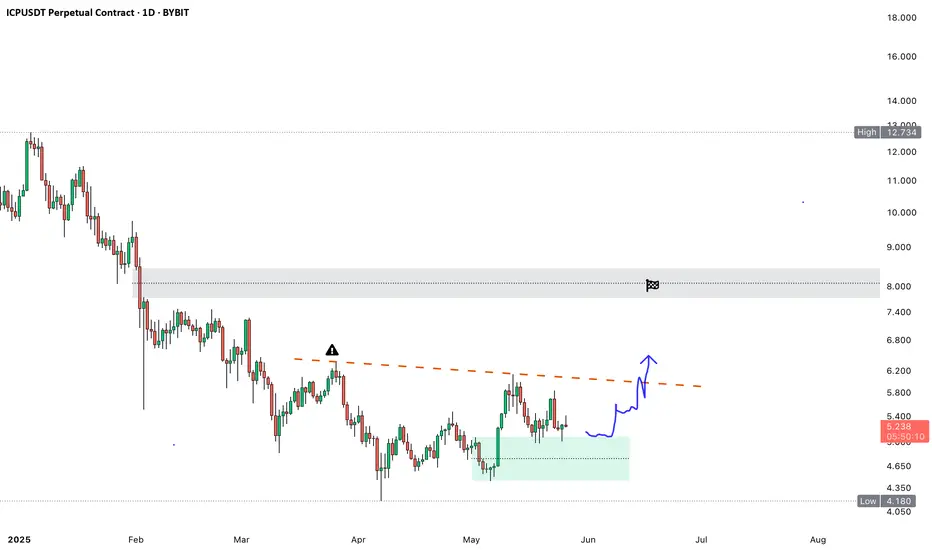
ICP to mark up for a higher highBYBIT:ICPUSDT.P looks like accumulating around $5 and can hit $8 in the coming days. There needs to be an increasing momentum soon.
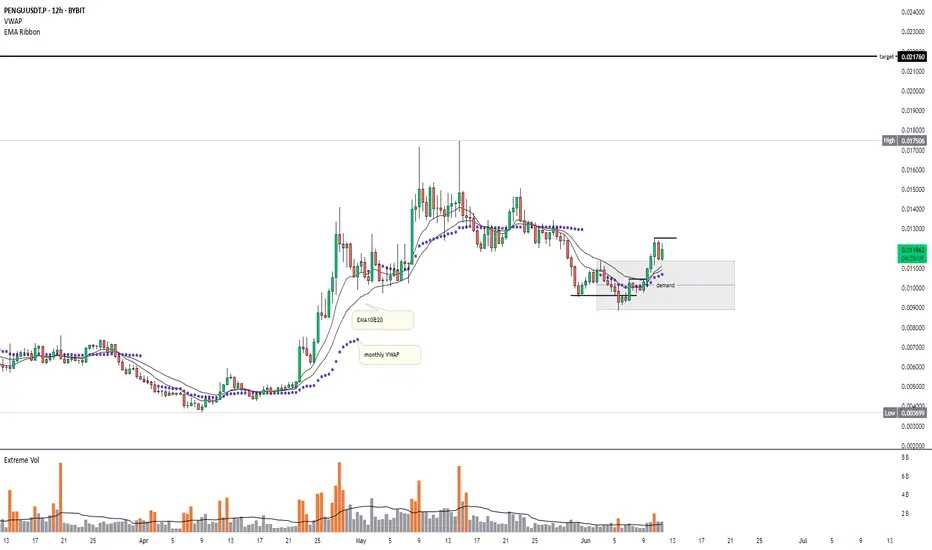
Pengu to Propel Upside to $0.02BYBIT:PENGUUSDT.P
A demand block has formed around $0.01.
Price is now attempting to push above this level.
There may be some pullbacks into the block, but I still expect the uptrend to continue.
The next price target is $0.02.
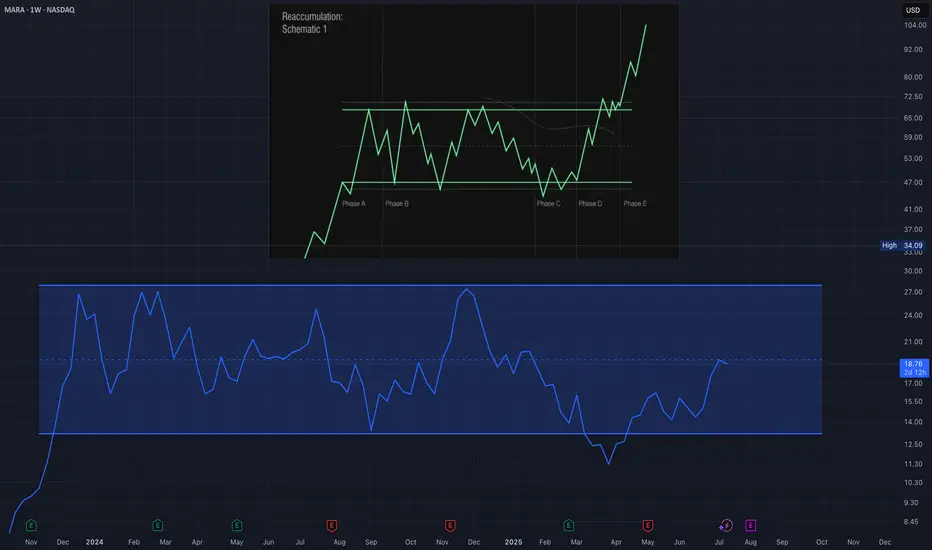
MARA Showing Classic Wyckoff Reaccumulation SetupI’m currently observing what appears to be a Wyckoff Reaccumulation Schematic developing in MARA (Marathon Digital Holdings). After a significant decline, the price seems to have found a floor with a clear Selling Climax (SC), followed by an Automatic Rally (AR) that established the upper boundary of the trading range. The price action since then has remained largely within this range, showing multiple Secondary Tests (ST) that confirm both support and resistance levels. The structure and volume behavior suggest that MARA is likely in Phase C of the Wyckoff reaccumulation process, where we typically anticipate a spring or shakeout to test supply before the next leg higher. If the schematic continues to unfold according to the Wyckoff method, we could see signs of Phase D soon, which would involve a successful test of the spring and a rally back toward resistance with increasing demand. This would set the stage for a potential breakout, marking the beginning of Phase E. I’m closely watching price behavior near the lower range, along with volume confirmation, to validate this scenario. While the structure is still developing, the current formation is consistent with historical reaccumulation patterns seen prior to bullish continuations.
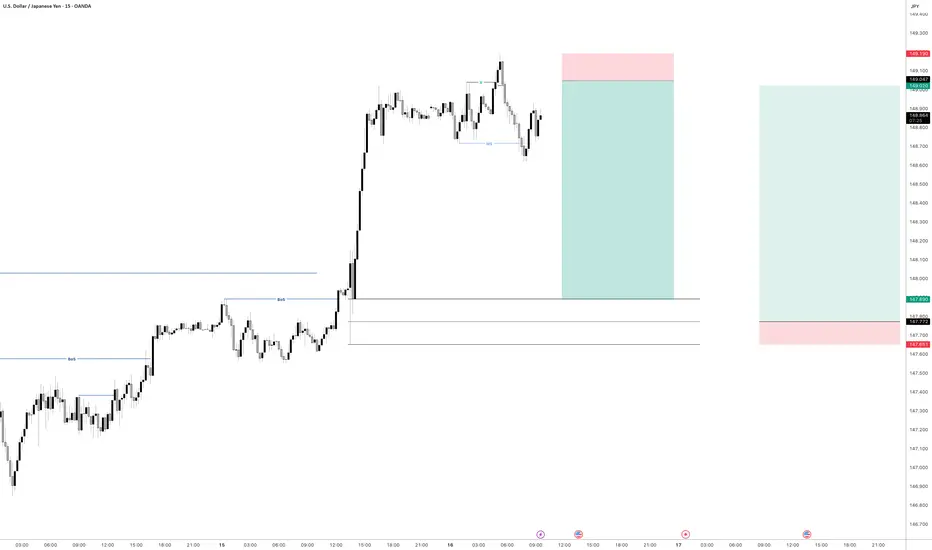
USDJPY - Time to sell short term i believeHave a pending order waiting to be triggered on UJ
Will see how we go if we get tagged in
XAU/USD 16 July 2025 Intraday AnalysisH4 Analysis:
-> Swing: Bullish.
-> Internal: Bullish.
You will note that price has targeted weak internal high on two separate occasions forming a double top which is a bearish reversal pattern. This is in-line with HTF bearish pullback phase.
Remainder of analysis and bias remains the same as analysis dated 23 April 2025.
Price has now printed a bearish CHoCH according to my analysis yesterday.
Price is now trading within an established internal range.
Intraday Expectation:
Price to trade down to either discount of internal 50% EQ, or H4 demand zone before targeting weak internal high priced at 3,500.200.
Note:
The Federal Reserve’s sustained dovish stance, coupled with ongoing geopolitical uncertainties, is likely to prolong heightened volatility in the gold market. Given this elevated risk environment, traders should exercise caution and recalibrate risk management strategies to navigate potential price fluctuations effectively.
Additionally, gold pricing remains sensitive to broader macroeconomic developments, including policy decisions under President Trump. Shifts in geopolitical strategy and economic directives could further amplify uncertainty, contributing to market repricing dynamics.
H4 Chart:
M15 Analysis:
-> Swing: Bullish.
-> Internal: Bullish.
H4 Timeframe - Price has failed to target weak internal high, therefore, it would not be unrealistic if price printed a bearish iBOS.
The remainder of my analysis shall remain the same as analysis dated 13 June 2025, apart from target price.
As per my analysis dated 22 May 2025 whereby I mentioned price can be seen to be reacting at discount of 50% EQ on H4 timeframe, therefore, it is a viable alternative that price could potentially print a bullish iBOS on M15 timeframe despite internal structure being bearish.
Price has printed a bullish iBOS followed by a bearish CHoCH, which indicates, but does not confirm, bearish pullback phase initiation. I will however continue to monitor, with respect to depth of pullback.
Intraday Expectation:
Price to continue bearish, react at either M15 supply zone, or discount of 50% internal EQ before targeting weak internal high priced at 3,451.375.
Note:
Gold remains highly volatile amid the Federal Reserve's continued dovish stance, persistent and escalating geopolitical uncertainties. Traders should implement robust risk management strategies and remain vigilant, as price swings may become more pronounced in this elevated volatility environment.
Additionally, President Trump’s recent tariff announcements are expected to further amplify market turbulence, potentially triggering sharp price fluctuations and whipsaws.
M15 Chart:

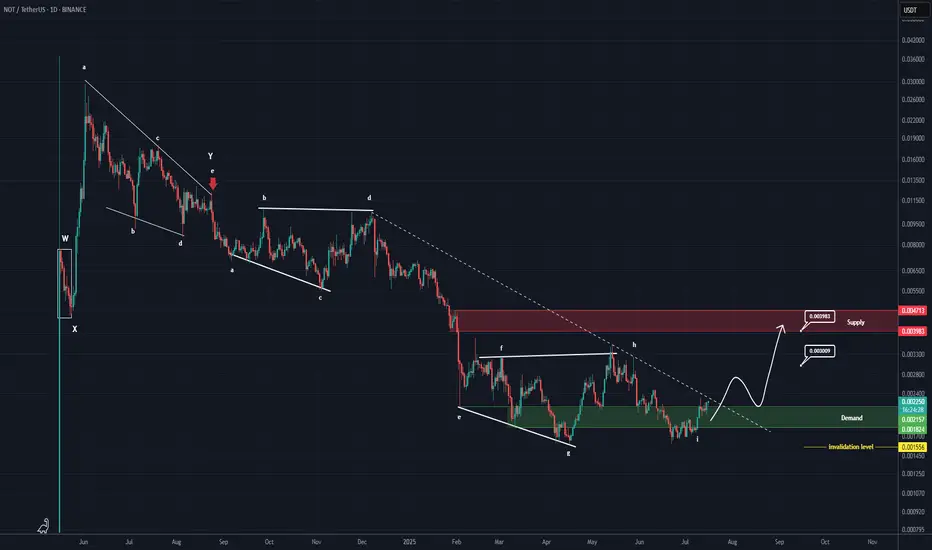
NOTCOIN New Update (1D)From the point where the red arrow is placed on the chart, the correction labeled as NOT has started.
The correction appears to be a symmetrical one, which now seems to be coming to an end. The current upward wave could be the X wave.
In previous analyses, we had also considered the structure to be symmetrical, but on a larger degree. However, based on the data currently available, it seems that the degree of this symmetrical structure is smaller.
If the price holds above the green zone, it may move toward the targets and the red box. The targets are marked on the chart.
A daily candle closing below the invalidation level will invalidate this analysis.
For risk management, please don't forget stop loss and capital management
When we reach the first target, save some profit and then change the stop to entry
Comment if you have any questions
Thank You
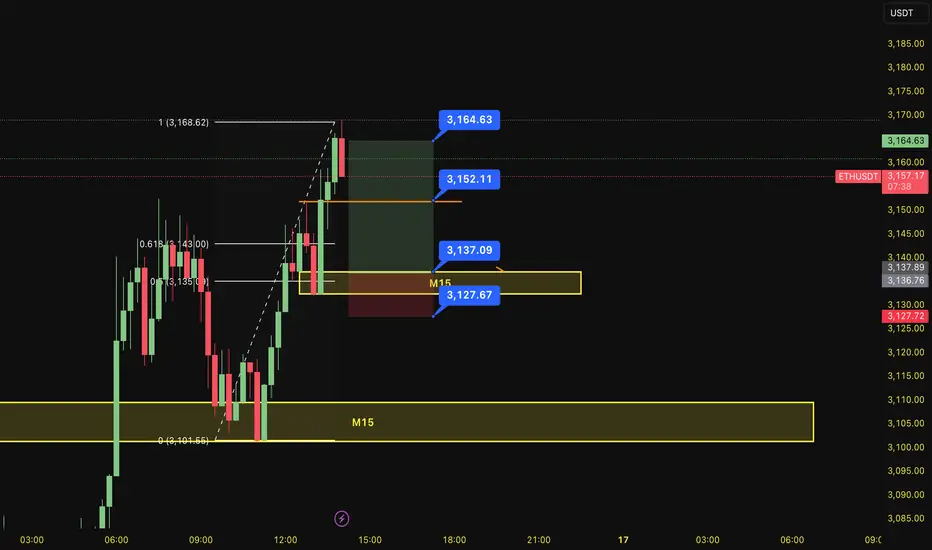
BUY ETHUSDT 16.7.2025Confluence order: BUY at M15
Type of order: Limit order
Reason:
- M15~FIBO 0,5-0,618 (same position)
Note:
- Management of money carefully at the price of sub key M15 (3152)
Set up entry:
- Entry buy at 3137
- SL at 3127
- TP1: 3152
- TP2: 3164
Trading Method: Price action (No indicator, only trend and candles)
Gold 16.07.25Over the last 2 weeks there was this redistribution model forming, where i yesterday found an entry. The Initial distribution i was looking for in may never hit it's target, so i might be able to ride this trade all the way down. The time displacement on the last tap wasn't the best, so there might be another move into the POI's, where i then have to reenter. It would suck a little bit though, atm it's an 39 R/R.

BUY XAUUSD 16.7.2025Trend Resumption at H1: BUY at M15
Type of order: Limit order
Reason:
- The price brokeout the sub key of M15, confirming the uptrend into main key M15.
Note:
- Management of money carefully at the price of sub key M15 (3335)
Set up entry:
- Entry buy at 3325
- SL at 3319
- TP1: 3335
- TP2: 3347
Trading Method: Price action (No indicator, only trend and candles)

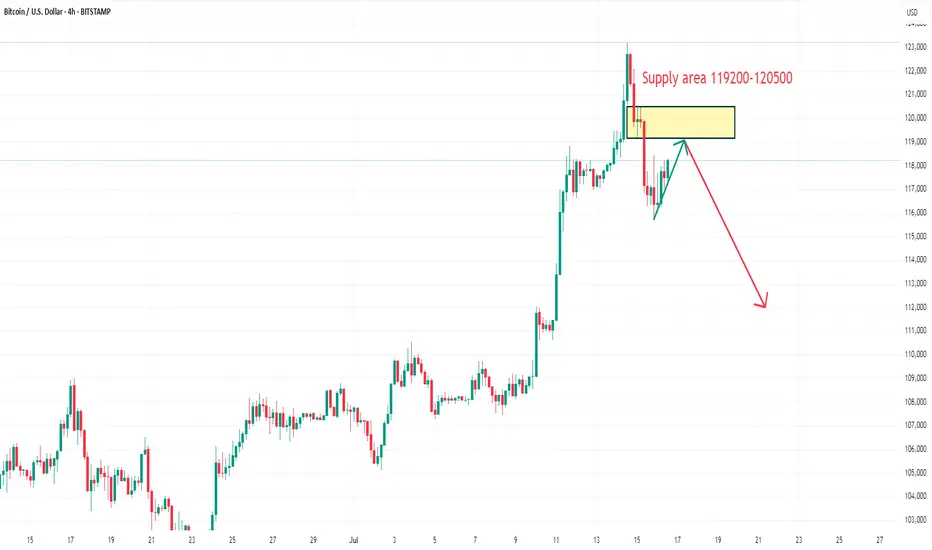
BTCUSD focuses on shorting in the supply zoneOn the 4-hour chart, BTCUSD has fallen from its historical high. Currently, we can focus on the supply zone of 119200-120500. If the rebound is blocked, we can consider shorting. The downside target is around 112000.
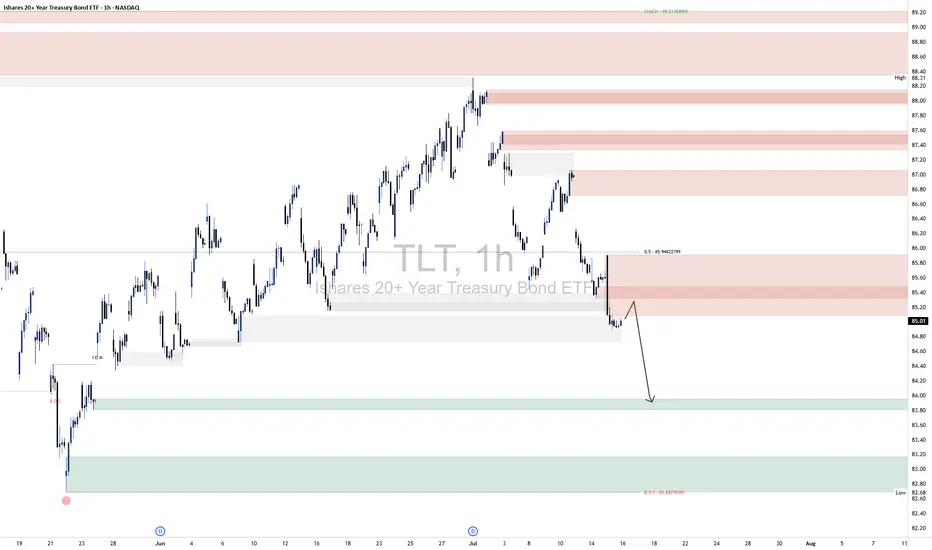
TLT ShortTLT 1H Technical Analysis
📈 Outlook:
The current setup suggests a bearish continuation scenario:
A corrective move toward the 85.20–85.60 supply.
Rejection from this area confirms continuation of the downtrend.
Target: 83.20–83.60, where resting liquidity and untested demand reside.
This sequence follows a classic liquidity sweep + supply mitigation + continuation pattern. Unless price breaks convincingly above 85.80, the bearish outlook remains intact.
🔼 Supply Zones (Bearish Liquidity Layers):
Primary Zone: 85.20–85.60
This is the most immediate area of interest, aligning closely with the 50% equilibrium level of the last bearish impulse (~85.84). Price is likely to reject from here as it also coincides with a previously unmitigated supply block and market inefficiency.
Stacked Supply Above: 86.40–88.00
Should price break the lower supply, these zones will come into play. However, the current structure suggests strong probability of rejection before reaching these levels.
🔽 Demand Zones (Target Areas):
First Demand: 83.20–83.60
This is your marked initial downside target. It represents the next logical draw on liquidity and aligns with prior accumulation and support structure. It’s likely to act as a temporary reaction zone or the next entry point for accumulation.
Deeper Demand Zone: 82.40–82.80
Marked by your secondary border, this range offers higher time-frame confluence and could act as the final sweep zone if the 83s fail to hold.
XAUUSD 1HXAUUSD 1H Technical Analysis
📈 Expected Scenario:
Your projection implies the following:
Short-term pullback into the 3,305–3,315 demand zone.
A bullish reversal from this level, supported by price structure and prior demand imbalance.
Upside targets: First at 3,365 (minor supply), then extension toward 3,385–3,400.
This view is technically valid, as the market seems to be collecting liquidity below intermediate lows while maintaining structural integrity.
📌 Key Zones ("Your Borders"):
🔽 Demand Zone (Support)
Location: 3,305 to 3,315
Purpose: Your chart illustrates this as the primary reaccumulation zone. It aligns with a mid-structure demand zone and could serve as the launchpad for the next leg up, especially if paired with bullish order flow or volume confirmation.
Below this: A deeper, stronger demand lies around 3,285–3,295 (also marked by your 0.5 level at ≈3,286.14), which may act as a final liquidity grab zone before continuation.
🔼 Supply Zones (Resistance)
Lower Supply: 3,355–3,365
Upper Supply: 3,375–3,385
These zones represent potential profit-taking areas for any longs initiated at the demand. A breakout above 3,385 would suggest a continuation toward the 3,400–3,420 macro resistance.
