Supply and Demand
A temporary pause for silver!After its recent surge to reach the highest levels since September 2011, silver is showing short-to-medium-term negative signals on the 4-hour timeframe, before potentially resuming its upward trend on the daily chart.
As seen in the chart above, the price dropped quickly below the 38.37 level, forming a new low and shifting the 4-hour trend from bullish to bearish. The rebound to the 38.858 level appears to be a corrective move targeting the 38.1869 level.
The bearish scenario would be invalidated if the price rises again and forms a higher high on the 4-hour chart above the 39.119 level.

buy projectionBullish structure(high,low,irl).
Liquidity: sweep and inducement
Point of interest: orderblock
BankNifty levels - Jul 16, 2025Utilizing the support and resistance levels of BankNifty, along with the 5-minute timeframe candlesticks and VWAP, can enhance the precision of trade entries and exits on or near these levels. It is crucial to recognize that these levels are not static, and they undergo alterations as market dynamics evolve.
The dashed lines on the chart indicate the reaction levels, serving as additional points of significance. Furthermore, take note of the response at the levels of the High, Low, and Close values from the day prior.
We trust that this information proves valuable to you.
* If you found the idea appealing, kindly tap the Boost icon located below the chart. We encourage you to share your thoughts and comments regarding it.
Wishing you successful trading endeavors!

Nifty levels - Jul 16, 2025Nifty support and resistance levels are valuable tools for making informed trading decisions, specifically when combined with the analysis of 5-minute timeframe candlesticks and VWAP. By closely monitoring these levels and observing the price movements within this timeframe, traders can enhance the accuracy of their entry and exit points. It is important to bear in mind that support and resistance levels are not fixed, and they can change over time as market conditions evolve.
The dashed lines on the chart indicate the reaction levels, serving as additional points of significance to consider. Furthermore, take note of the response at the levels of the High, Low, and Close values from the day prior.
We hope you find this information beneficial in your trading endeavors.
* If you found the idea appealing, kindly tap the Boost icon located below the chart. We encourage you to share your thoughts and comments regarding it.
Wishing you success in your trading activities!

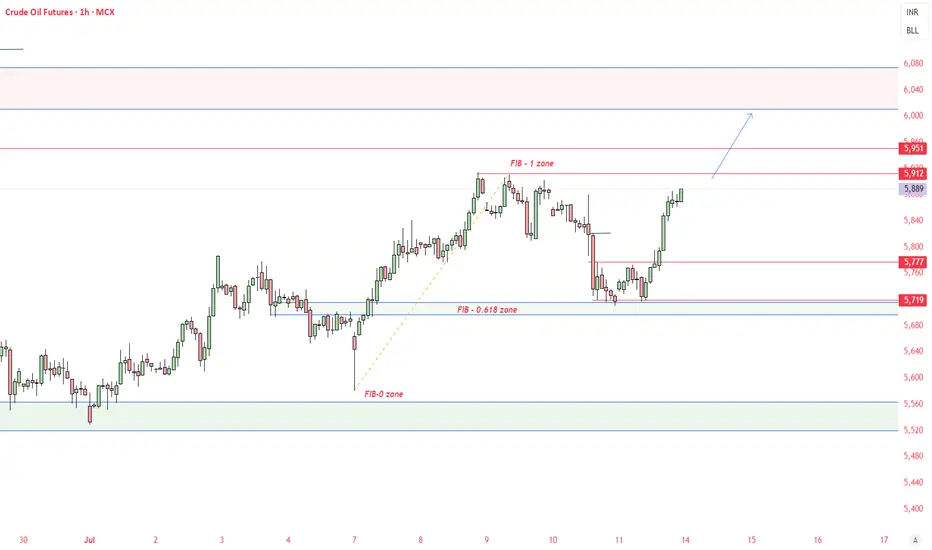
CRUDEOIL FUTURE - BULLISH VIEWCrudeoil just showed a reversal from 0.618 golden fibonnaci zone. It may go till 6000-6100 levels in coming weeks with 5700 as strong support.
please do your own research before taking any trades. This chart is only for educational purpose
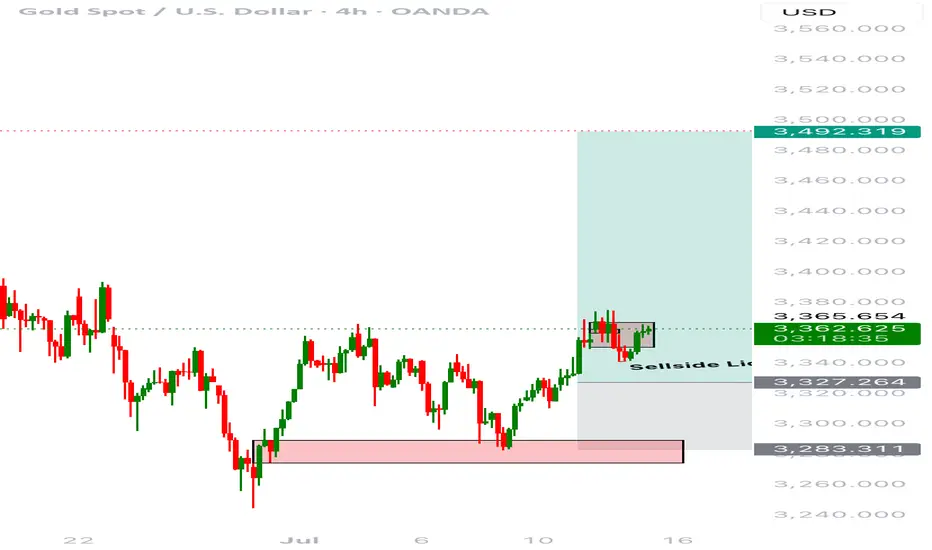
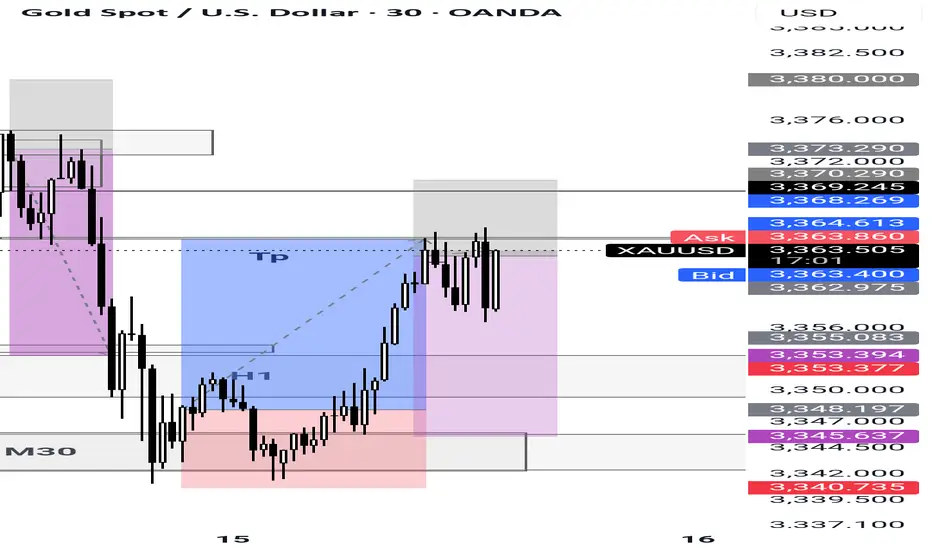
Buy XAUUSD?Date: July 15, 2025
Pair: XAUUSD (Gold Spot)
Timeframe: 4H
Direction: Long
Entry: ~3,360
Stop Loss: ~3,327 (below sell-side liquidity)
Take Profit: ~3,492
RR Ratio: ~1:4
⸻
🔍 Market Context
• Price had been trending downward and then consolidated for several sessions.
• A sell-side liquidity sweep occurred just below 3,327 — taking out stops beneath local lows.
• Strong bullish reaction followed, forming a clean bullish order block and reclaiming structure.
⸻
🎯 Trade Rationale
• Sell-side liquidity taken → market structure shift → bullish BOS (break of structure).
• Bullish order block formed with clear mitigation.
• Small black-box consolidation likely a retest zone for low-risk entry.
• Targeting inefficiency toward 3,492, with a clean range above.
⸻
🧠 Trade Management Plan
• Move stop to breakeven at 3,375 once price clears local resistance.
• Consider partial TP at 3,420–3,450 to lock profit.
• Trail remainder to higher lows or use fib-based trailing stop.
⸻
😐 Emotional State Before Trade
Calm and focused. Recognized a textbook SMC entry — no rush or FOMO.
⸻
✅ Post-Trade Reflection (To Fill Later)
• ❓ Did price react to the zone as expected?
• ❓ Was entry execution precise (limit vs market)?
• ❓ Any slippage or management improvements?
• ❓ Was I patient enough?
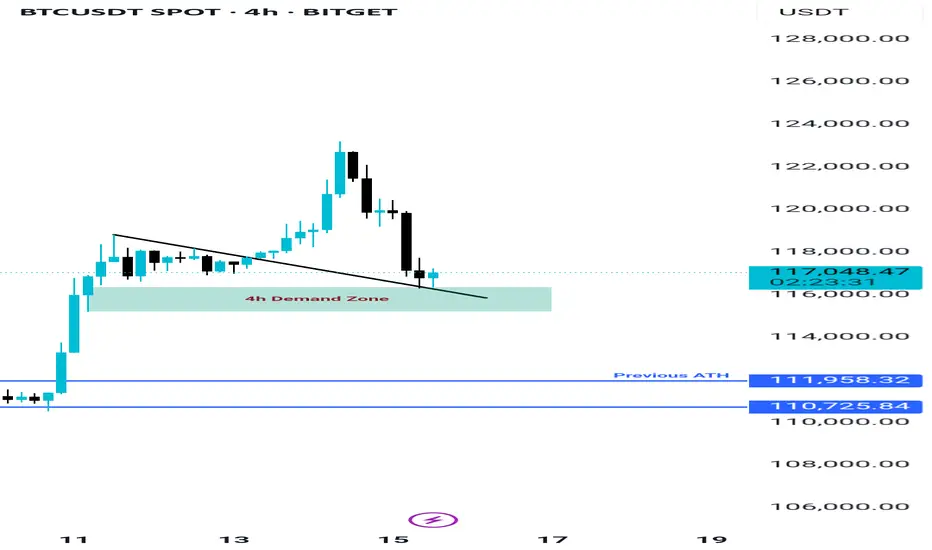
BTC still Holding the Demand Zone, Bitcoin is currently holding the demand zone between $116K and $117K, which also aligns with the retest area of a previously broken trendline—making this zone quite strong. If BTC manages to close above $117.8K on lower timeframes, we could see the beginning of a new uptrend targeting around $130K. However, if this zone fails due to any unexpected news or events, the next key support lies between $111K and $113K.
$HBAR Weekly Pivot Time...In classic CRYPTOCAP:HBAR fashion what a powerful move this week! Moves like this leave me skeptical of continuation straight away as you often get a pretty decent pullback afterwards before the next leg up. However how many times have you seen a move like this that completely unwinds weeks later and goes lower?
Wave (3) looks truly underway after wave (2) tested the High Volume Node and 'Golden Pocket' 0.50.618 Fibonacci retracement as support on weekly bullish divergence from the RSI.
The weekly pivot is now resistance and it already proving itself. If price continues the all time high is next resistance and price has a weekly R5 pivot target of $1.2 while the Fibonacci extension targets have a minimum of $5.2..
Analysis is invalidated below $0.12
Safe trading

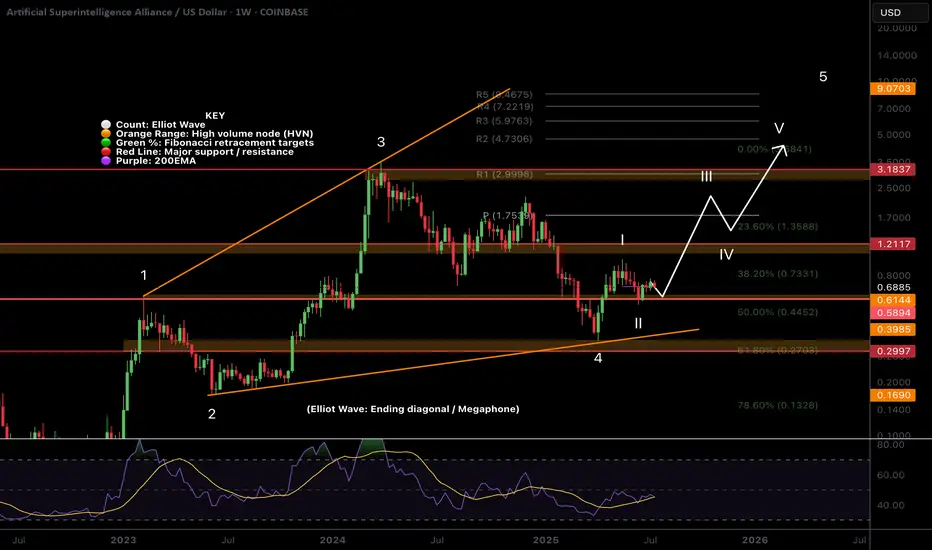
$FET Does Zooming out look better?NYSE:FET has been underperforming lately and the local chart looks trash so I wanted to zoom out to give us all some context on the larger picture which hasn't really changed.
Price appears to have completed wave II at the High Volume Node (HVN) support and 0.5- 0.618 'Golden Pocket' Fibonacci retracement and wave 3 is underway but finding local resistance.
Pivots are warped due to the strength of the move last year so wouldn't count them as reliable so focusing on support and resistance. The megaphone pattern is clear and the next area of resistance when FET starts moving is the $1.2
Weekly RSI is decreasing and is attempting to cross bearishly. If Bitcoin has a significant pullback I would expect new lows for FET at this rate. I have a neutral stance at this point.
Analysis is invalidated below $0.546
Safe trading
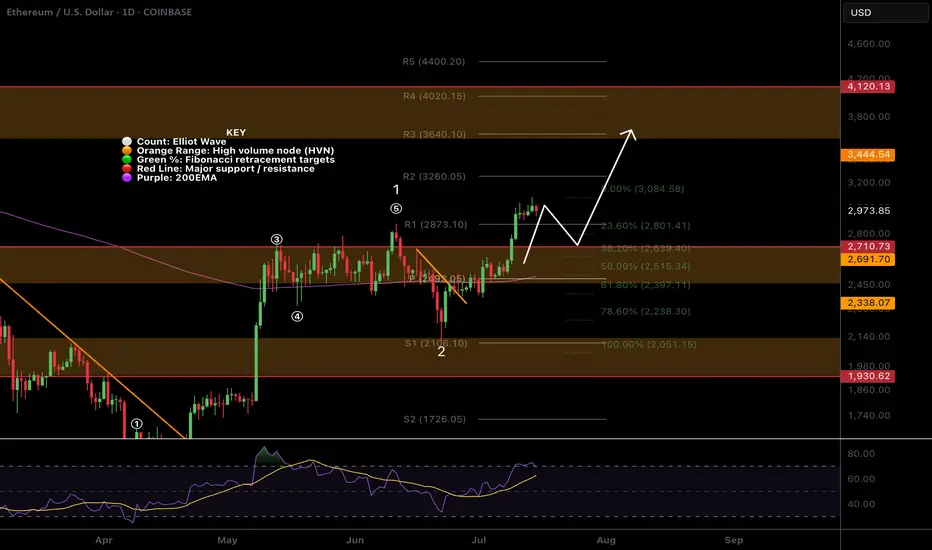
$ETH Pullback to $2630 Support?CRYPTOCAP:ETH has a great week pushing through resistance and making new local highs after testing the daily 200EMA and daily pivot as support.
Price is likely to retest the swing high and previous resistance as support around $2600-2700, also the .382 Fibonacci retracement.
RSI is printing daily bearish divergence in overbought from the wave (3) top to current as it did at the wave (5) top seeing large rejection. The retest of $2600 would reset RSI.
Price is ultimately set to test $3600 as the next resistance if the Elliot wave count is correct.
Analysis is invalidated below $2050
Safe trading
$CLSK Trapped between Critical Resistance and Support?NASDAQ:CLSK Shot through the weekly 200EMA and hit the weekly pivot resistance and was rejected into the High Volume Node (HVN) just below.
If the count is correct we should see price breakthrough in wave 3 after some consolidation and continue up after wave 2 tested the .618 Fibonacci retracement and HVN as support.
Heavy resistance HVN coupled with the R1 pivot at $20.40 will prove another challenge to overcome. Ultimately, if the count is correct AND Bitcoin doesn't tank we can expect a challenge of the all time highs up at $60.
I already closed partial take profit myself at the weekly pivot on a recent trade and will be looking to go long again to the those targets. Make sure to always be taking profits on the way as nobody has a Crystal ball!
RSI is currently printing a bearish divergence on the weekly so we need to see that negated.
Analysis is invalidated below $6.
Safe trading

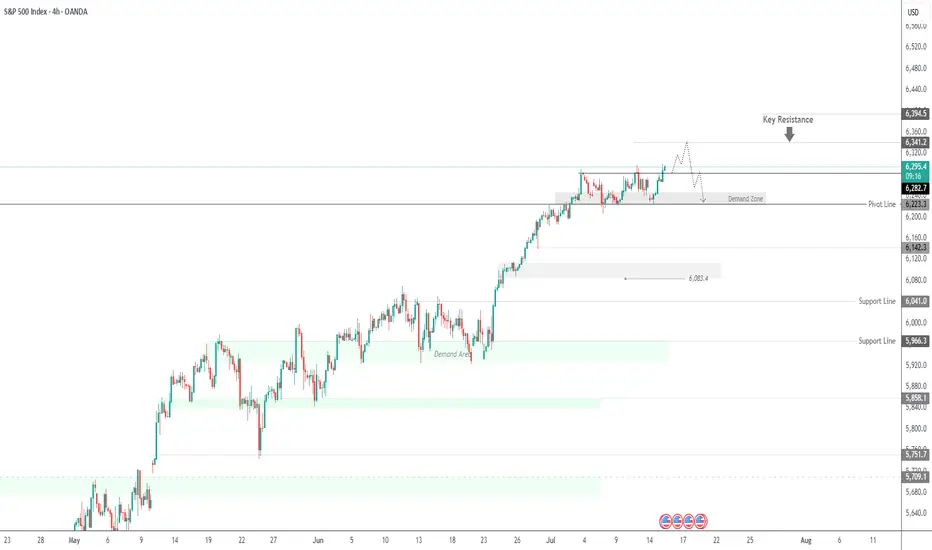
SPX500 Outlook – CPI Data in Focus, Key Pivot at 6282SPX500 – Market Outlook
U.S. futures are climbing as Nvidia plans to resume chip sales to China, fueling positive momentum across tech and growth sectors.
However, investor caution remains ahead of key events:
Major banks ( NYSE:JPM , NYSE:WFC Wells Fargo, NYSE:C Citigroup) will report earnings, offering insights into the financial sector.
All eyes are on the June CPI report, expected at 2.6%. A higher reading could reinforce bearish pressure, while a softer print would support continued bullish momentum.
Technical Outlook:
SPX500 has bounced from the demand zone and is now trading above the pivot at 6282, which keeps the bullish trend in play.
As long as the price holds above this level, we expect continuation toward 6341, and if broken, extended upside toward 6394.
To shift bearish, price must break and close below 6223, which would open the path toward 6142.
Pivot: 6282
Resistance: 6341 – 6394
Support: 6225 – 6191 – 6142
Event Watch : CPI data release today – anything above 2.6% may trigger downside; below 2.6% could support further upside.
Previous idea:
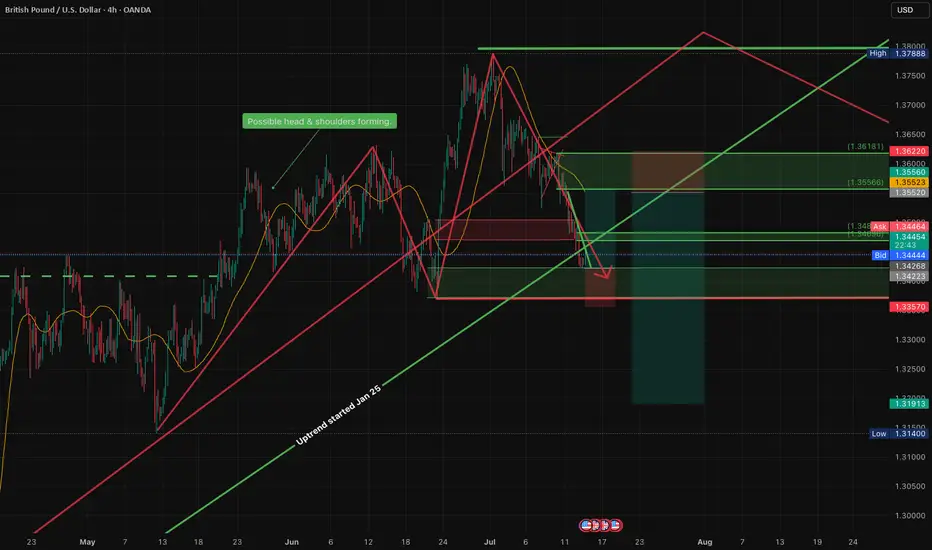
End of trend with Head & Shoulders forming. On the monthly chart the pair has been ranging between 1.2 and 1.43 since 2016 with resistance established 2018. Currently on up leg of third cycle. Ignoring the Liz Truss blip.
Daily chart uptrend established Jan 25 and should continue up to resistance. However possible head & shoulders forming, which would indicate change of character, at most recent cycle but a good trade up to right shoulder still possible and then it will change to down trend to trend line
4H - Price at good quality demand with 4 basing candles. Ready for reversal and long to potential right shoulder at 1.355 or higher all the way to multiyear resistance.
COT Non-com and retail are increasing positions and commercials are reducing. Valuation is cheap.
Plan: waiting for US CPI data and confirmation of direction change and then long with stop at 1.33570 and TP at 1.355 to right shoulder. (I like these as worst that can happen, after up move is confirmed, is H&S doesnt form and it continues to upside increasing R:R). Followed by good short.
Let me know what you think
XAU/USD 15 July Intraday AnalysisH4 Analysis:
-> Swing: Bullish.
-> Internal: Bullish.
You will note that price has targeted weak internal high on two separate occasions forming a double top which is a bearish reversal pattern. This is in-line with HTF bearish pullback phase.
Remainder of analysis and bias remains the same as analysis dated 23 April 2025.
Price has now printed a bearish CHoCH according to my analysis yesterday.
Price is now trading within an established internal range.
Intraday Expectation:
Price to trade down to either discount of internal 50% EQ, or H4 demand zone before targeting weak internal high priced at 3,500.200.
Note:
The Federal Reserve’s sustained dovish stance, coupled with ongoing geopolitical uncertainties, is likely to prolong heightened volatility in the gold market. Given this elevated risk environment, traders should exercise caution and recalibrate risk management strategies to navigate potential price fluctuations effectively.
Additionally, gold pricing remains sensitive to broader macroeconomic developments, including policy decisions under President Trump. Shifts in geopolitical strategy and economic directives could further amplify uncertainty, contributing to market repricing dynamics.
H4 Chart:
M15 Analysis:
-> Swing: Bullish.
-> Internal: Bullish.
H4 Timeframe - Price has failed to target weak internal high, therefore, it would not be unrealistic if price printed a bearish iBOS.
The remainder of my analysis shall remain the same as analysis dated 13 June 2025, apart from target price.
As per my analysis dated 22 May 2025 whereby I mentioned price can be seen to be reacting at discount of 50% EQ on H4 timeframe, therefore, it is a viable alternative that price could potentially print a bullish iBOS on M15 timeframe despite internal structure being bearish.
Price has printed a bullish iBOS followed by a bearish CHoCH, which indicates, but does not confirm, bearish pullback phase initiation. I will however continue to monitor, with respect to depth of pullback.
Intraday Expectation:
Price to continue bearish, react at either M15 supply zone, or discount of 50% internal EQ before targeting weak internal high priced at 3,451.375.
Note:
Gold remains highly volatile amid the Federal Reserve's continued dovish stance, persistent and escalating geopolitical uncertainties. Traders should implement robust risk management strategies and remain vigilant, as price swings may become more pronounced in this elevated volatility environment.
Additionally, President Trump’s recent tariff announcements are expected to further amplify market turbulence, potentially triggering sharp price fluctuations and whipsaws.
M15 Chart:

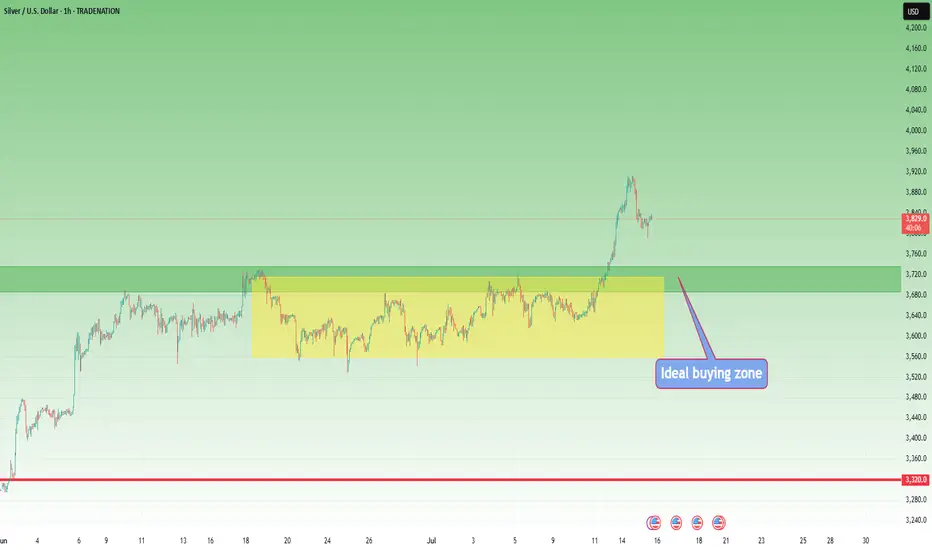
Silver Update (XAGUSD): Eyeing the Next Move After the $39 SurgeAs mentioned in my Friday analysis, Silver ( TRADENATION:EURUSD XAGUSD) was preparing for an important breakout — and indeed, the market delivered. The clean break through resistance triggered a strong acceleration, pushing the metal up to $39, pretty close to the psychological $40 level.
Now, we’re seeing a healthy correction after this steep rise, and this could turn into a buying opportunity for the bulls.
📌 Key support zone:
The ideal area to watch is between $37.20 and $37.50 — this is the sweet spot where bulls might step back in.
But be aware:
👉 After strong breakouts, the broken resistance doesn’t always get retested — sometimes the price rebounds from higher levels.
🎯 Plan of Action:
• Monitor price action under $38
• Watch for reaction patterns and structure shifts
• Don’t force entries — let the market confirm
Silver remains strong as long as the structure holds, and this pullback might just be the market catching its breath before another leg up. 🚀
Disclosure: I am part of TradeNation's Influencer program and receive a monthly fee for using their TradingView charts in my analyses and educational articles.
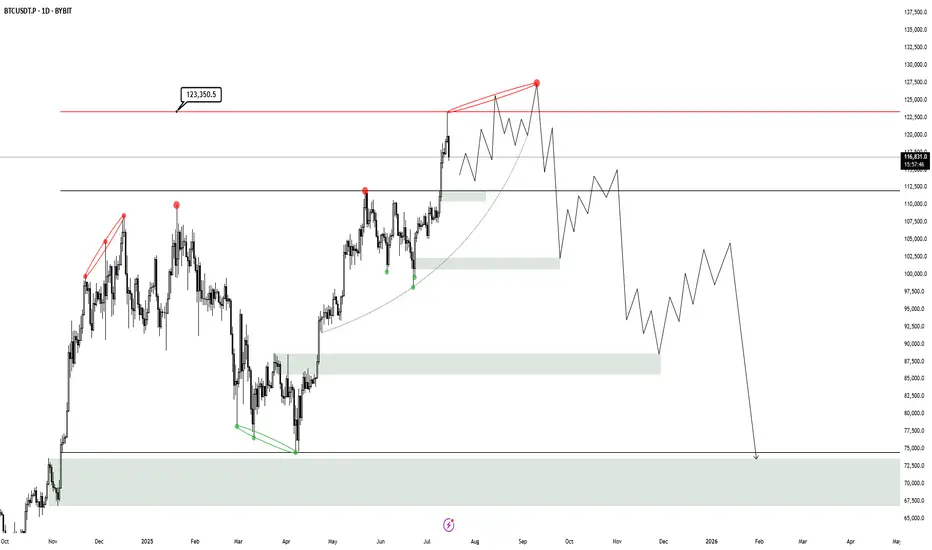
BTC HTF Distribution V3This is my new outlook for BTC if this 250 day old range is intended to be a HTF Distribution Model 1, which has neither been confirmed nor invalidated. A weekly close above 123.350$ will invalidate this model and likely lead to higher prices. Yesterday we had a perfect rejection from the deviation limit, which now probably creates a new range, that then will either reaccumulate or distribute.
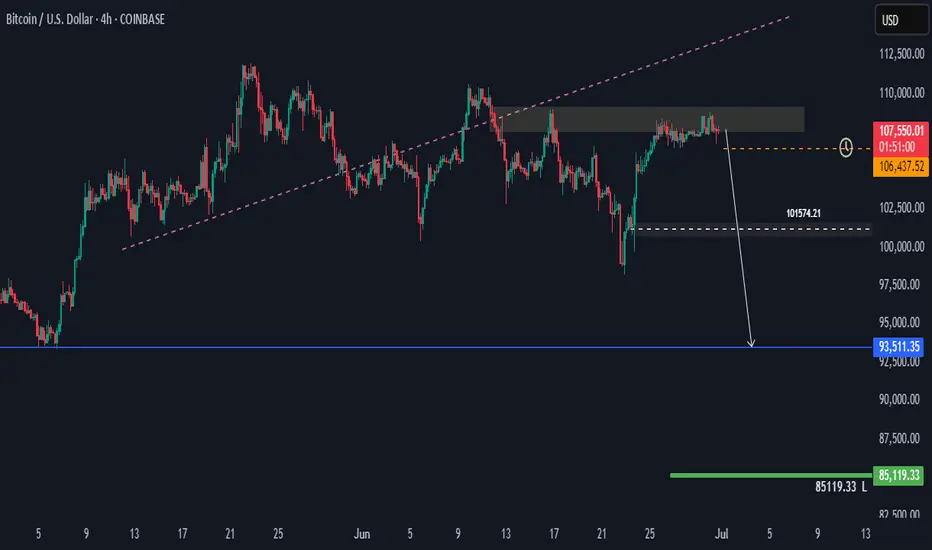
BTCUSD H4 Potential DropHi there,
BTCUSD H4: As long as the 85,119.33 level holds, the overall trend remains bullish in a larger scope.
Currently, the price is trading below the diagonal dotted trendline. The further it stays below this trendline, the stronger the bears' position.
The level of 101,574.21 is open for a bias towards 93,511.35.
Happy Trading,
K.
Not trading advice.
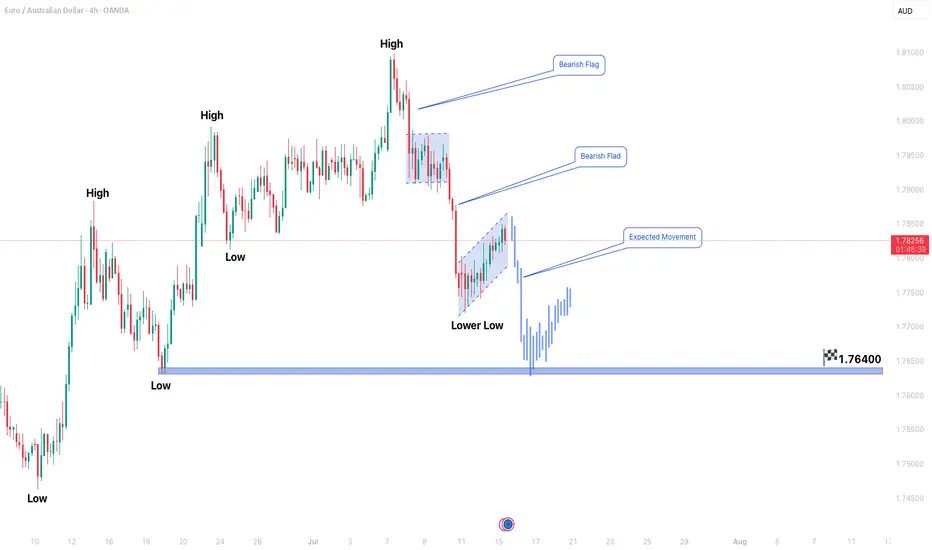
EURAUD FORMING BEARISH FLAG PATTERN IN 4H TIME FRAMEEURAUD Bearish Flag Pattern Suggests Further Downside Ahead
The EURAUD pair is currently exhibiting a bearish flag pattern on the 4-hour chart, indicating a potential continuation of the downtrend. Price action remains confined within a secondary corrective phase, but the primary bearish trend is expected to resume soon. Traders should watch for another bearish flag formation in the upcoming sessions, reinforcing the likelihood of further declines.
Key Observations:
1. Bearish Trend Structure: The pair has been moving in a clear downtrend, with lower highs and lower lows confirming seller dominance.
2. Secondary Trend Phase: The current consolidation represents a temporary pause before the next leg down.
3. Bearish Flag Formation: The flag pattern suggests a continuation signal, with a potential downside target near 1.76400.
Trading Strategy:
- Entry: Consider short positions only after a confirmed breakdown below the flag’s support with strong bearish momentum.
- Target: The measured move projection points toward 1.76400, but partial profits can be taken along the way.
- Stop Loss: A conservative stop should be placed above the recent swing high to limit risk in case of a false breakout.
Risk Management:
- Maintain a disciplined risk-reward ratio (at least 1:2).
- Avoid aggressive entries; wait for clear confirmation (e.g., a strong bearish candle closing below support).
Conclusion:
EURAUD remains bearish, and the formation of another bearish flag reinforces the possibility of further downside. Traders should remain patient for a confirmed breakdown before entering short positions while adhering to strict risk management rules.
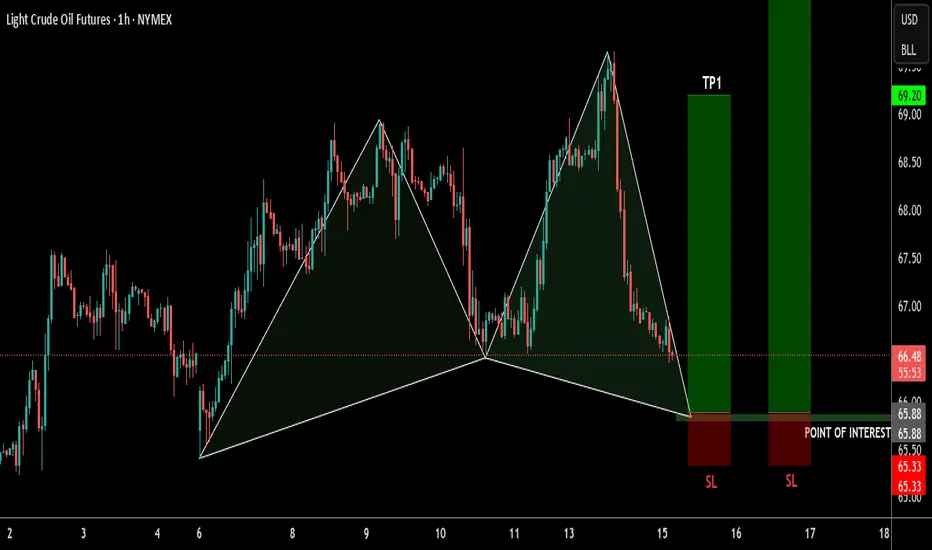
Oil Futures Approaching Key Reversal Zone – Bullish HarmonicOil futures may be forming a bullish Shark harmonic pattern, with price approaching the potential reversal zone at point D. This pattern suggests a possible bounce if buyers step in around this area. If price action shows signs of support or a shift in momentum, it could offer a solid long opportunity. Look for confirmation like bullish candles or indicators turning up before entering. If the pattern plays out, it could provide a strong risk-to-reward setup.
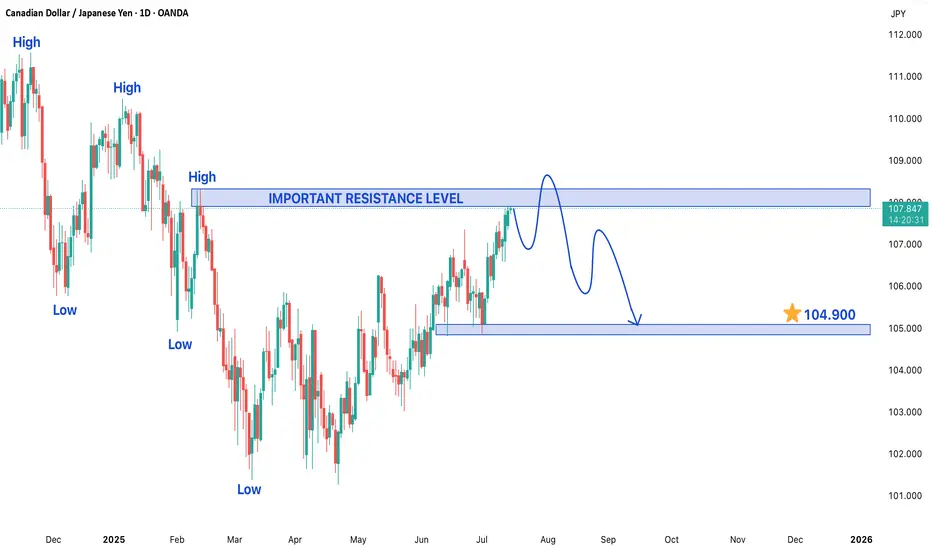
CADJPY TRADING IN A BEARISH TREND STRUCTUREThe CAD/JPY currency pair is currently exhibiting a bearish trend structure, indicating a prevailing downward momentum in its price action. At present, the pair is trading within a secondary trend near a significant resistance level, which is a critical point that could determine its next directional move. Traders and investors are closely monitoring this level as a breakout or rejection here could set the tone for future price movements.
On the lower side, if the bearish momentum continues, the price may decline toward the target of 104.900. This level could act as a key support zone, where buyers might step in to halt further losses. A break below this support could intensify selling pressure, potentially pushing the pair toward lower levels. Conversely, if the price finds stability near this support, a short-term rebound could occur, providing traders with potential buying opportunities in a corrective phase.
On the higher side, if the pair manages to overcome the current resistance, it may attempt to test the next key resistance level at 108.300. A successful breakout above this level could signal a shift in market sentiment, possibly leading to a trend reversal or a stronger corrective rally. However, given the prevailing bearish structure, any upward movement may face strong selling pressure near resistance zones, limiting upside potential.
Traders should remain cautious and watch for confirmation signals before entering positions. Key indicators such as moving averages, RSI, and MACD can provide additional insights into momentum and potential reversals. Risk management strategies, including stop-loss orders, should be employed to mitigate downside risks in case the market moves against expectations. Overall, the CAD/JPY pair remains in a bearish phase, and its next major move will depend on how it reacts to the critical resistance and support levels mentioned.