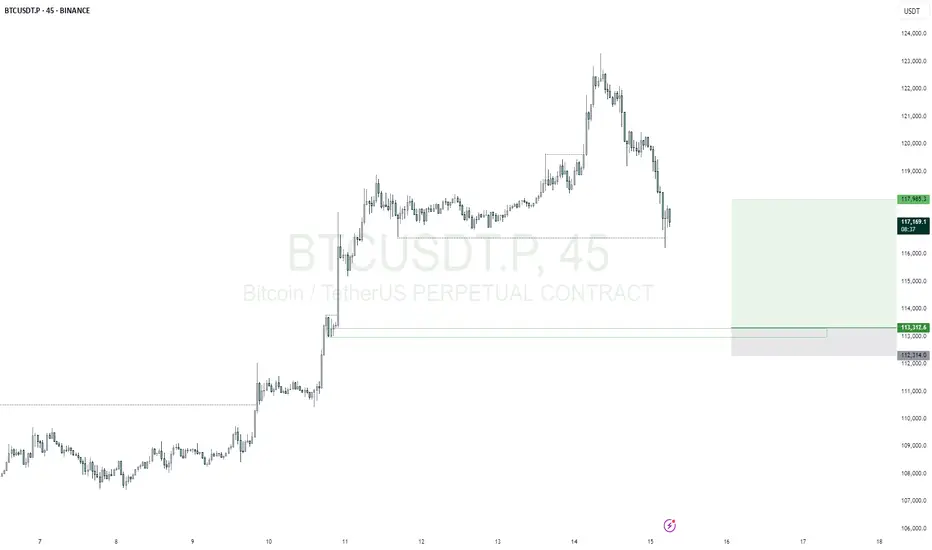
BTCUSDTmy entry on this trade idea is taken from a point of interest below an inducement (X).. I extended my stoploss area to cover for the whole swing as price can target the liquidity there before going as I anticipate.. just a trade idea, not financial advise
Entry; $113312.6
Take Profit; $117985.3
Stop Loss; $112314.0
Supply and Demand
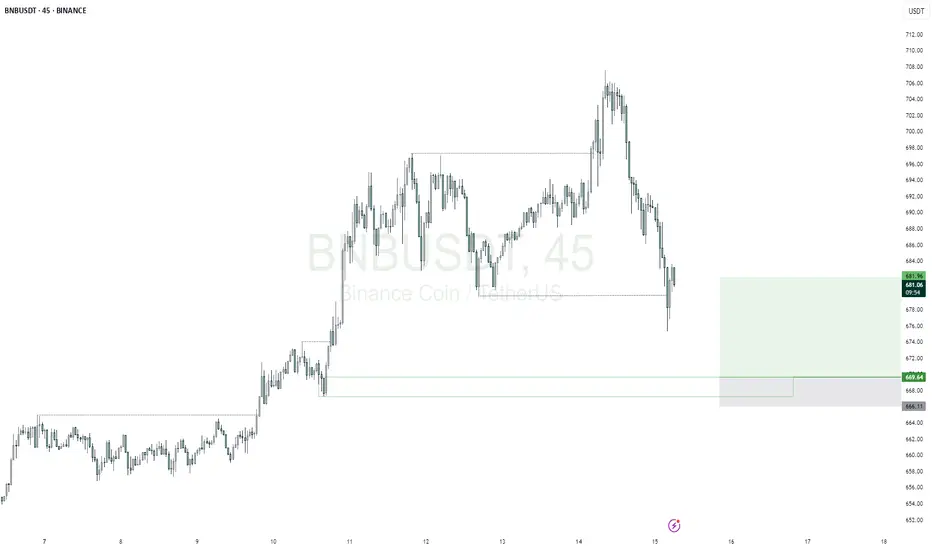
BNBUSDTmy entry on this trade idea is taken from a point of interest below an inducement (X).. I extended my stoploss area to cover for the whole swing as price can target the liquidity there before going as I anticipate.. just a trade idea, not financial advise
Entry; $669.64
Take Profit; $681.96
Stop Loss; $666.11
Gold is showing signs of bearish RSI divergence.🚨 Gold Update – Potential Selling Opportunity Ahead 🚨
Gold is showing signs of bearish RSI divergence on the 15-minute chart, while the RSI is already in the overbought zone. The price is also approaching a key supply zone, which could trigger a reversal.
📉 Multiple confirmations are pointing toward a potential sell setup:
Bearish RSI divergence
Overbought RSI condition
Approaching a strong supply zone
If price breaks below the 8 EMA with a bearish engulfing candle, it may confirm downward momentum.
⚠️ Watch closely — This setup is shaping up with solid confluence.
🔍 Always do your own research (DYOR) – This is not financial advice.

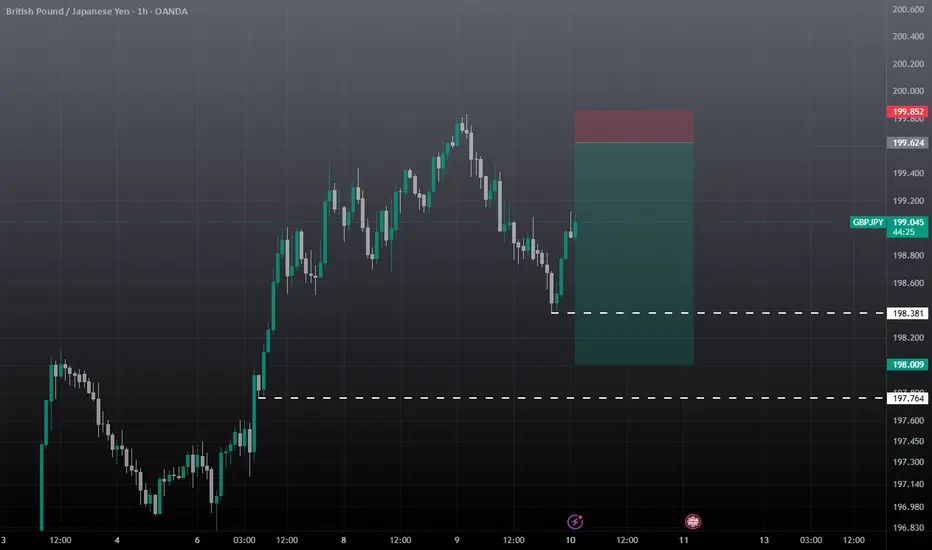
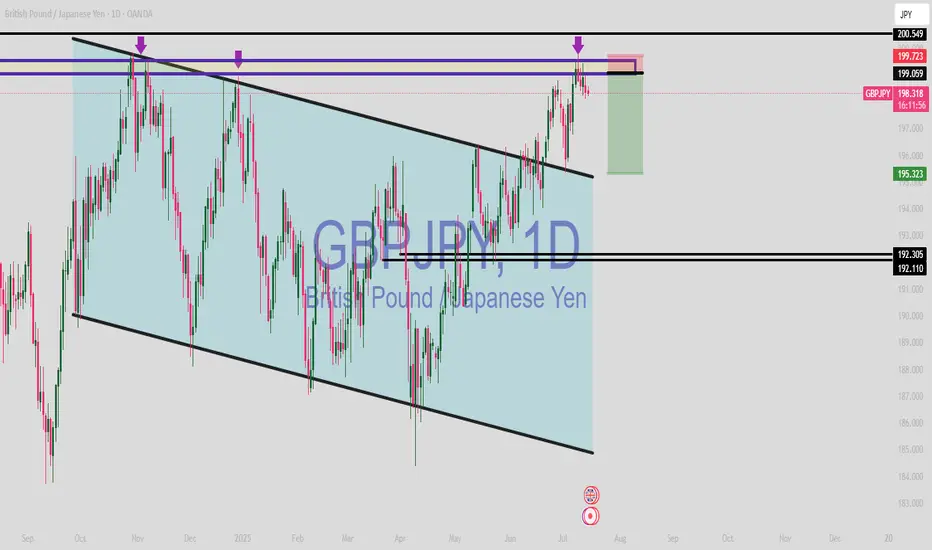
GBPJPY (SHORT)
GBPJPY broker the trendline and went to resistance level.
Jpy has been weak for 6months (1st half of year) now it will gain strength and jpy pairs to sell.
WHY: It summer holidays so tourist are traveling to Japan strengthening it currency Value.
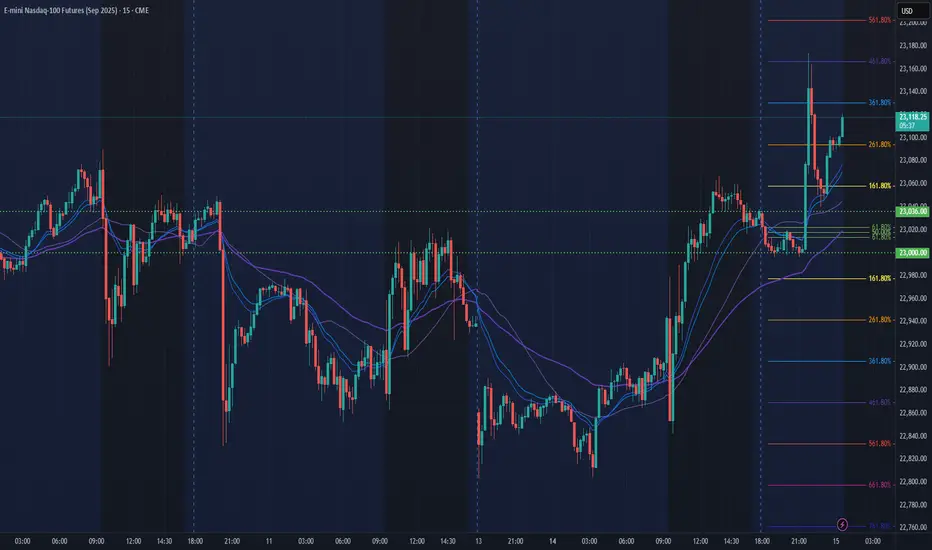
NQ Power Range Report with FIB Ext - 7/15/2025 SessionCME_MINI:NQU2025
- PR High: 23036.00
- PR Low: 23000.00
- NZ Spread: 80.5
Key scheduled economic events:
08:30 | CPI (Core|MoM|YoY)
Asian hours vol spike breakout swing into new ATHs
Session Open Stats (As of 12:15 AM 7/15)
- Session Open ATR: 290.39
- Volume: 42K
- Open Int: 276K
- Trend Grade: Neutral
- From BA ATH: -0.3% (Rounded)
Key Levels (Rounded - Think of these as ranges)
- Long: 23239
- Mid: 21525
- Short: 20383
Keep in mind this is not speculation or a prediction. Only a report of the Power Range with Fib extensions for target hunting. Do your DD! You determine your risk tolerance. You are fully capable of making your own decisions.
BA: Back Adjusted
BuZ/BeZ: Bull Zone / Bear Zone
NZ: Neutral Zone
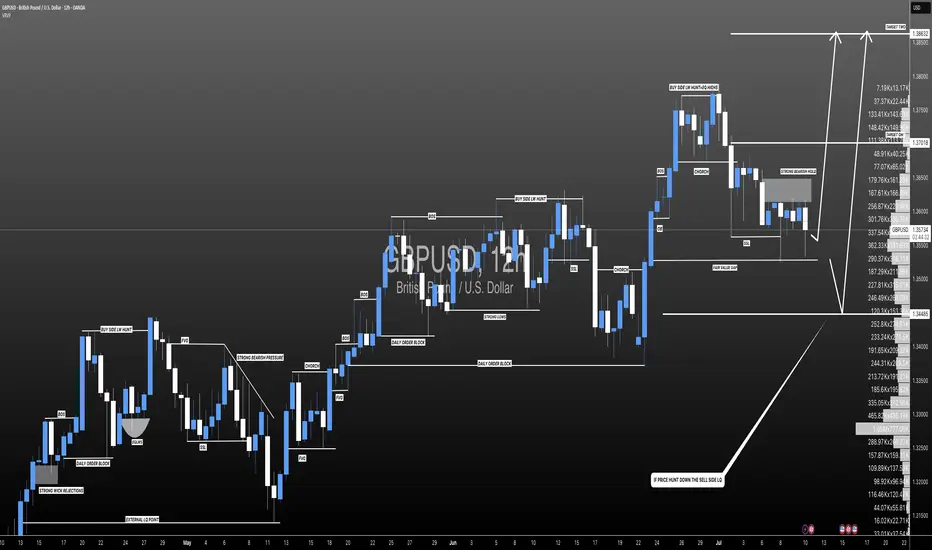
GBPUSD pre CPI move potential long into shortGBPUSD resting at support, i prefer to trade into Monday liquidity before major sell off, UK tends to push price higher in mornings to continue sell off later that day. Caution advised, neither are confirmed

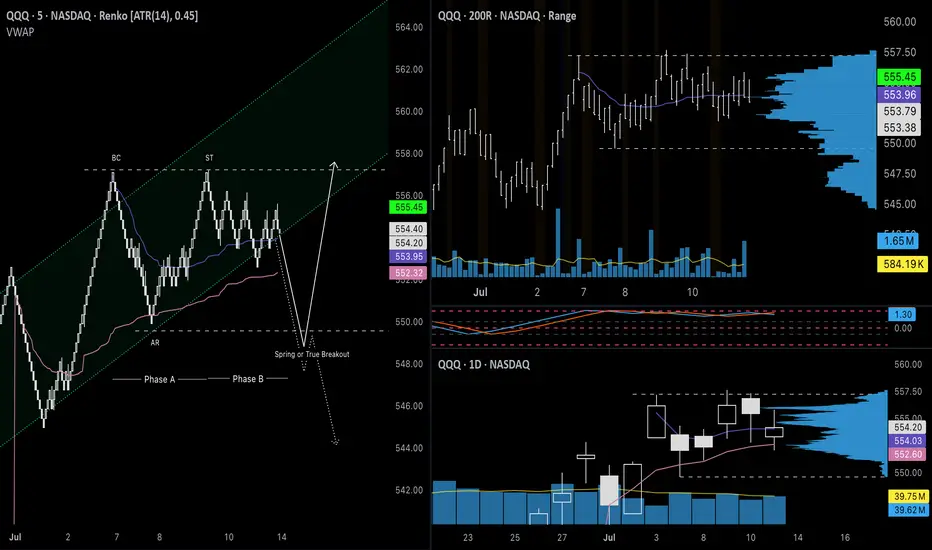
QQQ July 14th 2025I failed to update my trade journal at the end of last week and am going to try to be better about it this week. I am going to try to keep these posts more brief so I can remain consistent and meet my goal of creating an accurate timeline of my trades. For this week, I am going in with a bullish bias, which is better supported on the PA for NASDAQ:QQQ instead of AMEX:SPY , so I will be trading it instead.
The price is currently down 0.60% overnight, which would take the price near the bottom of the range ($550), which is outside of the channel. In this flat structure, we will either see the price break up after a liquidity test (spring) or break down in a true bearish reversal.
+++++++++++++++++++++++++++
Neutral Analysis
Renko: As my main chart, Renko clearly shows both scenarios, illustrated by the solid white (bullish) line and the dotted (bearish) line. For the bullish idea, the price will find a significant number of buyers after a false breakout to the downside. I switched from Traditional box sizes to ATR (14) filtered, and as you can see, the automatic rally (AR) after the peak did not have a significant retracement. We did not see a retest of the upper part of the range that could be considered a secondary test (ST) until some time later and when it did, the price rose back to the peak, indicating that buyers still had strength. From there, the price has been chopping around in Phase B without making much progress to the downside, which it will most likely reach on Monday in the form of a gap down. Additionally, the rising channel that led to this pullback is also a strong pattern, so this pullback should be treated as possible re-accumulation. If the price fails to reenter the channel or reach the top after a breakout below the range, it will likely sell off from there.
200R Chart: The range chart also supports that the secondary test was the retest of the top of the channel, a potential sign of strength. The price is still way above the 200MA, so the uptrend appears strong. One important area to watch is the volume gap from $548-$549 on the volume profile. If bulls cannot defend the gap, that could be a potential sign of weakness.
500R Chart: I am including this chart because it does provide a reason to be cautious of a pullback, or even a reversal. The price is at the top of the channel that began on April 9th. The last time the price tested the upper boundary, it formed a temporary top and pulled back, which we could see play out again here. The volume candles also show significantly higher interest since May 13th. This could either be due to increased interest from buyers or the distribution of shares, requiring more effort to move the price higher.
Daily Chart: Here is another chart that suggests that the first movement that could be considered a secondary test was the retest of the top of the range. The price has been bouncing off monthly VWAP and Fisher Transform remains flat in the upper zone. We have not seen a bearish candle with intent on the daily chart. These have all been flat doji candles.
Options: For this section, I can’t provide a good analysis of on-the-money options since the price is likely to gap down. I’m including 7/15 $550p since the price will likely open around that level and will need to move below the strike to see the premium rise significantly. The price of this contract was in a larger descending channel and will need a strong break above the top ($2.15) in order to signal further downside for $QQQ. According to my options calculator, this would require the underlying price to drop below $551 for an extended period.
+++++++++++++++++++++++++++
Targets
Calls: Open at $549; Close at $557; Stop below $548
Puts: Open $550-$552; Close at $544.50; Stop above $555
Market Watch UPDATES! Stock Indices, Gold, Silver, US OILWelcome to the Market Watch Updates for Monday, July 14th.
In this video, we will give the forecast updates for the following markets:
S&P500, NASDAQ, DOW JONES, GOLD, SILVER and US OIL.
Enjoy!
May profits be upon you.
Leave any questions or comments in the comment section.
I appreciate any feedback from my viewers!
Like and/or subscribe if you want more accurate analysis.
Thank you so much!
Disclaimer:
I do not provide personal investment advice and I am not a qualified licensed investment advisor.
All information found here, including any ideas, opinions, views, predictions, forecasts, commentaries, suggestions, expressed or implied herein, are for informational, entertainment or educational purposes only and should not be construed as personal investment advice. While the information provided is believed to be accurate, it may include errors or inaccuracies.
I will not and cannot be held liable for any actions you take as a result of anything you read here.
Conduct your own due diligence, or consult a licensed financial advisor or broker before making any and all investment decisions. Any investments, trades, speculations, or decisions made on the basis of any information found on this channel, expressed or implied herein, are committed at your own risk, financial or otherwise.

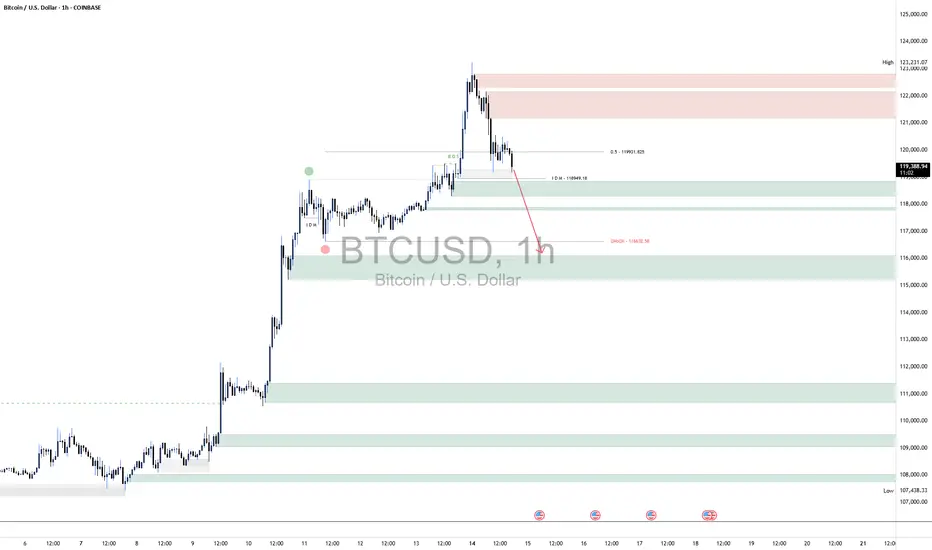
BTC ShortBTC’s 1‑hour structure is showing clear signs of weakness following rejection from the premium supply zone between 122 000 and 123 200. After sweeping equal highs and tapping into the 50 % internal retracement level around 119 900, price sold off sharply, breaking below the intraday demand at ~119 000. This shift in market structure signals bearish intent in the short term.
The strong rejection, combined with increased sell-side volume, indicates that the rally was more likely a liquidity grab than true bullish strength. As a result, BTC is now expected to continue lower toward the 117 000 level to clear resting liquidity beneath recent lows. This level aligns with the previous CHOCH (Change of Character) and is a key liquidity pocket.
Once BTC grabs the liquidity below 117 000, we anticipate a potential bullish reaction and reversal, as smart money may use this area to re-accumulate and drive price higher.
However, until that liquidity is collected, the bias remains bearish in the short term. As always, proper risk management is essential—define your invalidation clearly and manage position size responsibly to protect capital in this volatile environment.
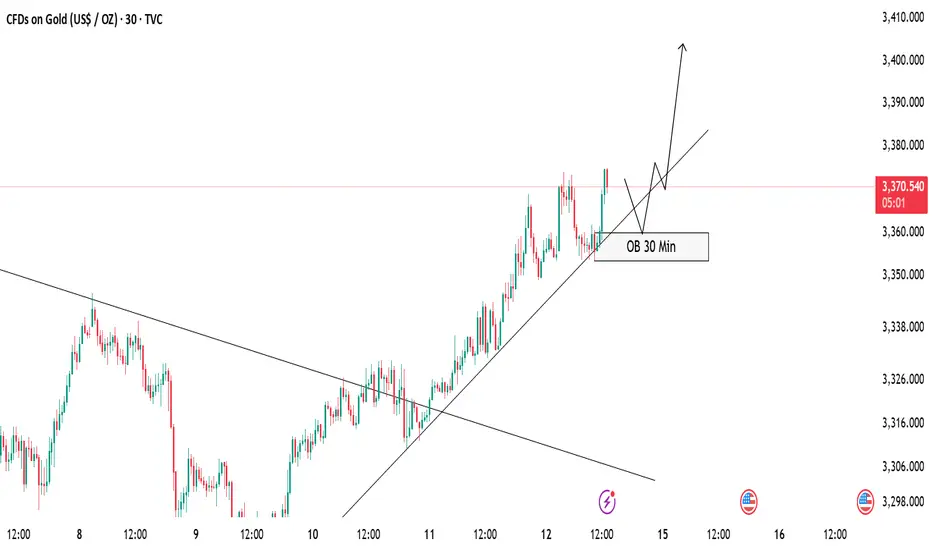
GOLD Buy Setup – OB Zone in FocusCurrently, gold is respecting the ascending trendline and maintaining a bullish structure 🟢. Price hasn’t tapped into the 30 Min Order Block (OB) yet, but we are expecting a potential pullback into this OB zone 📍.
✅ Our Plan:
We will wait patiently for price to mitigate the OB.
After the tap, we will look for bullish confirmation (rejection wick, bullish engulfing, or break of minor structure) before entering a buy position 🚀.
As long as the trendline holds, we remain bullish on gold.
📝 Invalidation:
If price breaks and closes below the trendline and OB zone, we will stay out or re-evaluate the setup ❌.
Stay disciplined and follow the plan! 💪
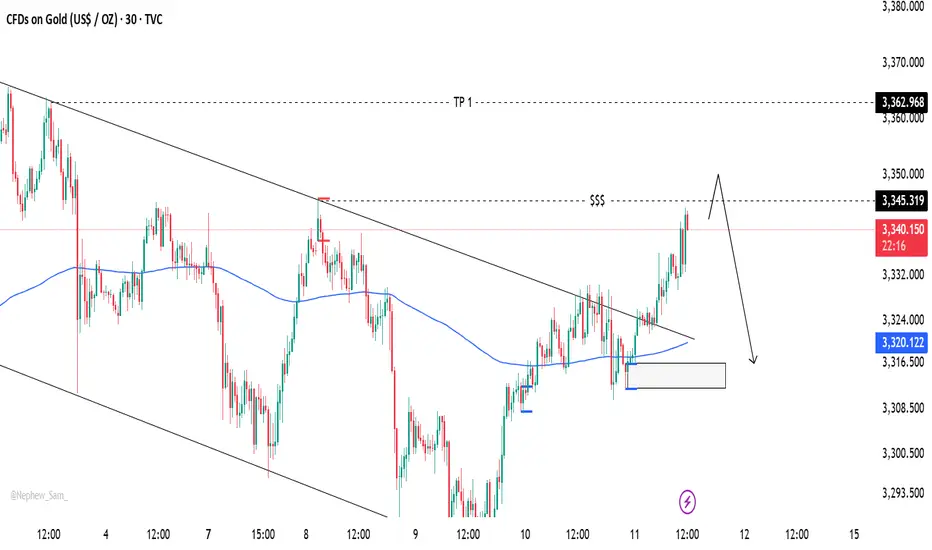
Gold’s Chart Update Next Move: Bullish or Bearish?Gold has shown strong bullish momentum 💪 as it breaks through the descending trendline 📉, positioning itself to target the upper liquidity zone 💰. Right now, we have two key scenarios to watch:
1️⃣ Bullish Scenario: If Gold breaks above the 3345 level and closes a solid candle above it 🔝, we could see a move towards 3360 🚀, signaling further upward potential.
2️⃣ Bearish Scenario: However, if Gold sweeps the 3345 zone and fails to maintain the bullish momentum 🔻, we may see a pullback that could push prices lower 📉.
Stay vigilant 👀 and keep an eye on price action for the next big move! 🔍📊
Market Watch UPDATES! FOREX Major PairsWelcome to the Market Watch Updates for Monday, July 14th.
In this video, we will give the forecast updates for the following markets:
USD Index, EURUSD, GBPUSD, AUDUSD, NZDUSD, USDCAD, USDCHF and USDJPY.
Enjoy!
May profits be upon you.
Leave any questions or comments in the comment section.
I appreciate any feedback from my viewers!
Like and/or subscribe if you want more accurate analysis.
Thank you so much!
Disclaimer:
I do not provide personal investment advice and I am not a qualified licensed investment advisor.
All information found here, including any ideas, opinions, views, predictions, forecasts, commentaries, suggestions, expressed or implied herein, are for informational, entertainment or educational purposes only and should not be construed as personal investment advice. While the information provided is believed to be accurate, it may include errors or inaccuracies.
I will not and cannot be held liable for any actions you take as a result of anything you read here.
Conduct your own due diligence, or consult a licensed financial advisor or broker before making any and all investment decisions. Any investments, trades, speculations, or decisions made on the basis of any information found on this channel, expressed or implied herein, are committed at your own risk, financial or otherwise.

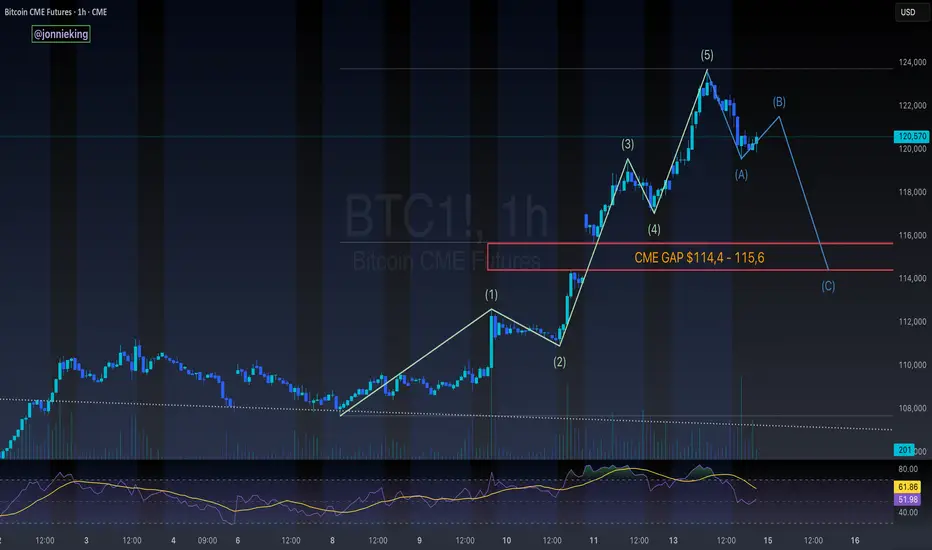
$BTC 5-Wave Impulse > ABC Correction > CME GapCRYPTOCAP:BTC appears to be headed towards an ABC correction after this impulsive 5-wave move to the upside
Would be a great opportunity to fill the CME gap ~$114k
Lines up perfectly with the 50% gann level retracement to confirm the next leg
don't shoot the messenger..
just sharing what i'm seeing 🥸
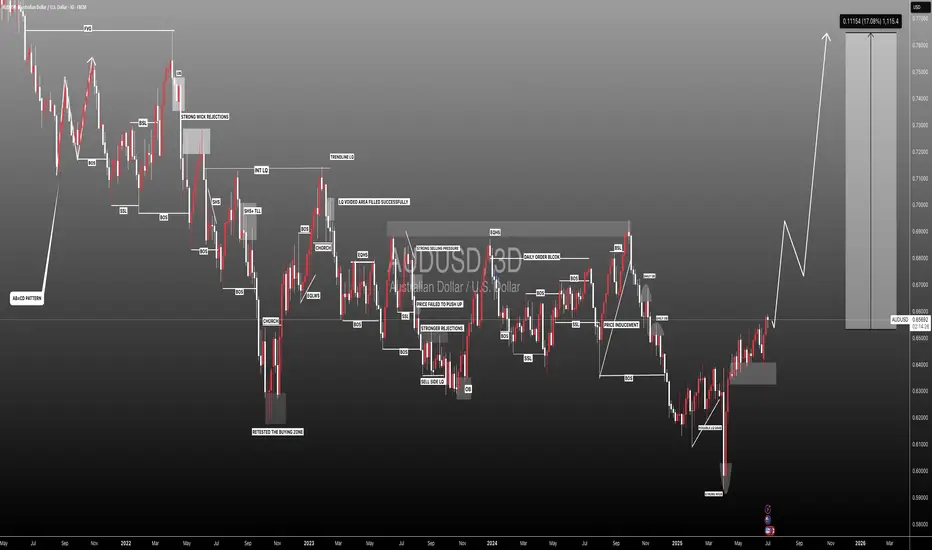
#AUDUSD: +1100 Pips Possible Swing Bullish Move! AUDUSD a strong sign of bullish behaviour has appeared alongside bullish momentum. As we have NFP tomorrow, we expect market to remain volatile; what we think now is to have market settled down before we can have any confirmation. We recommend to remain extra cautious tomorrow, once market get settled we can then enter with accurate risk management.
Like, comment and Share for more!
Team Setupsfx_
#ETHUSDT: Currently On The Way Towards Filling The FVG?ETCUSDT is currently experiencing a significant correction as the price approaches a pivotal juncture where a substantial bullish price reversal is anticipated, potentially propelling it to new all-time highs or even surpassing them. It is imperative to exercise meticulous risk management and conduct your own thorough analysis before engaging in any cryptocurrency trading or investment activities.
Should the price indeed undergo a major correction, it is likely to decline to our second designated area, where it is anticipated to fill the liquidity gap and subsequently reverse course, continuing its trajectory towards our established targets.
Please consider this analysis as a secondary influence only, or even solely for educational purposes. It is crucial to conduct your own independent analysis and risk management prior to engaging in any cryptocurrency trading or investment endeavours, as they inherently carry substantial financial risks.
We extend our best wishes and encourage you to trade safely and responsibly.
Should you wish to demonstrate your support, you are welcome to express your appreciation through likes, comments, or sharing this information.
Thank you for your consideration.
Have a pleasant weekend.
Team Setupsfx_

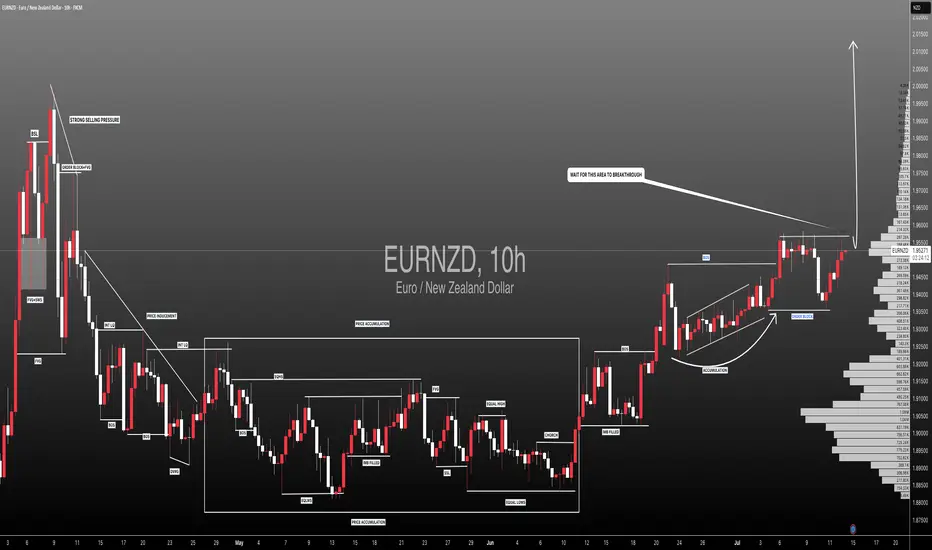
#EURNZD: Wait For Price Breakthrough,Swing Buy With ConfirmationEURNZD is trading at a critical level where the price has previously rejected multiple times. If the price breaks through this region, we could see a swing move and touch the previous higher high. The main question is to wait for a proper breakthrough. When the price does that, we can enter with confirmation. Remember, patience is key!
Good luck and trade safely. Do your own due diligence.
Team Setupsfx_
GBPUSD: Two Strong Bullish Area To Buy From ?GU is currently in a bullish trend when examined on a daily time frame. There are two potential areas for purchase. The first area is currently active, as we anticipate a price reversal from this point. There is a significant possibility that price could decline to the second area and subsequently reverse from there directly. The sole reason we believe price could drop to the second area is if the US Dollar experiences corrections, which could cause GU to drop to our second area and subsequently rebound.
If you appreciate our analysis, we kindly request that you consider the following actions:
-Liking the Ideas
-Commenting on the Ideas
-Sharing the Ideas
We extend our sincere gratitude for your continuous support. We trust that our insights have provided even a modicum of assistance.
Team Setupsfx_
❤️🚀
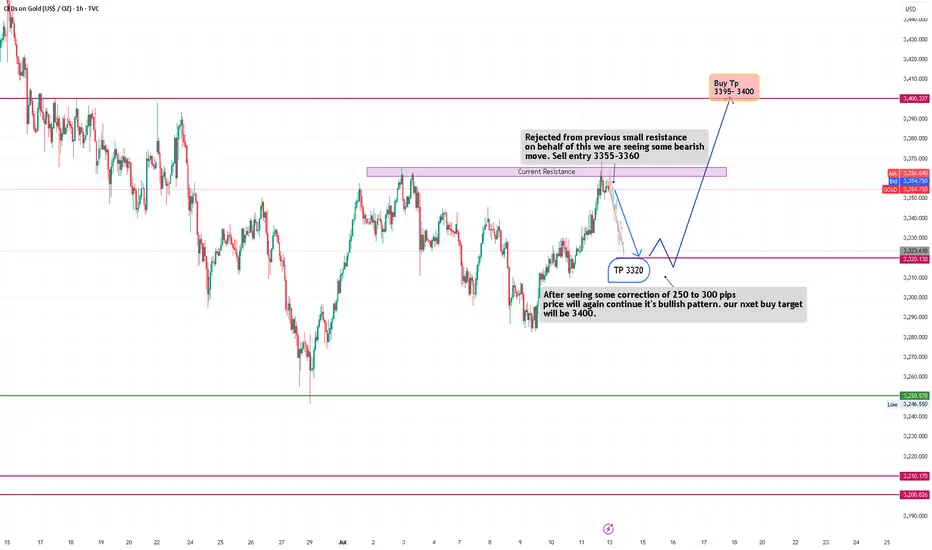
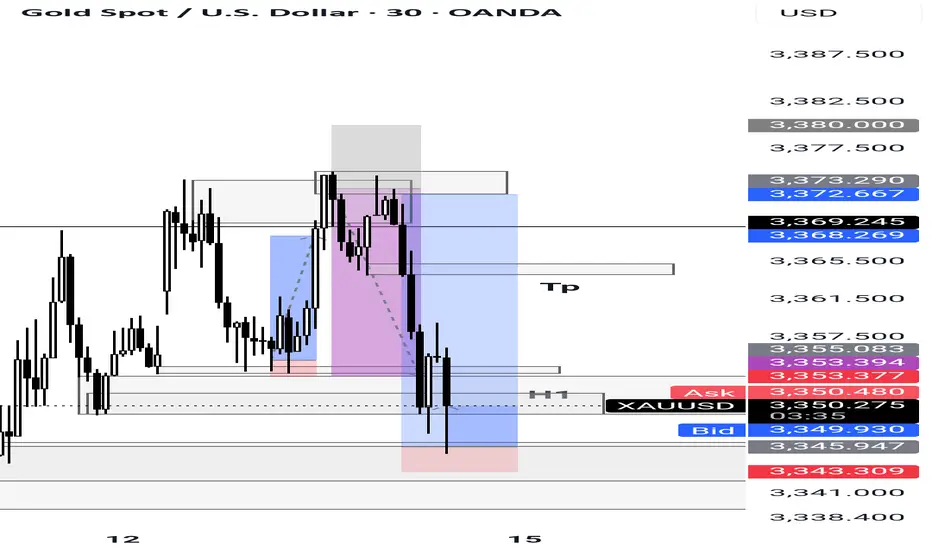
XAUUSD trade idea🟣 Current Market Behavior
Price has reached a resistance zone around 3355–3360, previously respected as a supply area.
A rejection candle or price weakness at this level is triggering a short-term bearish outlook.
🔻 Short-Term Bearish Plan
Sell entry zone: 3355–3360
> Target for this sell (TP): 3320
➤ This suggests a possible drop of around 250–300 pips from the current high.
> Reason: The price is expected to make a technical correction after hitting a resistance level.
🔼 Mid-Term Bullish Plan
: After reaching the 3320 support area, the chart expects a bullish reversal or continuation of the uptrend.
> Buy setup target: 3395–3400
➤ This level represents the next potential bullish wave after the correction.
> Reason: The overall pattern remains bullish. The idea assumes this drop is temporary and part of a healthy pullback before the uptrend resumes.
📝 Summary:
Phase 1: Sell from 3355–3360 to 3320 (correction phase)
Phase 2: Buy from 3320 toward 3395–3400 (bullish continuation)
Strategy combines resistance rejection + correction + trend continuation principles.
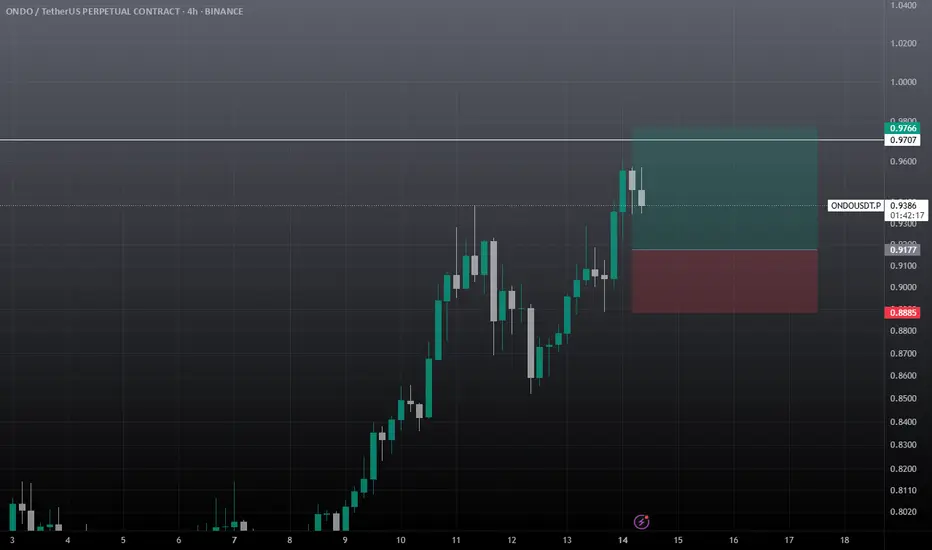
Ondo USDT SCALP TRADEIF this 4hr fvg breaks then I will look for short, otherwise expecting to hold this level and wipe out previous liquidation.
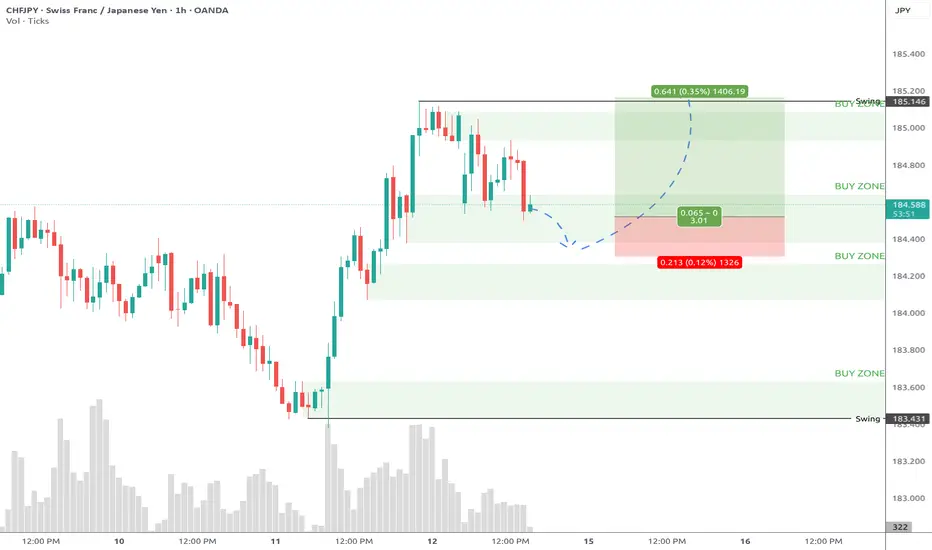
CHFJPY 60/5 Pullback Long4hr trend is bull. 1hr is current pulling back. Will long once confirm bullish. Expecting the pullback will be deep and close below intermediate buy zone. then go fly up.
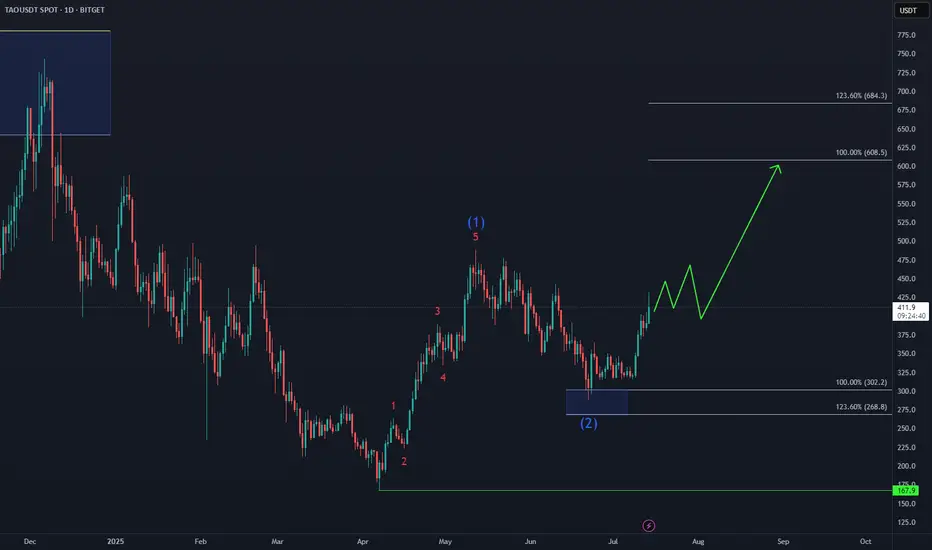
Bittensor TAO Eyes Next Upside Target📈 BINANCE:TAOUSD attracted strong demand in the Blue Box buying zone at $302–$214, triggering the next bullish leg.
Elliott Wave projections now point toward a move into the $608–$684 target area, supported by impulsive structure and rising momentum.
As long as price holds above the recent low, the bullish sequence remains intact.
Xauusd longGold hit be and we booked +90 pips of 80% our position and it's again in our buy zone .
So long now .
GBPJPY Swing Trade Setup, Sell, Short SetupA Good RR setup, wait for the entry, when price reaches the poi, look for any weakness ltf and then take trade, we are taking trade on 1hr, so for entry look for 5m tf. I will update the trade status where to take or not!