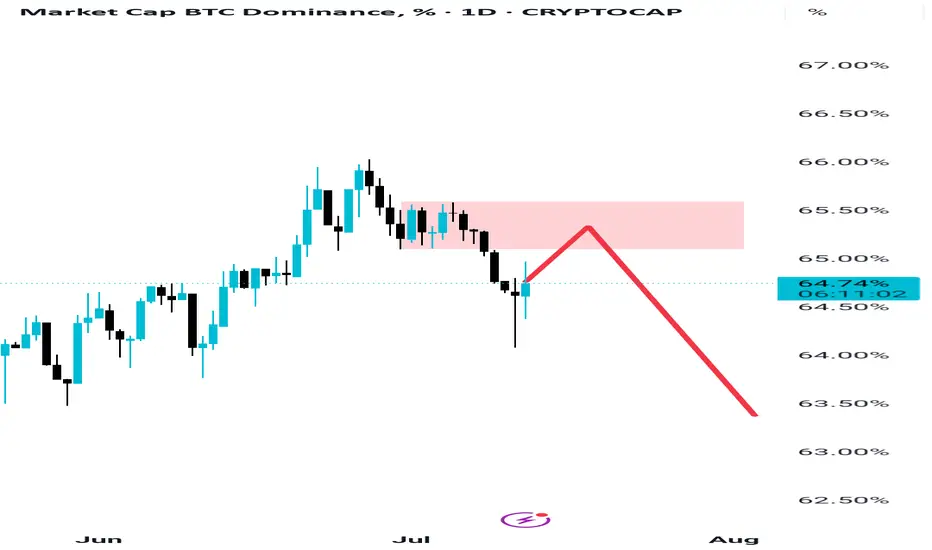
Btc Dominance Just doing retest, HOLD Everyone is selling their altcoins out of fear after minor pumps, but they don’t realize that Bitcoin dominance is only retesting its supply zone. It has already broken its structure, indicating a shift into a downtrend. This retest is not a reversal—yet people are spreading fear among each other as if something major is about to happen. Many will miss what’s coming and regret it later. Don't miss Altseason which is coming in few days not weeks.
Mind It
Supply and Demand
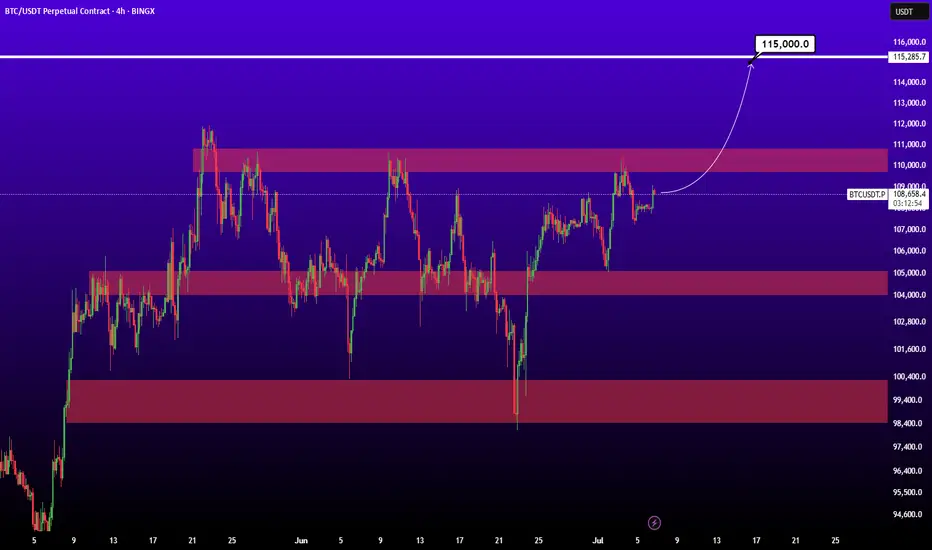
BTCUSDTWait for breaked ATH for 115K target.
BINANCE:BTCUSDT.P
Now price is in two level trading renge but come entry volume of buyers.
SOL USDT SCALP Long / Buy Setupwait for the entry and then take, as liquidation still lies upside, chances are high that sol will re-visit 164, before any major move to the downside. SL is important on any side. We took good profit on previous SOL short setup.

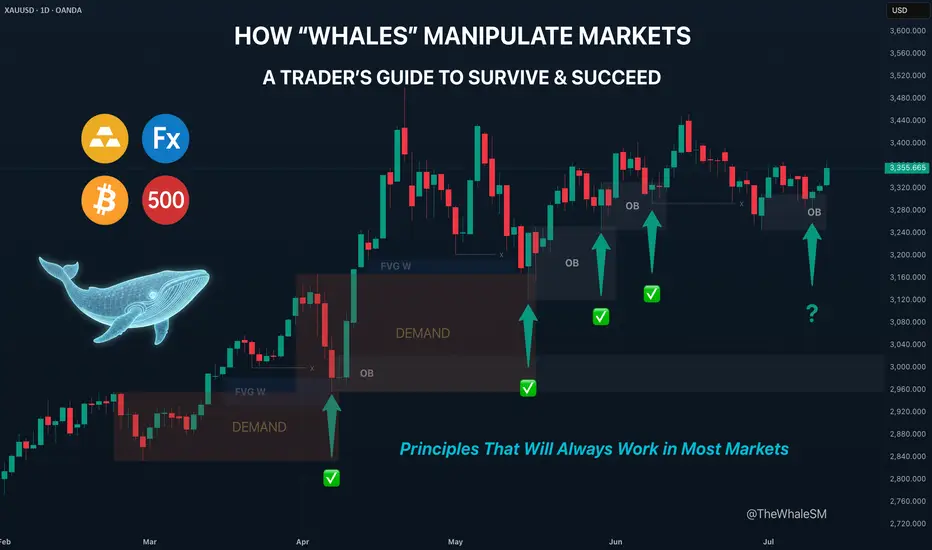
How "Whales" Manipulate Markets: A Trader's Guide to SucceedEvery chart tells a story of institutional footprints. For most, it's chaotic noise. But when you understand the market's true engine — the constant need of "Smart Money" to capture vast amounts of liquidity to fill their orders — that noise turns into a clear map.
This guide will teach you to read that map. We will break down the main types of manipulation and show you how to use them to identify high-probability zones for potential entries.
So, why exactly is liquidity the fuel for these "Smart Money" players, which for simplicity, we'll call "Whales"? It's because a Whale holds the largest volume of funds in a specific asset and, unlike retail traders like us, it cannot open its huge position at any given moment simply because there aren't enough buy or sell offers on the market.
To fill its orders, the Whale constantly carries out manipulations to capture additional liquidity. This isn't about deception or anything negative—it's how the market constantly forms its movements, how whales achieve their goals by moving from one liquidity pool to another, much like whales in the ocean hunt for plankton to get vital energy for long journeys from one feeding ground to another.
Why will these principles of price movement through manipulation, which worked decades ago, continue to work forever? Because human nature doesn't change over time. The crowd is always driven by greed and fear, making it easy to manipulate. Therefore, manipulation is often the motive for the birth of a future move and is a key element in market mechanics. If you understand these mechanics, you will be able to see the footprints of whales on any chart and not only minimize your chances of becoming their food but also join their next move to get your share of the profit in the boundless ocean of market opportunities.
Let's take a closer look at how whales carry out their manipulations and classify their types.
The Whale is constantly in hedged positions. To fill its large-sum orders without impacting the price, it uses the principles of Sell to Buy (STB) and Buy to Sell (BTS) .
The STB manipulation is used to accumulate long positions. To do this, the Whale opens an opposing short position, activating stop orders and liquidations of buyers, purchasing their positions at a favorable price. It also encourages other retail participants, especially breakout traders, to open short positions. Continuing to accumulate long positions, the Whale sharply moves the price up, liquidating short participants and absorbing their positions. After the price has moved up, the Whale is left with an open losing position from its short manipulation. To close it at breakeven or a small loss, the Whale needs to return the price back to the zone of its manipulation. This return is called mitigation .
In the opposite case, when the Whale needs to drive an asset's price down, it uses the BTS manipulation . To fill its short positions, the Whale opens a long position, activating stop-losses and forced liquidations of sellers, and encouraging retail breakout traders to also open long positions. Continuing to accumulate short positions, the Whale aggressively moves the price down, absorbing and liquidating the positions of impatient longs. After the downward impulse is complete, the Whale is left with an open losing long position. Just as in the first case, to close it at zero or a small loss, the Whale needs to return the price to the manipulation zone, after which another markdown of the asset occurs, and the cycle can be repeated as many times as necessary.
Thus, through manipulation, the Whale achieves two goals at once:
It gets the most favorable price.
It eliminates most of its competitors by liquidating their positions with an opposing move.
Most of the time, the price movement between manipulations is unpredictable. Entering during this movement, for example, in the middle or end of an impulse or within a range, increases the chances that you will become a victim of the next manipulation and liquidity for the Whale. However, if you wait for the price to arrive at the manipulation zone, also known as a Point of Interest (POI) , and ensure that the Whale acknowledges this area (i.e., it has stopped there and is beginning a reversal), the probability of choosing the correct direction for a trade will be on your side.
To help you recognize manipulation zones, let's look at their different types.
🔹 Order Block (OB) - A down candle (sometimes 2, rarely 3 candles) before an impulsive move up (in the case of a bullish OB), or an up candle (sometimes 2, rarely 3 candles) before an impulsive move down (in the case of a bearish OB). In most cases, this short, sharp move should sweep some form of significant liquidity. An additional confirmation of an Order Block is the immediate imbalance or Fair Value Gap (FVG) that follows it, because the Whale's intensive position accumulation and the associated impulse move don't allow enough time for all market participants' orders to be filled.
🔹 Demand/Supply Zones are similar in principle to Order Blocks but differ in that they have a more prolonged action, which can consist of many up or down candles, making these zones often significantly wider than OBs.
Demand Zone - The last downward move before an intensive rally.
Supply Zone - The last upward move before an intensive drop.
Often, an Order Block can be found inside a Demand/Supply zone.
🔹 Range - Also a manipulation zone and essentially an Order Block, but unlike an OB, this manipulation can last for a very long time when the Whale lacks sufficient liquidity from a quick manipulation and accumulates its large position by collecting internal and external liquidity through the range. Ranges, just like Order Blocks and Demand/Supply zones, are points of interest for the Whale to close its losing hedged positions and continue moving towards its goals.
Conditions for Applying and Validity of Manipulation Zones
An important condition for applying manipulation zones is that they can only be used once . That is, if the price has come to a zone and reacted to it, upon a second arrival, that zone is no longer valid. For convenience in marking used zones, I shorten them to the point of the first touch so as not to consider them anymore, but to understand which way the order flow is directed—a very important concept that, unlike structure, shows the true direction of the Whale's movement. Order flow is manifested by the price reacting to manipulation zones from below in an uptrend and from above in a downtrend.
It is also very important to understand that it makes sense to identify and use manipulation zones as one of a trade's entry conditions only from below for an uptrend and from above for a downtrend . Any counter-trend zones formed in the path of a trend are highly likely to be broken and serve as liquidity.
In ranges, manipulations formed after deviations can be used for entries from both sides.
Only manipulations that were formed at the beginning of an impulsive price move can be considered valid for entry. That is, they must be the manipulations that directly triggered the start of the move; in Smart Money terminology, they are often called the "origin" . Any manipulation in the middle or end of a move will most likely serve as liquidity on the way back to mitigate the origin zone.
How long does a manipulation zone remain relevant? It remains relevant until a new structural element (a higher high or a lower low) is formed , especially if the price has already come close to the manipulation zone, for example, into the FVG before the zone. This most likely means the Whale has already finished its business there and closed one of its losing hedged positions at a small loss. When the trend changes, such a zone will act as liquidity, not a POI. So, a manipulation zone will not always be mitigated; often, a reversal occurs from the FVG before it. However, entering from an FVG is much less reliable than from an Order Block, Demand/Supply zone, or Range. I personally skip such entries and wait for a new manipulation zone to form and be mitigated; they happen on the market constantly.
A good bonus that further strengthens the probability of a setup working out during the mitigation of manipulation zones is a liquidity sweep upon reaching them.
Consider the context and supplementary conditions. Although manipulation zones are the strongest areas for price reversals, they should always be used in conjunction with other supplementary conditions and tools, for example, with Fibonacci retracement levels or liquidity sweeps. "Context" implies any other conditions that can either confirm or contradict the likely direction of price movement. For example: in which phase of correction is the price? For a long, safe entries can only be considered from the discount zone (below the 50% Fib level); for shorts, only from the premium zone (above the 50% Fib level). Is there significant, un-swept liquidity nearby, such as previous daily, weekly, or monthly highs/lows, or an untouched Asian session high/low? What upcoming news could affect the asset and hit the stop before the setup plays out? At what time of day did the price mitigate the manipulation? Taking context into account is a crucial and integral part of analysis in the search for entry points.
Due to the fractal nature of market charts, manipulations can be seen on any timeframe. On weekly and daily timeframes, manipulation zones can be used for swing trading or investment purchases. 4-hour and 1-hour timeframes will show potential entries from manipulations for intraday trading or holding positions for several days. 5-minute and 1-minute timeframes will show manipulations in the form of order flow for final entry confirmation.
Whatever type of analysis you use for your trading, understanding the nature of market manipulations and practicing their recognition will allow you to be one step ahead of most market participants and open your trades with an understanding of which way institutional capital is most likely to move next.
~~~~~~~~~~~~~~~~~~~~~~~~~~~~~~~~~~~~~~~~~~~~~~~~~~~~~~~~~~~~~~~~~
If you found this guide helpful, support it with a Boost! 🚀
Have a question or a "lightbulb moment" from this article? Share it in the comments! I read every single one. 💬
► Follow me on TradingView for more educational content like this and to not miss my next detailed trade idea .
~~~~~~~~~~~~~~~~~~~~~~~~~~~~~~~~~~~~~~~~~~~~~~~~~~~~~~~~~~~~~~~~~
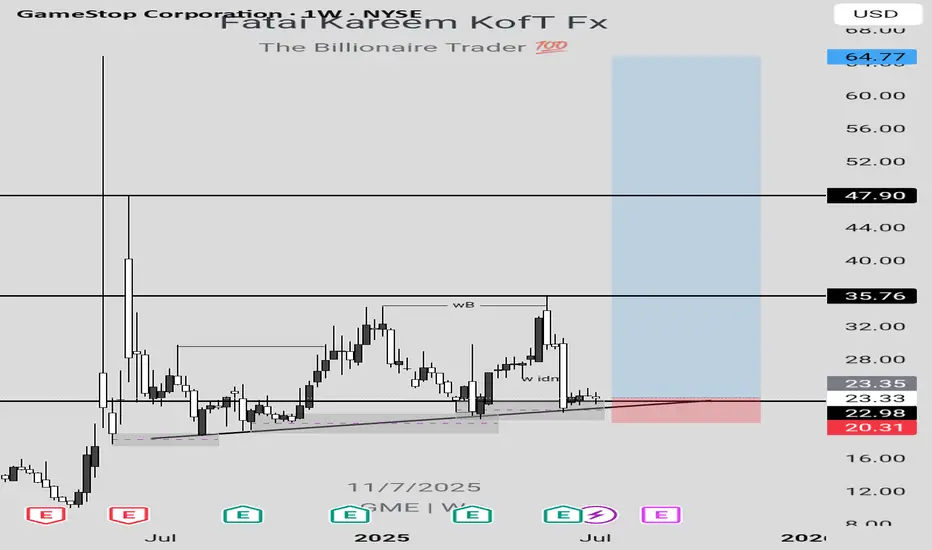
GME LONG IDEA UPDATEDIn my previous post regarding the long opportunity on GME stock, I called a long signal after a break out of a downtrend line. However, price had dropped down to the demand zone, giving another long opportunity.
To take advantage of this long opportunity, you can buy at the current market price, while the exit will be at $20.30 and the targets can be at $35.70, $47.90 and the final target at $64.70.
Confluences for the long idea are as follows:
1. Weekly break of structure
2. Valid Inducement
3. Orderflow
4. Price within the discount
5. Price respecting bullish trendline
6. Hammer candlestick confirmation
7. Price at a support level
Disclaimer: This is not a financial advice. The outcome maybe different from the projection. Don't take the signal if you're not willing to accept the risk.
BTCUSDT[BITCOIN]:Price is Likely to be Heading Towards $144,000.Recently, Bitcoin has shown extreme bullish price behaviour, and there’s no sign of bearish influence in the market. After monitoring the price since May 4th, we believe there’s a high possibility of price hitting the 120k region first. This could be followed by a small correction around 105k, where a strong bullish price influence will lead the price to our final target at 140k. Both fundamental and technical factors support this view, but it doesn’t guarantee the price will follow our expectations.
Before investing or trading cryptocurrencies, do your own research as they carry significant financial risk. This chart analysis is for educational or secondary purposes only.
Good luck and trade safely.
If you want to support and encourage us, you can do the following: ❤️
-Like the idea
-Comment the idea
-Share ;)
Team Setupsfx_

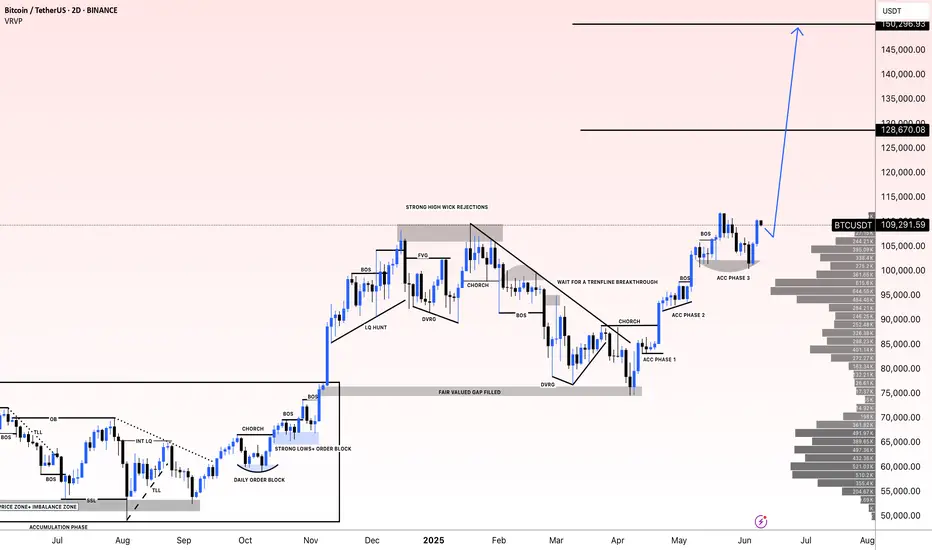
#BTCUSDT(BITCOIN): Two Targets First $130,000 And Then $150,000Bitcoin is poised for significant distribution, with a potential price surge to $130,000, followed by a swing target of $150,000. The current accumulation phase is poised to transition into a substantial bullish move. We anticipate a surge in bullish volume in the coming days or weeks. Our analysis anticipates this transition to be completed by the end of the year or sooner.
It is important to note that this analysis does not guarantee a specific price movement and is provided solely for educational purposes.
We extend our best wishes for your successful trading endeavours. If our analysis has been of assistance, we would appreciate it if you could express your gratitude by liking and commenting.
For further insights, please follow our account.
Team Setupsfx_
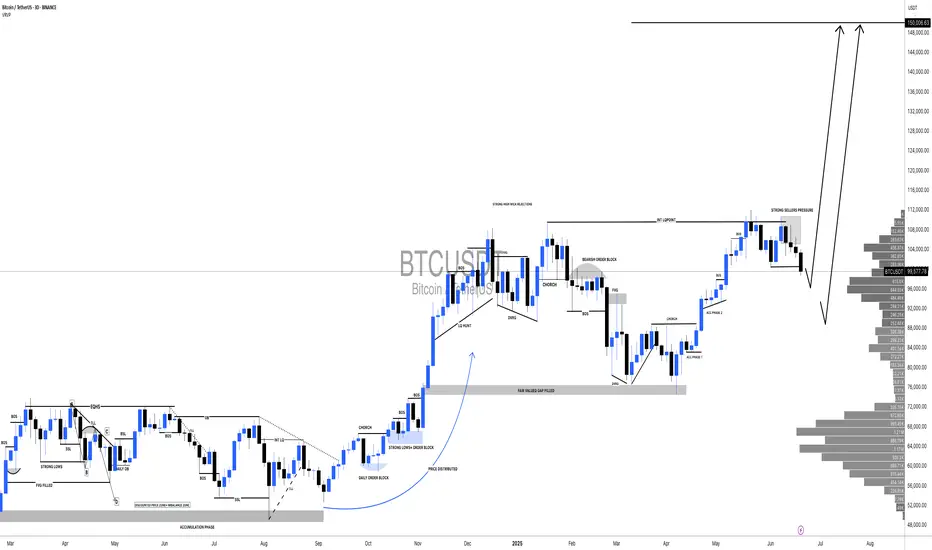
#BTCUSDT: Major Bearish Correction?Bitcoin is currently undergoing a correction following its recent peak. While the initial price decline appeared insignificant, it has since experienced a substantial drop, suggesting a substantial volume of selling activity in the market.
We anticipate two potential areas where the price could reverse and resume its upward trajectory. These areas could lead to a price of 110,000, followed by 120,000, and ultimately reaching 150,000.
We strongly recommend that you implement rigorous risk management measures and conduct your own analysis before making any investment decisions.
Best regards,
Team Setupsfx_
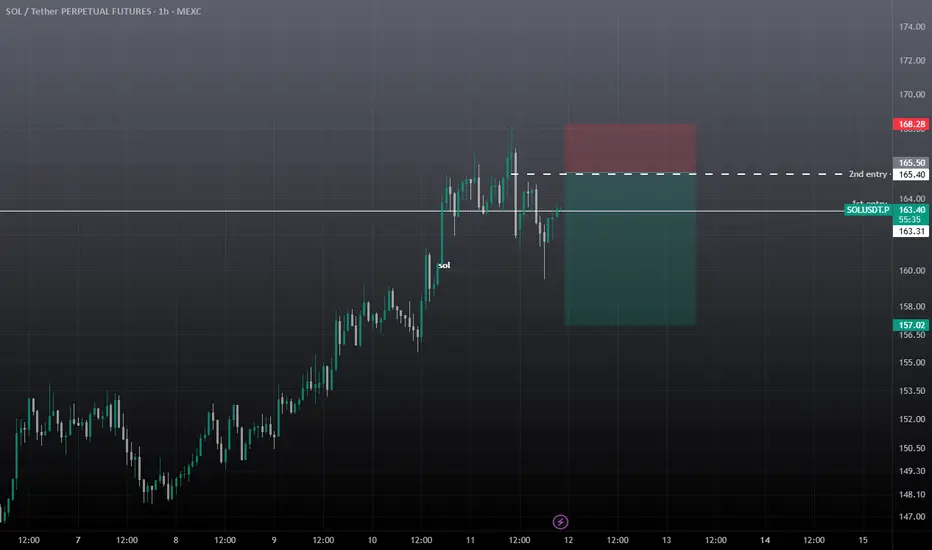
SOL Sell / Short SetupSell at cmp 163.49, 2nd entry mentioned and tp also mentioned, Must keep SL, best of luck.
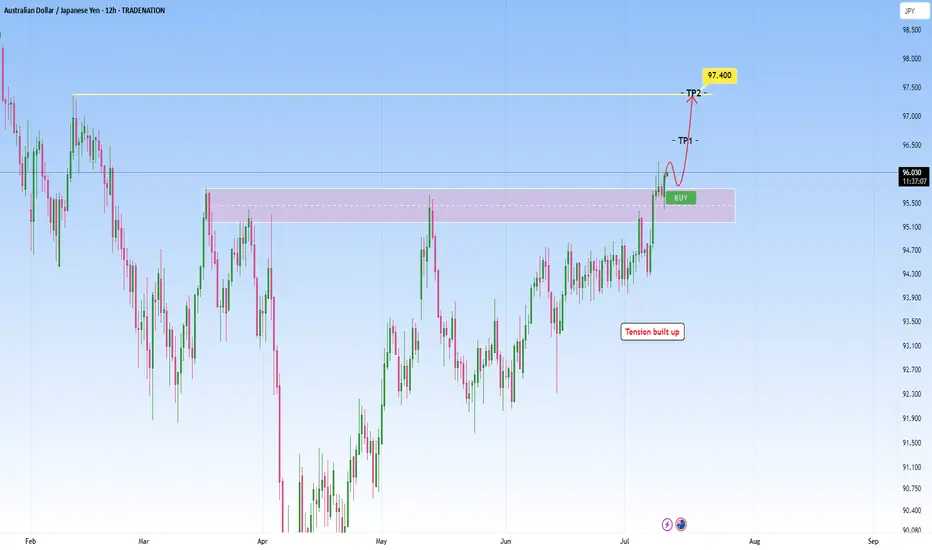
AUDJPY Technical Breakout - Targeting 97.400 Next?TRADENATION:AUDJPY has recently broken decisively above a key resistance zone that had previously capped price for several months. This breakout was preceded by a period of compression and range-bound price action, where bullish momentum steadily built up, indicated by higher lows pressing against the resistance level. This type of structure typically leads to an explosive breakout, which we are now seeing unfold.
After the breakout, price came back for a clean retest of the broken resistance zone, which has now flipped into support. The retest held firmly, suggesting strong buyer interest at this level and confirming the validity of the breakout.
With this structure in place, the bullish momentum is likely to extend further toward the next target zone around 97.400, provided price remains above the current support.
As long as the price holds above the retested zone, the bullish outlook remains intact. A breakdown back below this area, however, would be a warning sign and could open the door to a deeper pullback.
Remember, always wait for confirmation before entering trades, and maintain disciplined risk management.
Dow Jones Potential DownsidesHey Traders, in the coming week we are monitoring US30 for a selling opportunity around 44,270 zone, US30 is trading in an uptrend and currently seems to be attempting to break it down, if we get dips below the trend we will be looking for a potential retrace towards further downsides.
Trade safe, Joe.

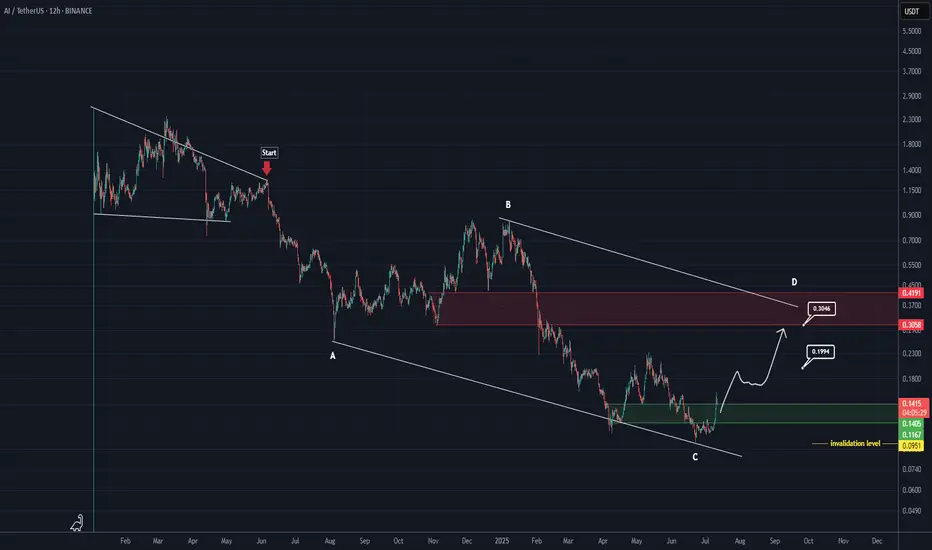
AI Looks Bullish (12H)The AI correction has started from the point marked as "start" on the chart.
It seems that wave C has completed, as its time cycle has finished and the price has reclaimed key levels.
As long as the green zone holds, the price can move toward the targets and the red box.
The targets are marked on the chart.
A daily candle closing below the invalidation level will invalidate this analysis.
For risk management, please don't forget stop loss and capital management
Comment if you have any questions
Thank You
ASTERDM - classic VCP retest - My Pick - No AdviceASTERDM exhibited 3 shrinking pullbacks on its daily with increasingly narrow ranges and diminishing volume followed by a strong upside break. Post-breakout, the ideal setup is a retest: price pulls back to the breakout level (pivot), holding above it.
Fundamentally, Aster DM is a solid healthcare growth story: strong expansion, low debt, cash-rich, with robust ROCE/ROE. But valuation is rich, and earnings are skewed by non-core income.
Technically, VCP setup looks promising—good base, breakout, and retest in place.

PNB Housing Finance - My Pick - No advice.Robust fundamentals indicate solid upside potential. If you believe in growth in the housing finance space, this could represent a strategic buy with a medium‑term horizon. Stock undercut 50 Day moving average and closed above it. it also undercut last several days low and close above it, showing lack of selling interest. A good close with good volume above PDH will tiggger my entry. These are my views and no advice to buy.

SP500 TECHNICAL ANALYSIS 30 MINUTE TIME FRAME 📊 Technical Analysis – SP500 CFD (30-Minute Chart)
✅ 1. Overall Market Trend:
The market is currently in a range-bound structure after a sharp upward move toward the 6,296 level.
Price entered a clear supply zone and reversed sharply.
Multiple BOS (Break of Structure) and CHoCH (Change of Character) events indicate clear shifts in price behavior.
📌 2. Key Structure Zones:
🟩 Demand Zones:
6,240–6,250: First active demand zone — could trigger bullish reactions.
6,180–6,200: Deeper liquidity zone within the Discount area, ideal for long setups if tested.
Price is approaching equilibrium and preparing for a potential reaction.
🟥 Supply Zones:
6,290–6,300: This premium zone caused the recent rejection and is currently acting as short-term resistance.
📈 3. Price Action & Candles:
Price created a rising wedge near the highs, which broke down.
Strong bearish candles followed, breaking key short-term structure levels.
Price is now heading into the equilibrium zone and testing demand.
📌 4. Possible Scenarios:
🔻 If Price Falls:
Watch for a reaction at the 6,240–6,250 demand zone.
If this area breaks, the next downside target is 6,180–6,200 — a high-probability liquidity zone.
🔺 If Price Rebounds:
A bullish reaction from the current zone could send price back toward 6,270+.
A confirmed break of 6,296 would open the door to higher highs.
🧠 Summary Table:
Condition Analysis
Current Status In corrective phase after bullish impulse
Short-Term Trend Bearish structure active (BOS, CHoCH present)
Key Support 6,245 → 6,180
Key Resistance 6,290–6,300
Buy Opportunity Bullish confirmation at demand zones
Sell Opportunity Weak reactions or breakdowns below BOS
⚠️ Disclaimer:
This analysis is for educational purposes only and does not constitute financial advice or a buy/sell signal.
Always trade based on your personal strategy and risk management plan.
VANTAGE:SP500

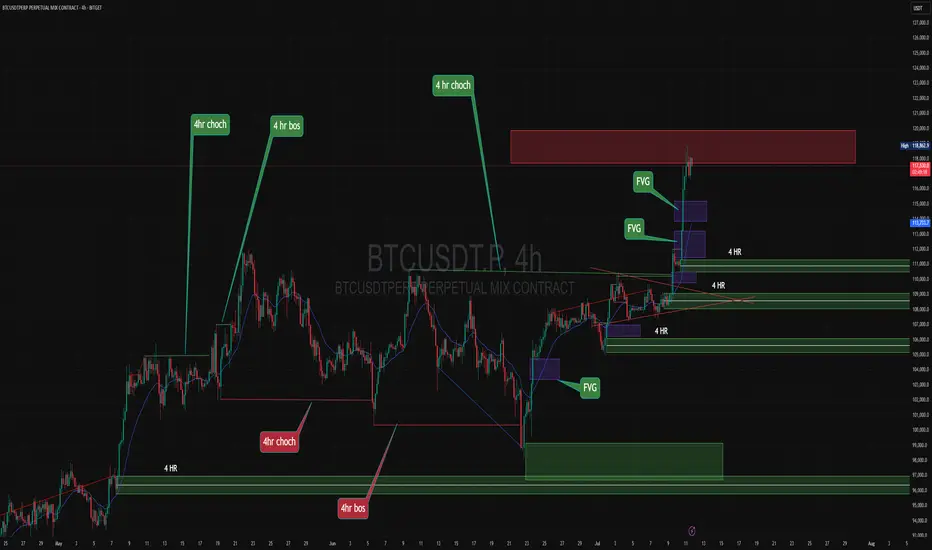
BTC 4 HR TIME FRAME ANALYSIS 4H Technical Analysis – BTCUSDT.P (Bitcoin Perpetual on Bitget)
✅ 1. Trend Overview:
Current Market Phase: Strong uptrend.
Price has broken multiple H4 BOS (Break of Structure) levels with strong bullish momentum.
The last impulse candle shows a vertical breakout, often a sign of aggressive buyers or FOMO.
🔄 2. Key Structure Zones:
🔵 Demand Zones (Highlighted in Green):
Around 113,700–114,000 → fresh demand zone after last breakout.
Around 108,000–110,000 → mid-level zone from earlier accumulation.
Deeper zone at ~96,000–98,000 → higher timeframe demand (may hold if larger correction happens).
🔴 Supply Zones (No immediate supply shown, but...)
Watch for reaction zones around 118,000–120,000 as psychological resistance.
📍 3. Price Action & Structure:
The current move is parabolic, indicating momentum exhaustion may soon follow.
However, the last CHoCH and BOS signals are clearly bullish, and pullbacks are being aggressively bought.
Short-Term Expectation:
A correction or sideways consolidation may happen near 118,000–119,000.
Best scenario: price pulls back into the 113,700 zone, forming a bullish continuation setup.
🔍 4. Candlestick Patterns:
At the top, the last 2 candles are showing wicks, indicating possible early rejection or take-profit activity.
No confirmed reversal pattern yet (e.g., no bearish engulfing, pin bar, or evening star).
Wait for confirmation if considering a reversal trade.
📉 5. Risk Zones:
If price breaks below 113,700, then correction may deepen toward 110,000 or even 108,000.
Below 108,000 would invalidate the current short-term bullish structure and signal trend weakening.
📌 6. Key Levels to Watch:
Type Price Zone Notes
Resistance 118,500–120,000 Current high zone, psychological barrier
Demand Zone 1 113,700–114,000 Nearest fresh demand
Demand Zone 2 108,000–110,000 Mid support
HTF Demand ~96,000–98,000 Deep liquidity + structural demand
✅ Conclusion:
Market is in a strong bullish trend on the 4H chart.
Wait for a healthy pullback to demand zones before considering new longs.
Watch for bearish candlestick confirmation (like engulfing or M-structure) near highs for possible short-term reversals.
⚠️ Disclaimer:
This is not financial advice or a trading signal.
It's purely educational analysis.
Always trade based on your personal strategy and risk management. BITGET:BTCUSDT.P
NZDCAD Bullish 15 min ICT 15 minute Entry:
1. Sell - side liquidity swept.
2. BOS up onM15 confirm shift.
3. Entry from bullish OB or FVG after pullback.
4. SL below liquidity sweep.
5. TP internal high/TP2 premium zone.
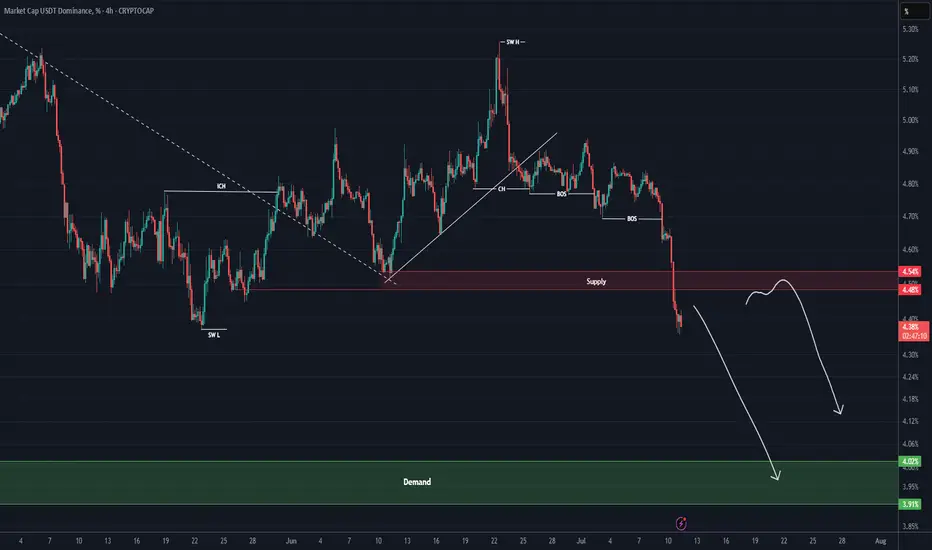
USDT Dominance Is Still Bearish (1D)This index is still bearish. It could either drop from here or turn bearish again after a pullback to a higher level.
The larger structure is bearish, and the price is breaking through structures in an attempt to reach the main demand zone. This bearish trend is expected to continue.
Let’s wait and see what happens.
For risk management, please don't forget stop loss and capital management
Comment if you have any questions
Thank You
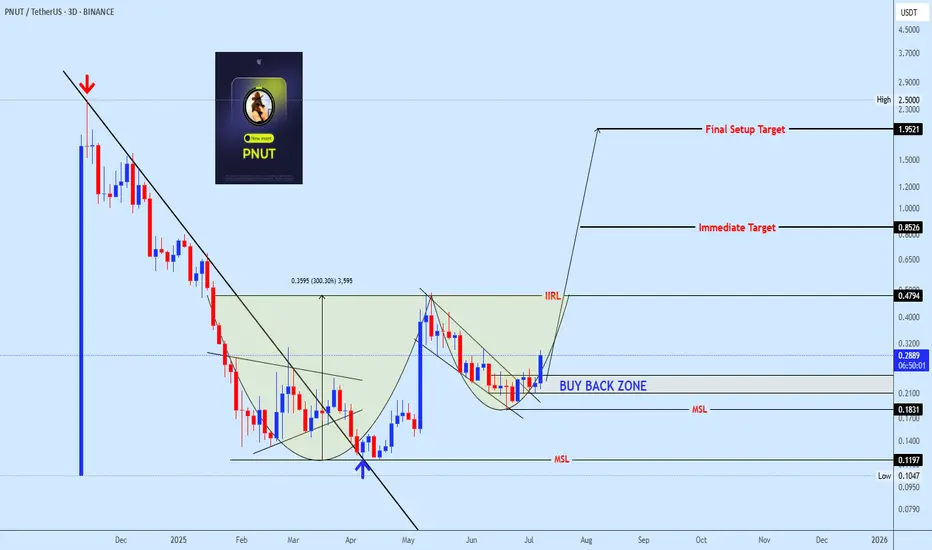
Pnutusdt buy opprotunityPNUTUSDT is showing a well defined bottoming structure, completing a rounded reversal formation. Price is currently building momentum within the buy-back zone, supported by a successful break of the mid-structure line (MSL). Continuation above the IIRL neckline could trigger the next impulsive leg toward the immediate target at 0.8526, with the final setup target projected at 1.9521. Holding above 0.1831 is critical for maintaining bullish structure.
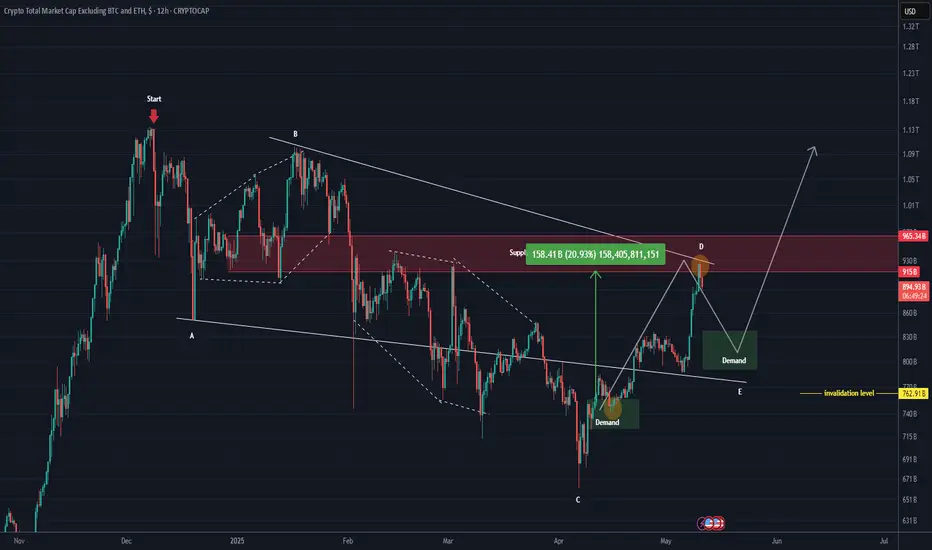
TOTAL 3 New Update (12H)This analysis is an update of the analysis you see in the "Related publications" section
TOTAL3 refers to the total crypto market cap excluding Bitcoin and Ethereum.
It pumped from the lower demand zone to the marked red box and has surged by 21%.
We now need a retracement to make the price more attractive.
If the invalidation level and the green zone hold, we could witness another bullish wave.
In this analysis, the invalidation level has been updated. A daily candle closing below this level will invalidate the setup.
Some altcoins are currently bullish, and each chart must be analyzed individually| so be cautious with your short positions.
For risk management, please don't forget stop loss and capital management
Comment if you have any questions
Thank You
THE KOG REPORT - UpdateEnd of day update from us here at KOG:
I can't say that was a bad day or week. We got the move from 3310 into our Excalibur target level 3332 and then started looking for a potential reversal. Gold, again, had other plans and just continued to activate Excalibur after Excalibur higher combined with the red box break and close, so all we could do as mentioned in the earlier post, is call it a week early.
For now, we have support at the 3350-45 level with resistance here at 3370. I don't think they will want to leave a wick on that 4H, so let's expect a potential retest of resistance.
The week in Camelot:
RED BOX TARGETS:
Break above 3350 for 3355✅, 3360✅, 3362✅, 3365✅, 3374, 3388 and 3396 in extension of the move
Break below 3335 for 3331✅, 3324✅, 3321✅, 3310✅, 3306✅ and 3293✅ in extension of the move
Wising you all a great weekend,
As always, trade safe.
KOG

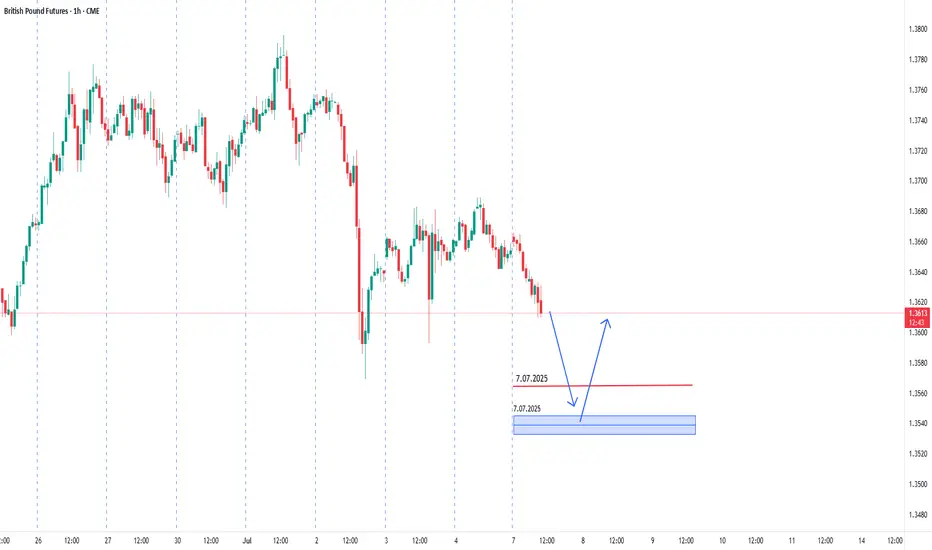
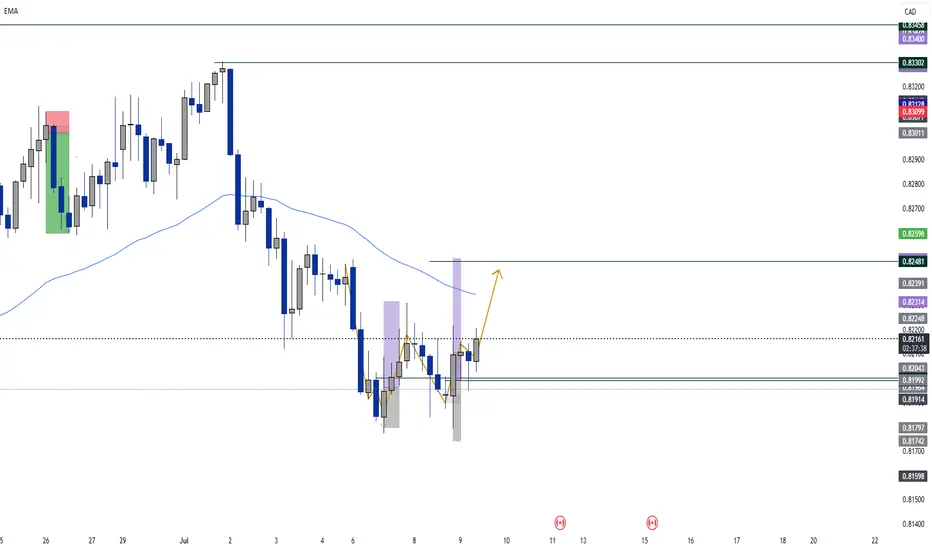
GBPUSD. The plan for the next few days.The nearest resistance zones are where it's interesting to look for purchases. We are waiting for a reaction and looking for an entry point.
The post will be adjusted if there are any changes.
Don't forget to click on the Rocket! =)