HUB24 Ltd Quote | Chart & Forecast SummaryKey Indicators On Trade Set Up In General
1. Push Set Up
2. Range Set Up
3. Break & Retest Set Up
Notes On Session
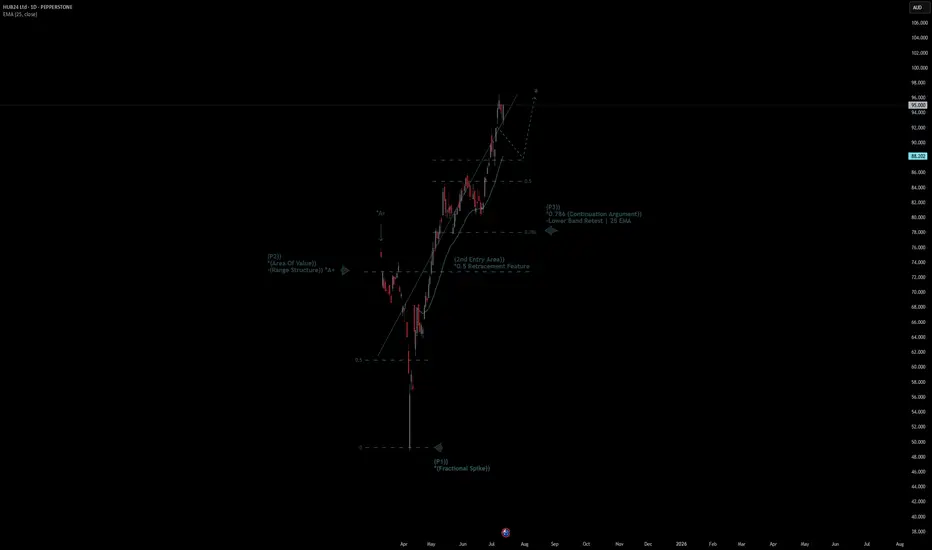
# HUB24 Ltd Quote
- Double Formation
* (Area Of Value)) - (Range Structure)) *A+ | Completed Survey
* (2nd Entry Area)) - *0.5 Retracement Feature | Subdivision 1
- Triple Formation
* (P1)) / (P2)) & (P3)) | Subdivision 2
* (TP1) = a / Long Consecutive Range
* (TP2) = b / Short Consecutive Pullback | Subdivision 3
* Daily Time Frame | Trend Settings Condition
- (Hypothesis On Entry Bias)) | Indexed To 100
- Position On A 1.5RR
* Stop Loss At 120.00 AUD
* Entry At 126.00 AUD
* Take Profit At 133.00 AUD
* (Uptrend Argument)) & No Pattern Confirmation
- Continuation Pattern | Not Valid
- Reversal Pattern | Not Valid
* Ongoing Entry & (Neutral Area))
Active Sessions On Relevant Range & Elemented Probabilities;
European-Session(Upwards) - East Coast-Session(Downwards) - Asian-Session(Ranging)
Conclusion | Trade Plan Execution & Risk Management On Demand;
Overall Consensus | Buy
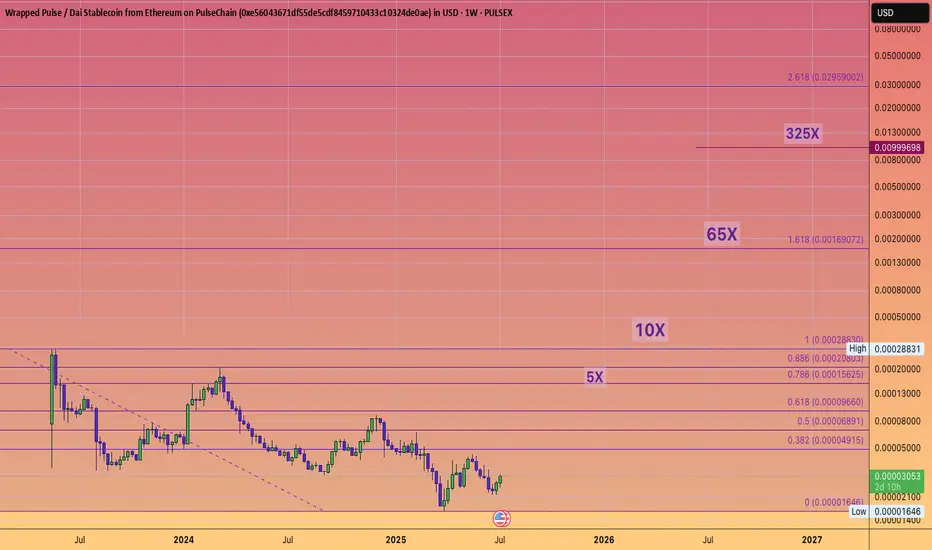
Supply and Demand
If Pulsechain reaches a penny, it would = a 325XOr around $165 billion in user-based valuation, excluding the significant portion of coins held by the founder.
It's certainly a long shot, and it would probably depend on Ethereum's price reaching well into the teens
(which, as you know, I strongly support).
Thus, it is definitely within the realm of possibility considering the low initial user base and the potential influx of individuals who will join EVMs in the upcoming years.
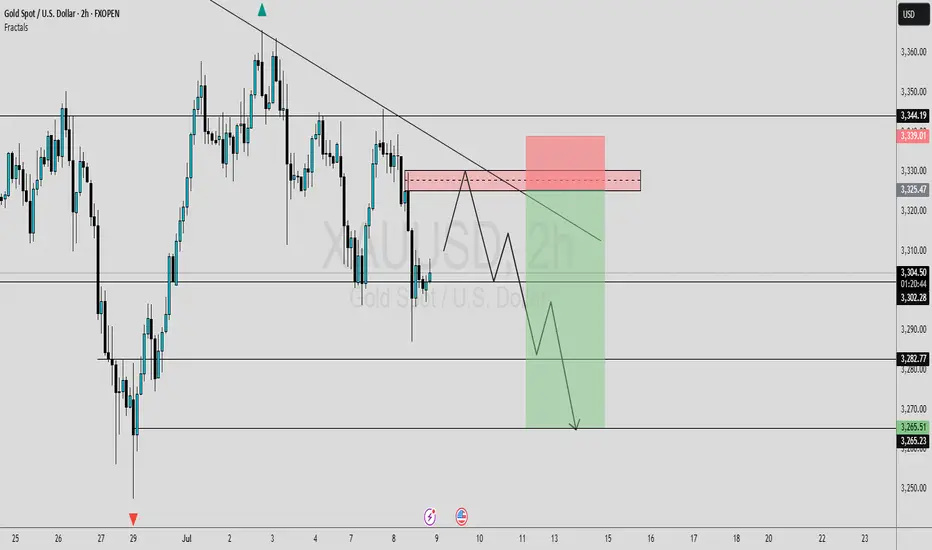
#GOLD UPDATESIn this analysis we're focusing on 2H timeframe for finding the upcoming changes in gold price.
Here we can see clearly that gold price creates trendline resistance and also price sweep all the SSL and pre. daily LQ sweep. Now I'm waiting for retracement, If price retest my supply zone and give bearish sign or reversal confirmation than we'll execute our trades. This is a higher time frame outlook. Further analyze more deeply into smaller time frame and place our position from an perfect point.
Always use stoploss for your trade.
Always use proper money management and proper risk to reward ratio.
Keep an eye on these levels. Confirmation is key.
#XAUUSD 2H Technical Analysis Expected Move.
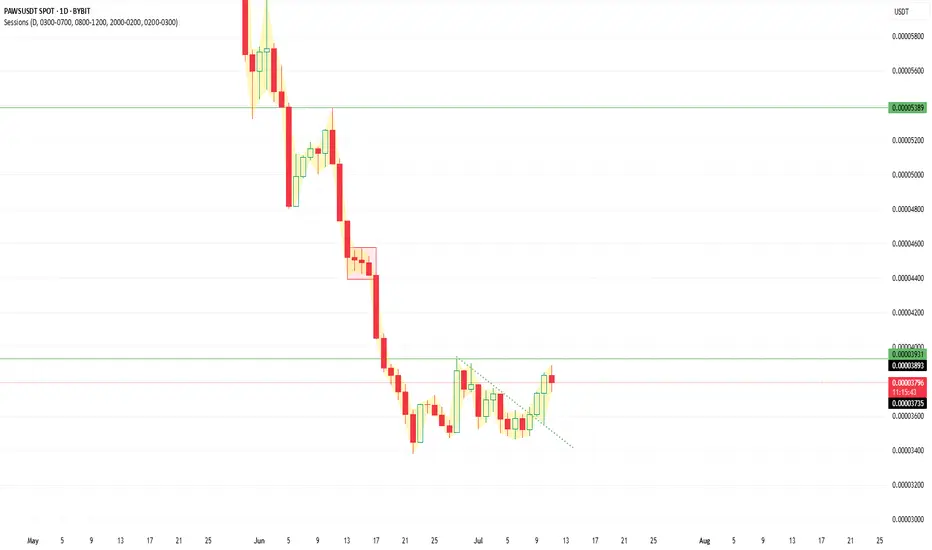
PWAS/USDT BIG PUPMPBreak down trend in daily time frame & now probably Big pump for Paws this bad shit coin is coming!
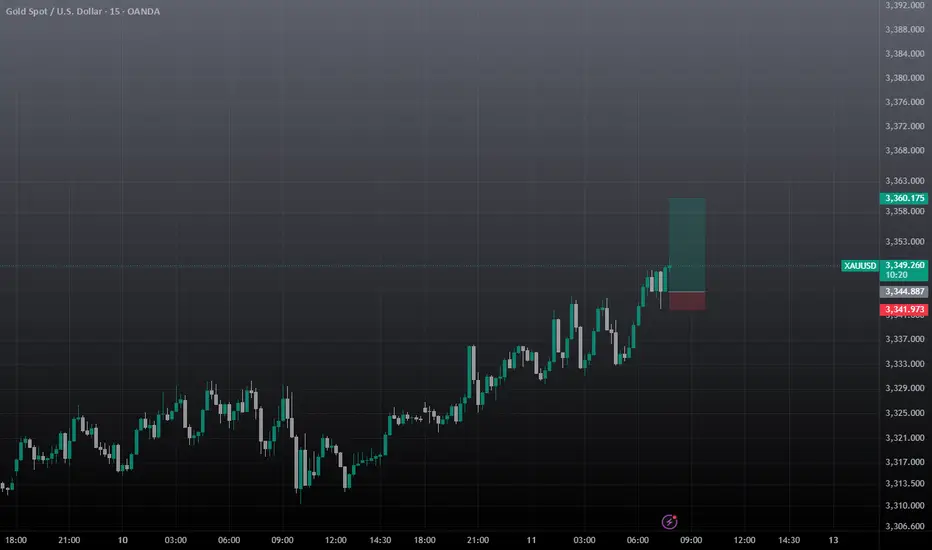
XAUUSD SCALP TRADEentry based on 5m tf, so wait for the entry and take it, must use sl, you can take 1st entry at cmp, 3348.5 2nd at mentioned and set the target and forget.
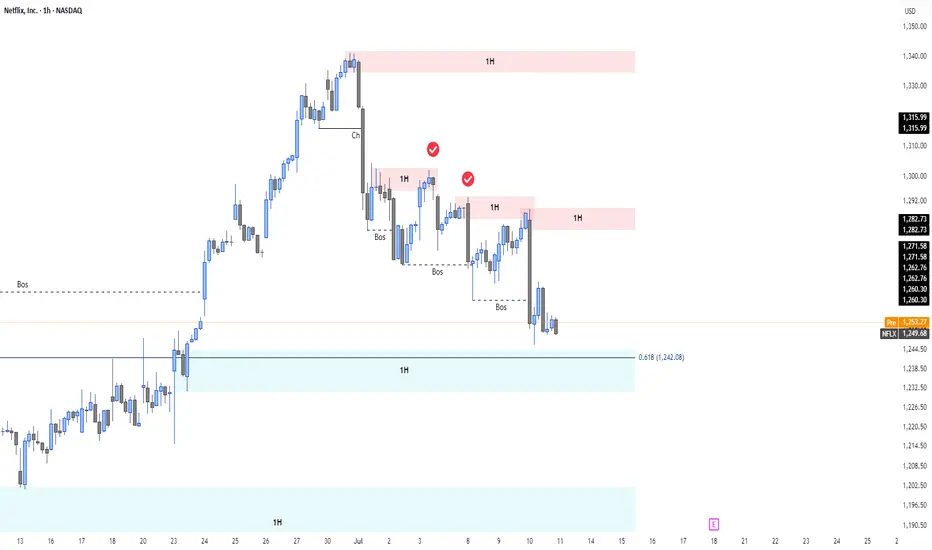
NFLX Bear Call Spread Near Max Profit – Watching 61.8% Fib Zone📉 I'm currently holding a Bear Call Spread 1300/1280 expiring on Jul 18. After multiple Breaks of Structure (BOS) and strong rejection from 1300, price is trending toward a key 1H demand zone near the 61.8% Fibonacci retracement (1242).
📊 Technical Context:
Bearish CHoCH + BOS confirms short-term trend reversal
Clear rejection from 1280–1300 supply
1242 = strong confluence: Fib + demand zone
🎯 Plan:
Hold the spread close to expiration for max profit
Close before earnings on Jul 17 to avoid volatility
If price shows strength at 1242, I may flip bias and look for a bull call spread post-earnings
🔔 TradingView Alerts:
1242: “Watch for bullish reaction at demand zone”
1278: “Rebound in progress – reassess post-earnings”
📌 This is a two-stage plan: secure gains on the short side, then prepare for potential upside.
➡️ Follow me for more structured trade ideas based on price action, options, and macro timing.
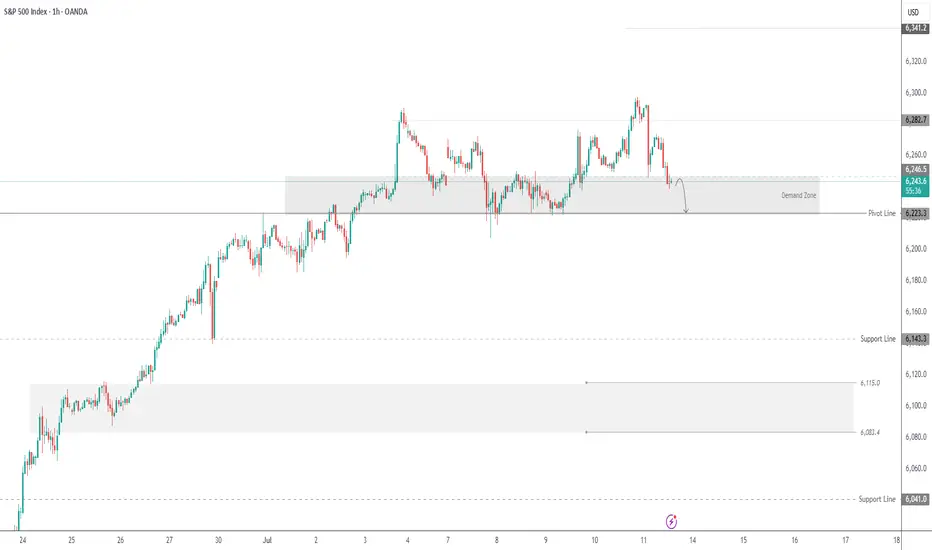
SPX500 Bearish Below 6246 – Eyes 6223 and 6195SPX500 Analysis
SPX500 stays under bearish pressure below 6246, targeting 6223 and possibly 6195 if the decline continues.
Recent tariff escalation by President Trump is adding weight to downside momentum across indices.
Pivot: 6246
Support: 6223, 6195, 6143
Resistance: 6268, 6291
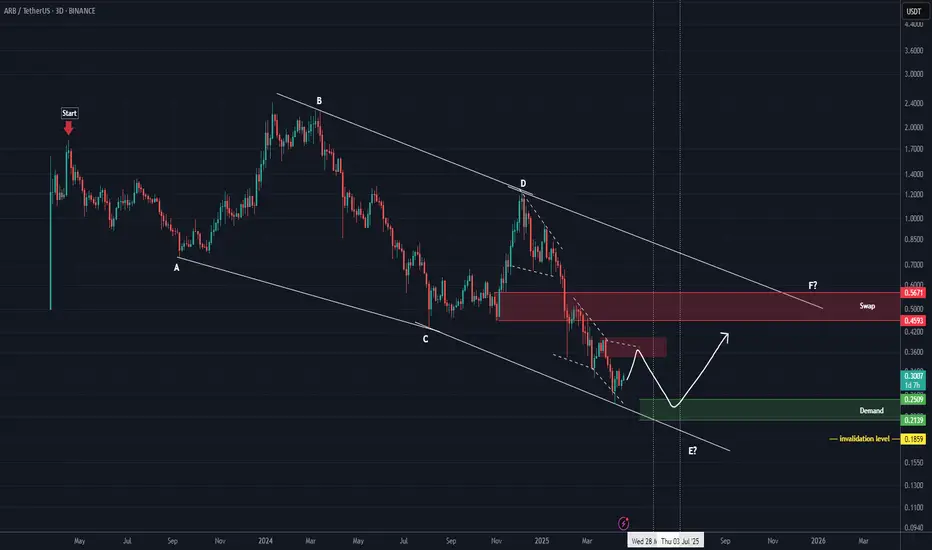
ARB New Analysis (3D)Before anything else, pay attention to the timeframe | it's a higher timeframe and will take time.
The higher timeframe structure of ARB is honestly not that bullish. In this scenario, we’ve considered the entire correction | starting from where the red arrow is placed on the chart | as a diametric/symmetrical pattern.
From a time perspective, wave E has not yet completed, and it is expected to finish somewhere between the two vertical lines. Wave E here is a bearish wave.
If the price pulls back and reaches the green box, we can look for a buy setup in that area.
A 3-day candle closing below the invalidation level will invalidate this analysis.
For risk management, please don't forget stop loss and capital management
When we reach the first target, save some profit and then change the stop to entry
Comment if you have any questions
Thank You
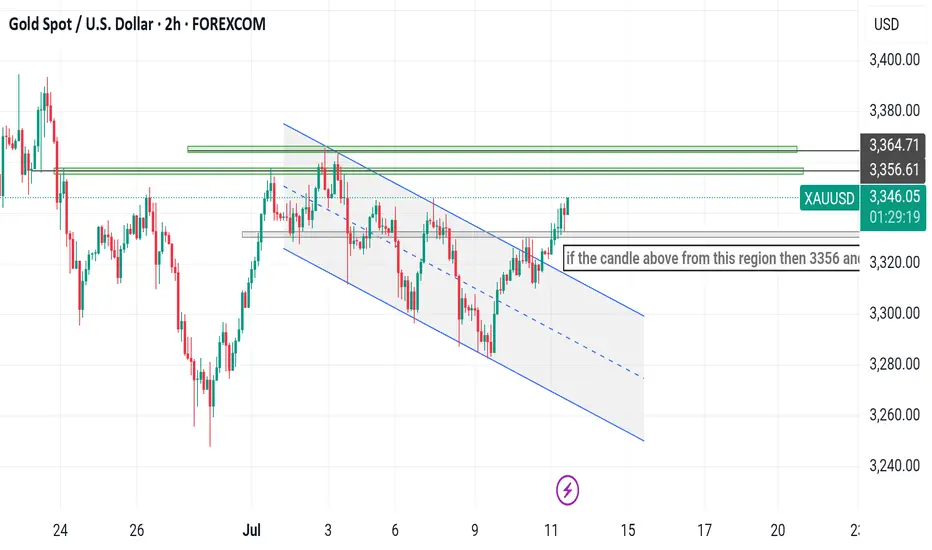
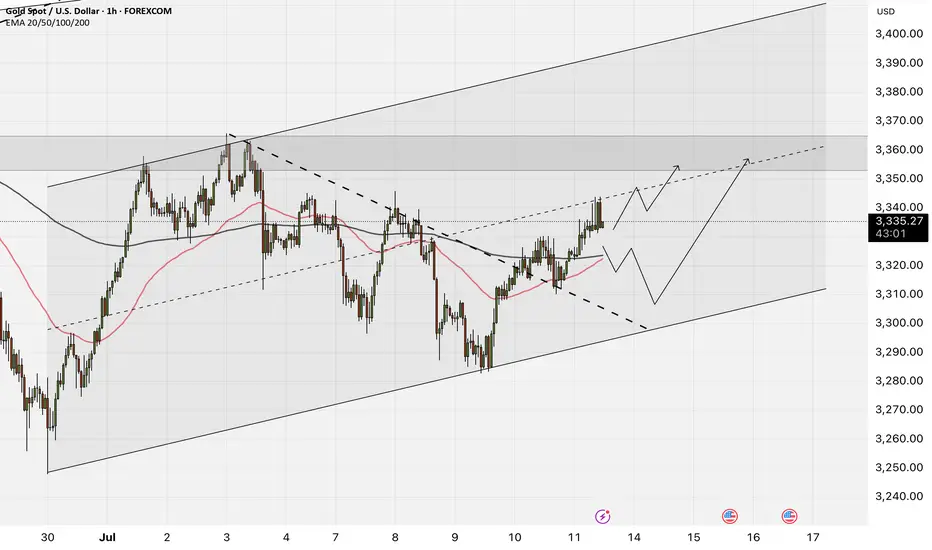
Gold Update H2 Timeframe XAUUSD GOLD Update H2 Timeframe 🙌
- This Analysis is based on educational purposes using Technical aspect ❗️
- According to our Parallel Channel market break that trendy waves and we are looking and waiting for this setup
- The region and text indicates if candle above this region we were looking for bullish opportunities and our milestone will be at 3356 - 3364.00 which is acting as a Strong Resistance levels ❗️
Although candles below 3335 - 3330 will lead us to 3310 - 3300.00
Bearish Opportunities from 3356 - 3364.00 we will wait for our Price and then we will react as a long holding positions 📈
All you need to stick with one Mentor 👋
#XAUUSD
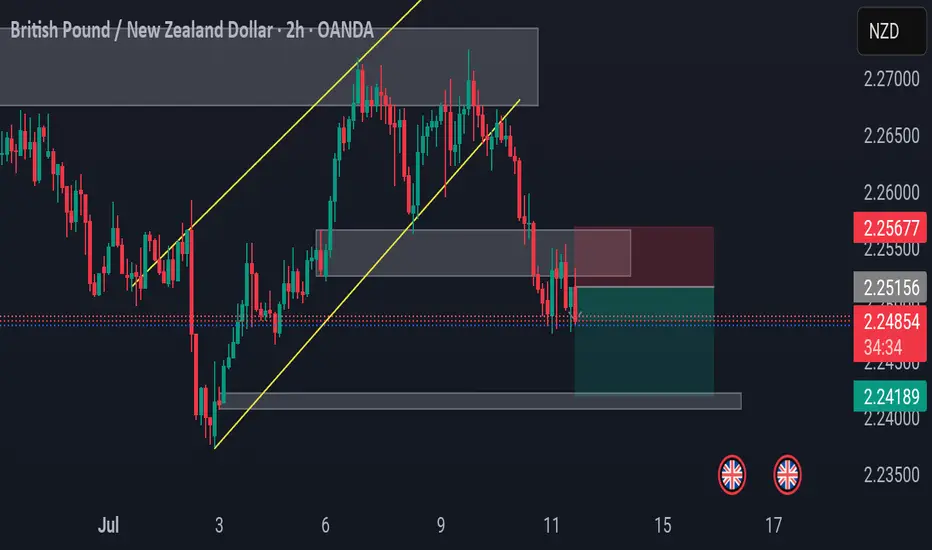
GBP/NZD – Bearish Continuation Setup in Play
🔹 2H Chart Analysis by PULSETRADESFX
The recent structure break on GBP/NZD confirms bearish momentum, with price decisively rejecting the prior bullish channel (marked in yellow). After retesting the broken support zone (now acting as resistance), a clean supply zone formed around 2.25156 – 2.25677, where price has started to stall.
📌 Trade Setup:
Entry: 2.24902
SL: 2.25677 (Above supply)
TP: 2.24189 (Next demand zone)
This aligns with the overall trend shift as buyers failed to hold the previous structure. Expecting further downside toward the next demand zone unless bulls reclaim above 2.25677 with strong momentum.
---
✅ Confluence Highlights:
Break and retest of bullish channel
Supply zone confirmation
Bearish engulfing structure at resistance
Favorable risk-to-reward setup
📅 July 11, 2025
📊 Executed on: TradingView | OANDA Feed
#GBPNZD #Forex #PriceAction #SupplyDemand #BearishSetup #TradingView
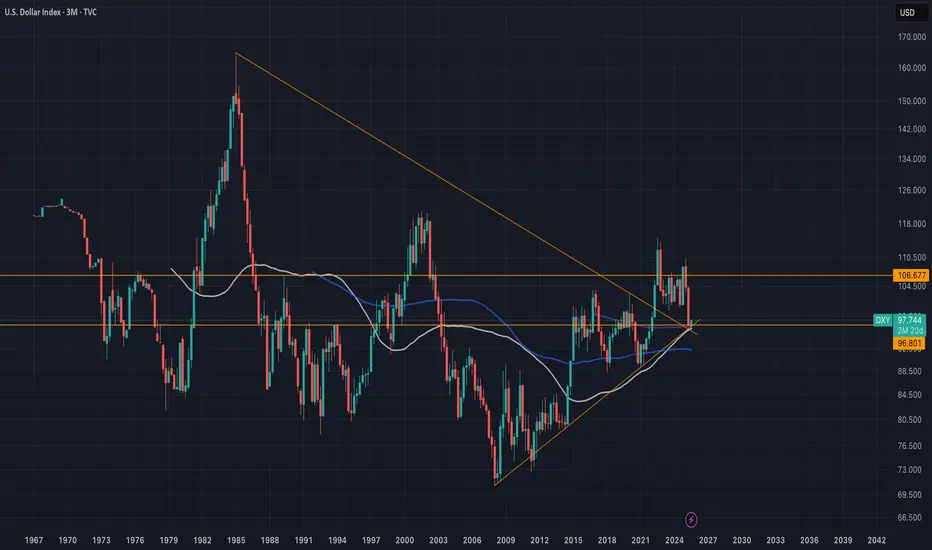
DXY (USD Basket) - 3 Month - Short Squeeze In Play?Technicals:
The last 3-month candle closed above the major resistance that tends to hold according to historic levels going back to the year 1967.
Golden Cross is almost complete (50 MA crossing the 200 MA).
Fundamentals:
The dollar has only been more shorted once in history (2018), setting things up for a potential "Short Squeeze" and triggering a "Risk Off" scenario. Tends to hurt risk assets quite hard—for example, tech stocks, crypto, and other leverage plays.
A rise in the DXY could potentially trigger a "Short Squeeze" for foreign countries, companies, and investors that borrow in USD, creating "economic panic" in other countries that get their currency devalued relative to their obligations.
Countries that need USD to service their debt. With the current tariffs, the flow of dollars in the world will change. The question is: what will the effect look like in August when these tariffs start to go live? Like I mentioned before, other countries need the dollars in order to service their debt. If it gets more expensive for US consumers to import (caused by the tariffs), the exporting countries won’t get those dollars—setting it up for a buying cycle that could potentially drive the USD (DXY) higher, even to all-time highs.
Current narrative:
The narrative right now is that the USD will get "worthless," setting the stage to take more risk and use more leverage, maybe without even hedging. A surprise variable to this narrative could be devastating to the financial markets—not just in the US, but even to the world. IF/When this happens, everyone will hunt the USD once again, creating a new bullish narrative for the USD, and everyone will be forced to return to the reserve currency.
Nothing in this post should be considered financial advice. Always do your own research and analysis before investing.
Nifty levels - Jul 14, 2025Nifty support and resistance levels are valuable tools for making informed trading decisions, specifically when combined with the analysis of 5-minute timeframe candlesticks and VWAP. By closely monitoring these levels and observing the price movements within this timeframe, traders can enhance the accuracy of their entry and exit points. It is important to bear in mind that support and resistance levels are not fixed, and they can change over time as market conditions evolve.
The dashed lines on the chart indicate the reaction levels, serving as additional points of significance to consider. Furthermore, take note of the response at the levels of the High, Low, and Close values from the day prior.
We hope you find this information beneficial in your trading endeavors.
* If you found the idea appealing, kindly tap the Boost icon located below the chart. We encourage you to share your thoughts and comments regarding it.
Wishing you success in your trading activities!

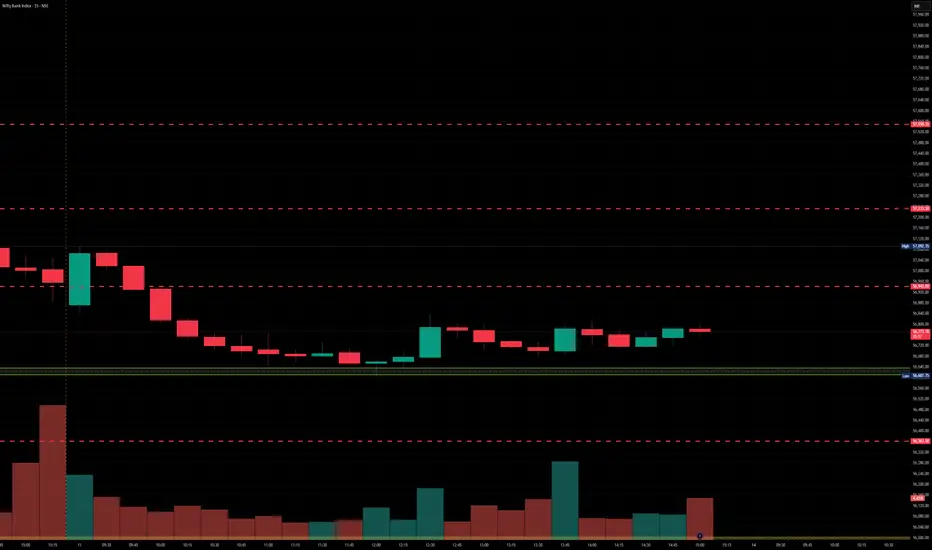
BankNifty levels - Jul 14, 2025Utilizing the support and resistance levels of BankNifty, along with the 5-minute timeframe candlesticks and VWAP, can enhance the precision of trade entries and exits on or near these levels. It is crucial to recognize that these levels are not static, and they undergo alterations as market dynamics evolve.
The dashed lines on the chart indicate the reaction levels, serving as additional points of significance. Furthermore, take note of the response at the levels of the High, Low, and Close values from the day prior.
We trust that this information proves valuable to you.
* If you found the idea appealing, kindly tap the Boost icon located below the chart. We encourage you to share your thoughts and comments regarding it.
Wishing you successful trading endeavors!
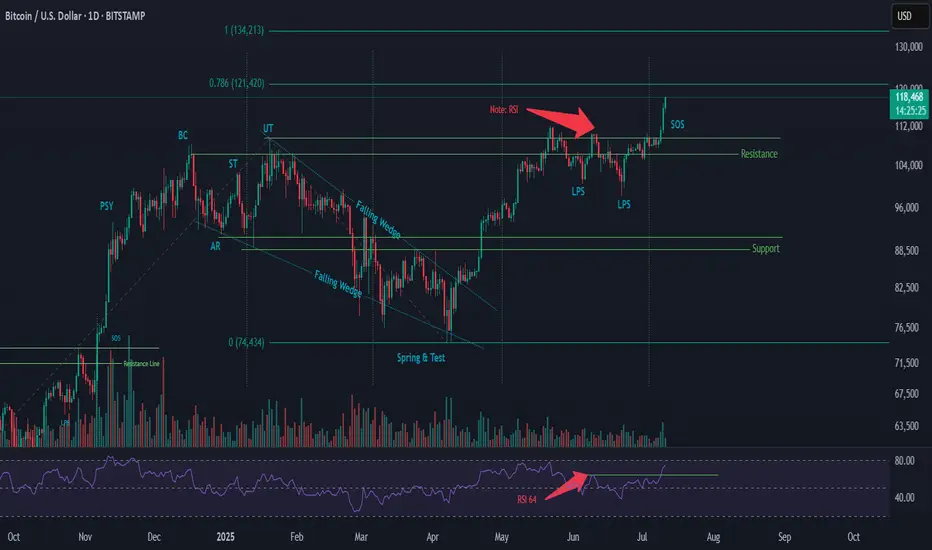
Wyckoff Re-Accumulation (Phase 2) – BTC Market Structure AnalysiThis is an updated outlook on BTC’s current price structure based on Wyckoff methodology.
🔹 Structure Overview:
BTC has broken out above its previous resistance and reached a new ATH. Based on current price action and volume behavior, I believe we are at the Sign of Strength (SOS) phase in a Wyckoff Re-Accumulation Phase 2.
Key Wyckoff Labels in this structure:
PSY – Preliminary Supply
BC – Buying Climax
AR – Automatic Rally
ST – Secondary Test
UT – Upthrust
LPS – Last Point of Support
SOS – Sign of Strength
(For those unfamiliar with the terms, I suggest looking up the Wyckoff Method for detailed definitions.)
The breakout is happening with volume support, and we’ll need to observe how sustained the demand is.
🔹 RSI Observation:
In June, RSI pivoted at 64, and has now reached 73
Both price and RSI are printing higher highs
Daily RSI has not yet reached overbought territory (80+)
If RSI crosses above 80 and then rolls over, it could signal a bearish divergence → followed by a retracement
🔹 Possible Scenarios (3 Outcomes I’m Watching):
📈 Another Re-Accumulation Phase forms after this move
🧊 Market tops out at ATH and enters a Distribution Phase
🚀 A parabolic move (Blow-off Top) happens, followed by a sharp crash and Distribution
🔹 My Personal Trading Plan:
As price enters the next phase, I’ll be watching closely for signs of PSY and BC (Preliminary Supply & Buying Climax). If bearish divergence aligns with these, it may indicate an upcoming retracement.
Once BC forms, I expect an AR (Automatic Reaction) to follow
I’ll look for short entries during the retracement
A Trading Range could form between the BC (resistance) and AR (support)
⚠️ Be cautious of fakeouts, especially during breakout attempts at the range boundaries.
🔹 Price Projection (Fibonacci Extension – For Reference Only):
Using Fibonacci Extension based on the following price coordinates:
Point A: 49,577
Point B: 109,356
Point C: 74,434
🎯 Target Zones:
0.786 extension → 121,420
1.000 extension → 134,213
Again, these are not predictions — just reference points based on market structure.
🔹 Final Note:
This analysis reflects my personal interpretation of the current market structure. Price action can change rapidly based on macro and technical factors. Patterns and phase transitions may take days or even weeks to fully develop.
Feel free to share your thoughts, criticisms, or alternate views — I’m open to feedback from fellow traders.
#Wyckoff #BTC #Bitcoin #CryptoTA #Reaccumulation #TradingPlan #TechnicalAnalysis #RSI #FibExtension #MarketStructure
XAUUSD - Will Gold Continue Its Rise?!Gold is trading above the EMA200 and EMA50 on the hourly chart and is trading in its ascending channel. We still have a bullish view on this commodity and we can expect to see $3,350. A correction towards the bottom of the ascending channel will also provide us with a better risk-reward buying opportunity.
According to the World Gold Council, physically backed gold ETFs attracted around $38 billion in investments during the first half of 2025. This marks the largest semi-annual inflow since the beginning of 2020. The remarkable surge is primarily attributed to heightened investor demand for safe-haven assets amid escalating economic and trade tensions triggered by President Trump’s tariff policies.
During this period, the total gold holdings of these funds grew by 397.1 tonnes, bringing their global assets to 3,615.9 tonnes by the end of June—the highest level since August 2022, although still below the all-time high of 3,915 tonnes recorded in October 2020.
U.S.-based funds led the inflows with an addition of 206.8 tonnes, while Asian funds—despite accounting for only 9% of total assets—captured 28% of global inflows, highlighting a significant rise in interest among Asian investors in gold.
This positive trend emerged after three consecutive years of outflows between 2021 and 2023, followed by modest inflows in 2024. Concurrently, gold prices have surged by 26%, reaching a record high of $3,500 per ounce in April.
The World Gold Council, established in 1987 and headquartered in London, is funded by major gold mining companies. Its main objectives include boosting global demand for gold, enhancing market accessibility, and promoting innovation within the gold industry. The council plays a crucial role in shaping global perceptions of gold as a financial asset.
However, some analysts argue that the council essentially functions as a powerful lobbying group for mining corporations, often releasing reports designed to bolster demand and foster a positive market sentiment toward gold.
On the other hand, Bank of America (BofA), in its latest report using a global trading time framework, analyzed the outlook for the U.S. dollar in the second half of 2025. Despite the dollar having its worst start to a year since 1973, the report suggests that selling pressures on the currency may ease going forward, particularly during U.S. trading hours.
U.S. Trading Hours and Federal Reserve Policy
The dollar’s cumulative performance during U.S. trading hours remains strongly correlated—at 71%—with Federal Reserve interest rate pricing. Given expectations for stable rates throughout the rest of the year, the dollar could find some support during this time frame.
Asia: The Main Driver of Dollar Selling in H1 2025
Asian investors were the largest sellers of the dollar during the first half of 2025. However, after fully unwinding the long positions accumulated over the past two years, dollar performance in Asian trading hours has now turned neutral. Fresh selling may remain limited unless new bearish catalysts emerge.
Europe: Tied to Global Equities’ Performance
Dollar weakness during European trading hours largely depends on the relative strength of global equities versus U.S. stocks. As U.S. equities reclaimed market leadership in the second quarter, European investors may have less incentive to continue selling dollars.
Decline in Currency Hedging Appetite
Following the dollar’s significant drop in the first half of the year, foreign investors are now less inclined to increase currency hedges on their dollar-denominated assets.
According to Bank of America’s trading time framework, the pace of the dollar’s decline is likely to slow in the second half of the year, especially during U.S. trading hours, as stable Federal Reserve policy removes a key bearish factor. Selling pressure from Asia is also expected to ease unless new downside triggers arise. The key variable going forward will be the relative performance of global equities versus U.S. markets.
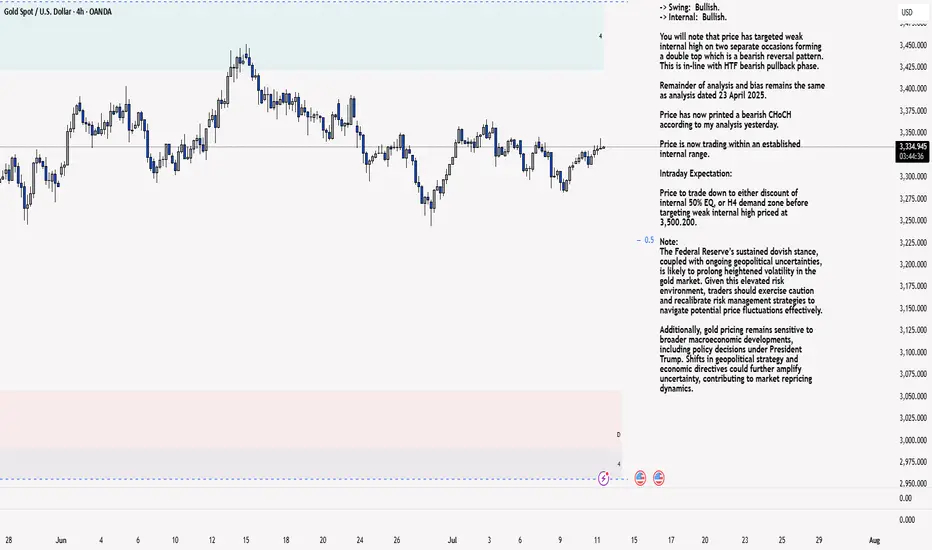
XAU/USD 11 June 2025 Intraday AnalysisH4 Analysis:
-> Swing: Bullish.
-> Internal: Bullish.
You will note that price has targeted weak internal high on two separate occasions forming a double top which is a bearish reversal pattern. This is in-line with HTF bearish pullback phase.
Remainder of analysis and bias remains the same as analysis dated 23 April 2025.
Price has now printed a bearish CHoCH according to my analysis yesterday.
Price is now trading within an established internal range.
Intraday Expectation:
Price to trade down to either discount of internal 50% EQ, or H4 demand zone before targeting weak internal high priced at 3,500.200.
Note:
The Federal Reserve’s sustained dovish stance, coupled with ongoing geopolitical uncertainties, is likely to prolong heightened volatility in the gold market. Given this elevated risk environment, traders should exercise caution and recalibrate risk management strategies to navigate potential price fluctuations effectively.
Additionally, gold pricing remains sensitive to broader macroeconomic developments, including policy decisions under President Trump. Shifts in geopolitical strategy and economic directives could further amplify uncertainty, contributing to market repricing dynamics.
H4 Chart:
M15 Analysis:
-> Swing: Bullish.
-> Internal: Bullish.
H4 Timeframe - Price has failed to target weak internal high, therefore, it would not be unrealistic if price printed a bearish iBOS.
The remainder of my analysis shall remain the same as analysis dated 13 June 2025, apart from target price.
As per my analysis dated 22 May 2025 whereby I mentioned price can be seen to be reacting at discount of 50% EQ on H4 timeframe, therefore, it is a viable alternative that price could potentially print a bullish iBOS on M15 timeframe despite internal structure being bearish.
Price has printed a bullish iBOS followed by a bearish CHoCH, which indicates, but does not confirm, bearish pullback phase initiation. I will however continue to monitor, with respect to depth of pullback.
Intraday Expectation:
Price to continue bearish, react at either M15 supply zone, or discount of 50% internal EQ before targeting weak internal high priced at 3,451.375.
Note:
Gold remains highly volatile amid the Federal Reserve's continued dovish stance, persistent and escalating geopolitical uncertainties. Traders should implement robust risk management strategies and remain vigilant, as price swings may become more pronounced in this elevated volatility environment.
Additionally, President Trump’s recent tariff announcements are expected to further amplify market turbulence, potentially triggering sharp price fluctuations and whipsaws.
M15 Chart: