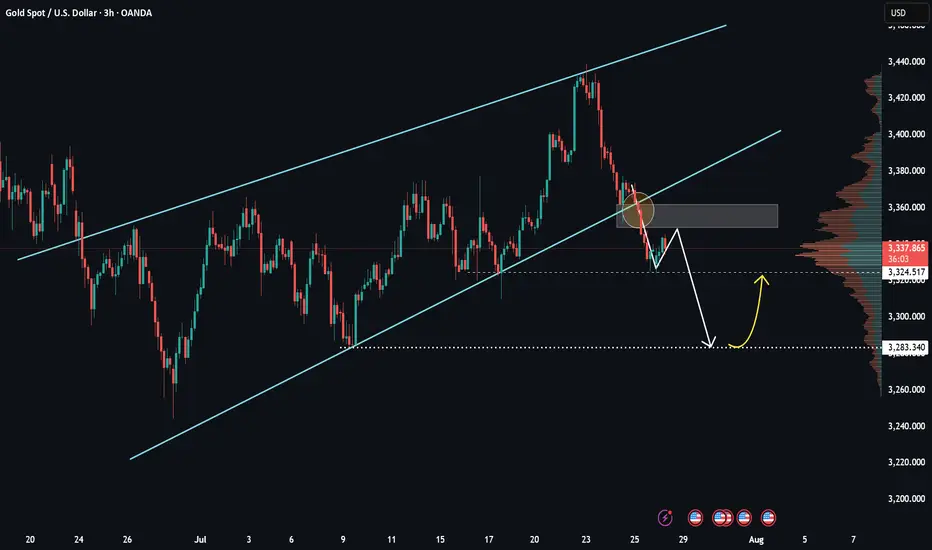
GOLD (XAUUSD) Short IdeaGold is in consolidation right now. Possible break below and fall until 3285.
Good Luck!
Supply and Demand
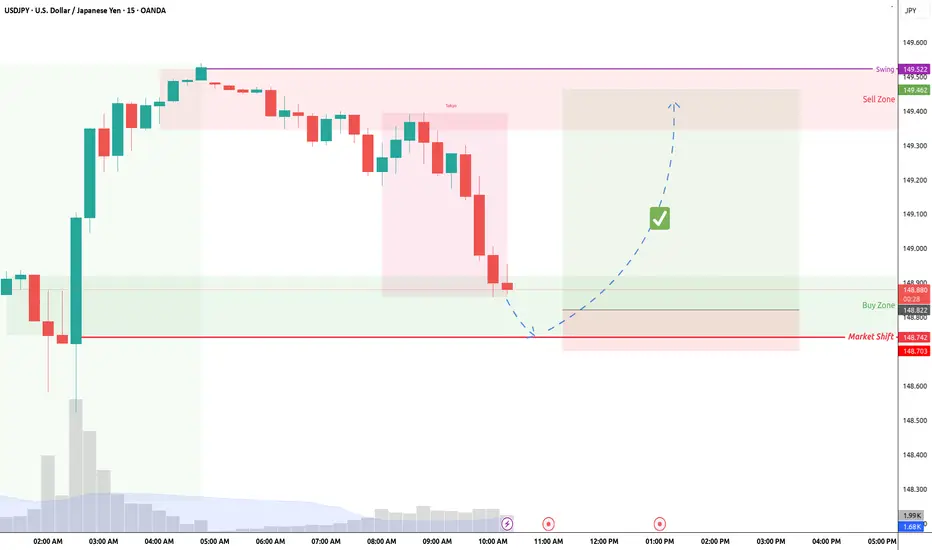
USDJPY 60/15 Pullback LongOverall up trend. Yesterday session a 'b' market profile. Aways from POC. looking for up continuous. Now is in pullback, montior for long oppoturnity.
If break and stay below market shift, then no go.
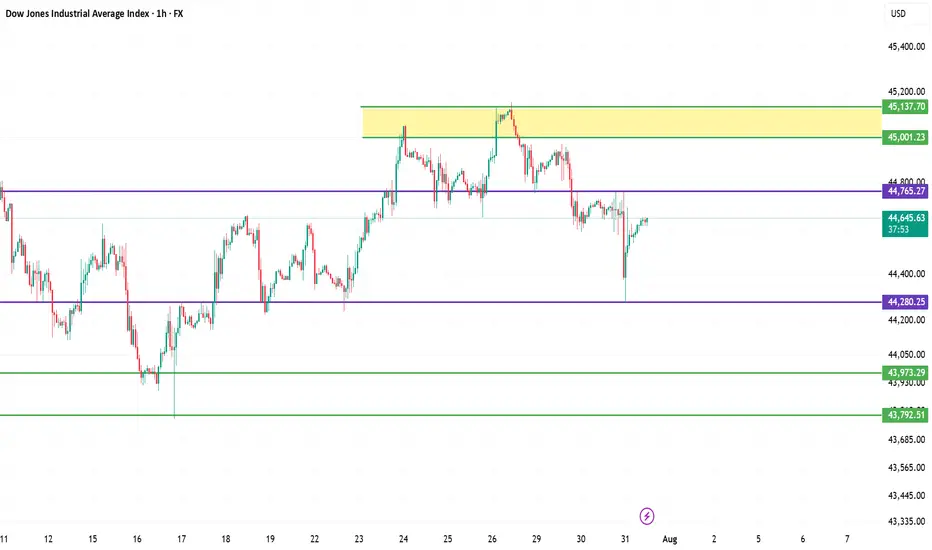
Dow Jones Industrial Average (DJI) – 1H Chart Analysis 1. Structure: Broad Range Consolidation
Price remains within a wide horizontal range between 45,137 resistance and 43,792 support. This shows indecision and distribution at highs.
2. Key Rejection Zone
The yellow zone around 45,001–45,137 acted as a strong supply area. Multiple rejections indicate heavy selling interest here.
3. Mid-Zone Compression
Current price is hovering just below 44,765 resistance — acting as a decision point. Break above it may retest the supply zone; rejection could send price lower.
4. Demand Holding at 44,280
The strong bounce from 44,280.25 shows buyers defending this demand zone. It's the key support to watch for bulls.
5. Next Play
Bullish: Break and hold above 44,765 targets 45,001–45,137.
Bearish: Failure leads to 44,280, then 43,973 → 43,792.
Neutral bias unless a clean breakout confirms direction.
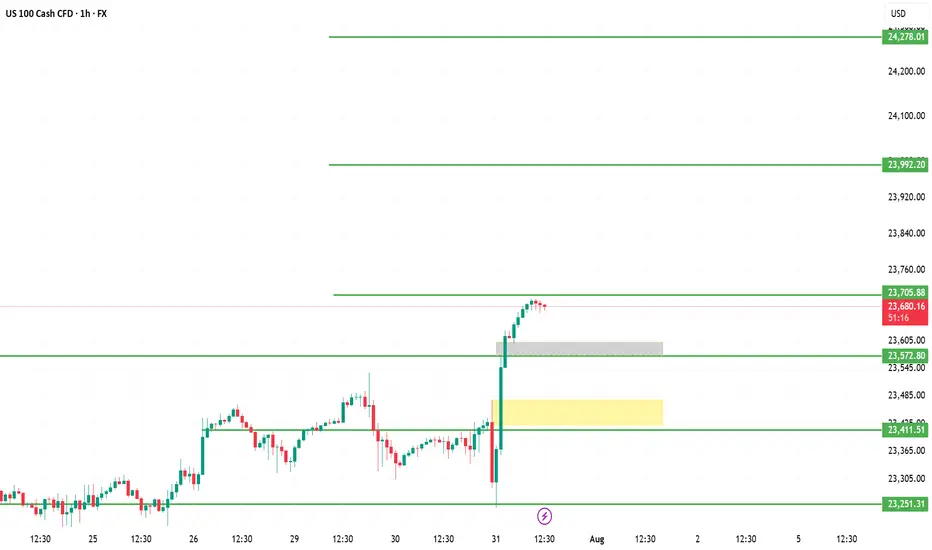
US100 (NASDAQ) Analysis – 1H Chart | July 31, 20251. Vertical Bullish Rally
Price exploded upward from 23,251 to 23,705 with strong bullish momentum and no meaningful retracement, indicating a short-term overbought scenario.
2. Fresh Supply at 23,705
The current candle shows hesitation just below 23,705.88 — forming a possible short-term top or reaction zone where sellers might step in.
3. Imbalance Zone Below
A visible Fair Value Gap (FVG) is left between 23,572–23,600 and the yellow highlighted demand zone (23,411) is untested. Price may revisit to fill that imbalance.
4. Projection: Pullback Possible
If price fails to break and hold above 23,705, we may see a pullback toward 23,600 → 23,411 before the next move.
5. Key Levels
Resistance: 23,705 → 23,992 → 24,278
Support: 23,572 → 23,411 → 23,251
Structure remains bullish unless 23,411 breaks.
BTC vs ETH: Lil Bro not waiting on nobody?!As BTC is stuck trying to convince everyone to stay long, ETH is using its bullish orderblocks really well...shorts are showing signs of letting go in these ranges.
Would like to hear your take!

Gold Market Update: Major Support at and Supply atGold is recovering after a strong drop from the previous range high. Price is approaching a 4H Order Block near the 3300–3310 zone, which may act as a supply area. A minor liquidity zone has just been tapped, suggesting a potential short-term rejection.
The major support lies at 3269, which sparked the recent bullish move. If price rejects from the OB zone, a pullback toward this support is likely. However, a clean break and hold above the OB may signal further upside.
📌 Key Levels:
Supply Zone: 3300–3310
Support: 3269
🧠 Wait for clear confirmation before executing trades.

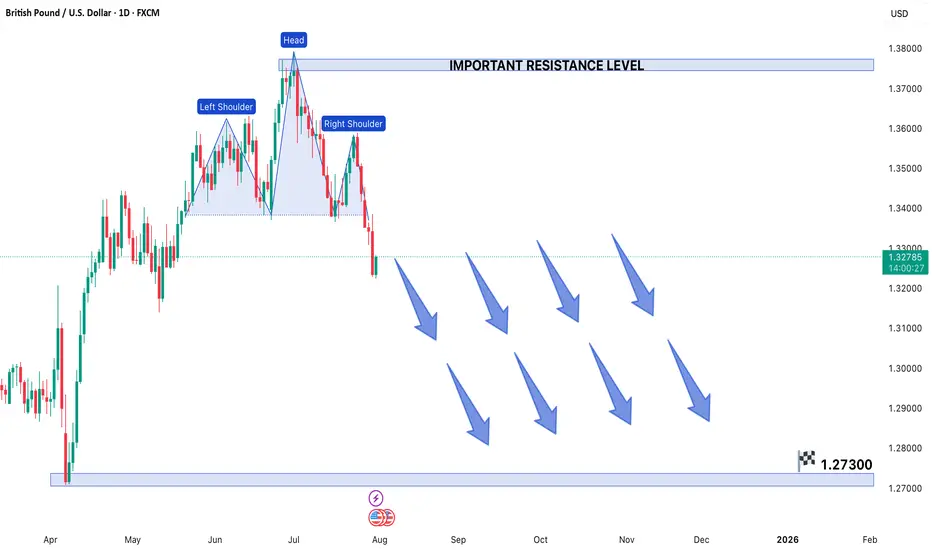
GBPUSD FORMS HEAD & SHOULDER PATTERN IN 1D TIME FRAME CHARTGBP/USD Forms Head and Shoulders Pattern - Bearish Breakdown Expected
The GBP/USD currency pair has developed a clear Head and Shoulders (H&S) reversal pattern on the 1-DAY chart, signaling potential weakness ahead. This technical formation - characterized by a central peak (head) flanked by two lower highs (shoulders) - suggests the recent uptrend may be exhausting as sellers gain control.
Current Market Structure
Price action remains confined within a bearish framework, making consistent lower highs and lower lows since failing at the pattern's right shoulder. The pair now tests critical support near the neckline of the H&S formation. A confirmed break below this level would validate the pattern and likely accelerate downward momentum.
Key Levels to Watch
- *Downside Target*: 1.27300 emerges as the next major support if bearish momentum sustains
- Resistance Zone: The 1.37900 level now acts as formidable overhead resistance
- Neckline Break: A daily close below current support would confirm the H&S pattern
Trading Implications
The technical setup favors:
1) Maintaining short positions while price holds below the right shoulder high
2) Watching for increased volume on breakdown moves to confirm bearish conviction
3) Considering long positions only if buyers reclaim 1.37900 resistance
Risk Factors
Traders should monitor:
- UK inflation data and BoE policy signals
- Fed interest rate expectations
- General USD strength across currency markets
This pattern projects approximately 900 pips of potential downside if fully realized. However, traders should wait for confirmed breakout momentum rather than anticipating the move, as false breakdowns remain possible in current market conditions. Proper position sizing and stop-loss placement above recent swing highs remains essential for risk management.
Note: Forex trading involves substantial risk. Always conduct your own analysis before entering positions.
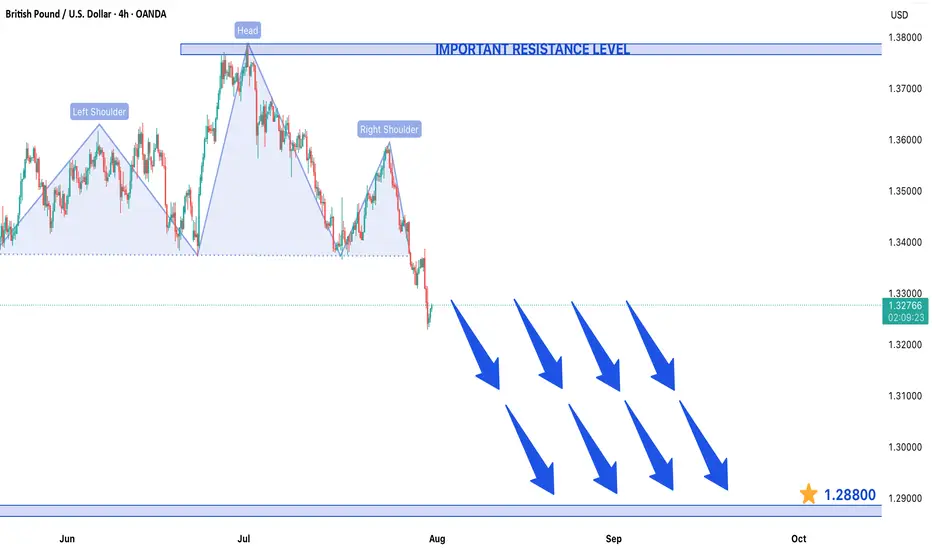
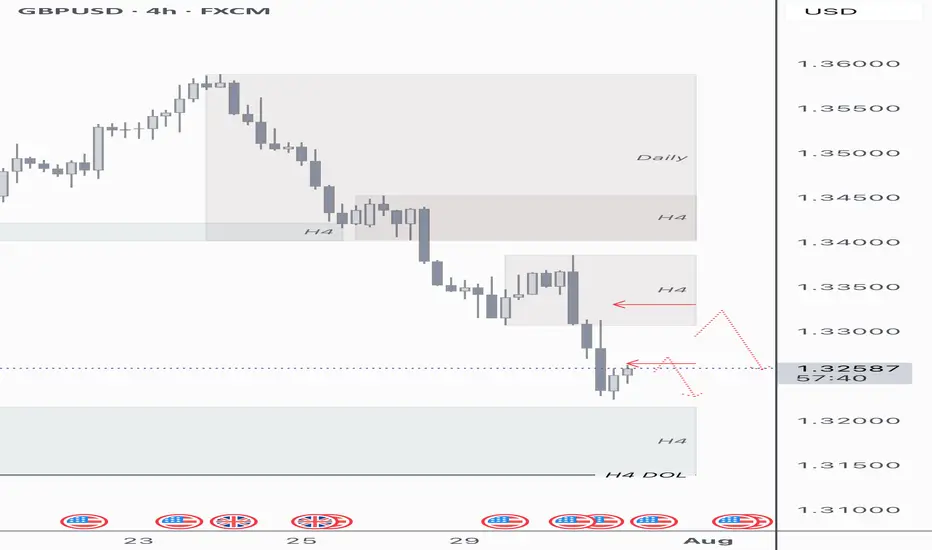
GBP/USD Forms Head and Shoulders Pattern in 4H Timeframe ChartGBP/USD Forms Head and Shoulders Pattern - Bearish Breakdown Expected
The GBP/USD currency pair has developed a clear Head and Shoulders (H&S) reversal pattern on the 4-hour chart, signaling potential weakness ahead. This technical formation - characterized by a central peak (head) flanked by two lower highs (shoulders) - suggests the recent uptrend may be exhausting as sellers gain control.
Current Market Structure
Price action remains confined within a bearish framework, making consistent lower highs and lower lows since failing at the pattern's right shoulder. The pair now tests critical support near the neckline of the H&S formation. A confirmed break below this level would validate the pattern and likely accelerate downward momentum.
Key Levels to Watch
- Downside Target: 1.28800 emerges as the next major support if bearish momentum sustains
- Resistance Zone: The 1.37900 level now acts as formidable overhead resistance
- Neckline Break: A daily close below current support would confirm the H&S pattern
Trading Implications
The technical setup favors:
1) Maintaining short positions while price holds below the right shoulder high
2) Watching for increased volume on breakdown moves to confirm bearish conviction
3) Considering long positions only if buyers reclaim 1.37900 resistance
Risk Factors
Traders should monitor:
- UK inflation data and BoE policy signals
- Fed interest rate expectations
- General USD strength across currency markets
This pattern projects approximately 900 pips of potential downside if fully realized. However, traders should wait for confirmed breakout momentum rather than anticipating the move, as false breakdowns remain possible in current market conditions. Proper position sizing and stop-loss placement above recent swing highs remains essential for risk management.
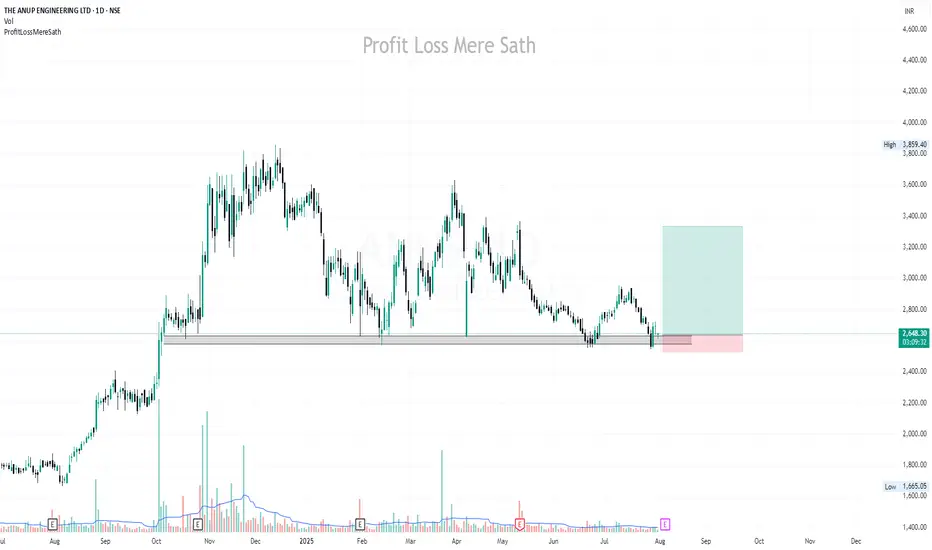
ANUP | Buy @2645 | Strict SL below 2528 | Target 3340Disclaimer:
This is not financial advice. Please do your own research or consult with a financial advisor before making any investment decisions. Investments in stocks can be risky and may result in loss of capital.
Short Breakdown of Cardano (ADAUSDT) weekly/daily technicalsLooked over this for a friend. Rowland I would love your feedback in the comments 🫡
I will see my biggest expectation is for this to make it's way into the weekly imbalance range below the weekly Mother Candle we are existing within. The entire crypto market seems to want to revisit some key lows to correct some inefficiently delivered rally ranges (meaning too many pending orders left behind due to price not coming back to grab them, happens when HUGE money places--attempts to place/fill--bulk orders).
We are getting what I think is a temporary bullish correction due to taking of profits at key lows. It is my belief/observation that after correcting the newly minted bearish range (grabbing pending shorts above daily highs--turtle soup I think they call it), we will be able to drive down into the bullish imbalance weekly candle's range.
Let's see how we go! 😈

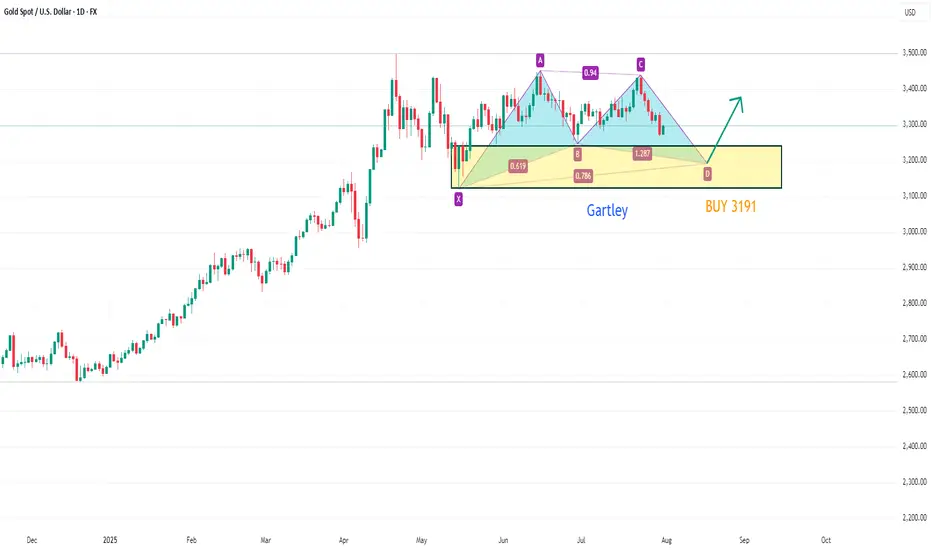
XAUUSD eyes potential Gartley patternOn the daily chart, XAUUSD has retreated from its highs, and short-term bears have the upper hand. Currently, we can pay attention to the area below 3191, which is a potential buy level for a bullish Gartley pattern and is within the previous demand zone.
U.S. Dollar Index (DXY) – Pro Analysis | 1H Chart |1. Strong Bullish Momentum
DXY broke out sharply above the 99.41 resistance, showing clear strength from bulls with minimal pullbacks during the rally.
2. Short-Term Rejection at Supply
Price was rejected from the 99.978 zone — a key supply area. This indicates the presence of active sellers near the psychological 100 level.
3. Retesting Breakout Structure
Currently hovering just above 99.669, the DXY is retesting the previous breakout level. This could act as short-term support if bullish momentum resumes.
4. Next Key Zones
Resistance: 99.978 → 100.534
Support: 99.411 → 98.92
Break below 99.411 may invalidate the breakout.
5. Outlook
Bias remains bullish above 99.41. However, failure to reclaim 99.978 soon may signal temporary exhaustion or consolidation before next leg up.

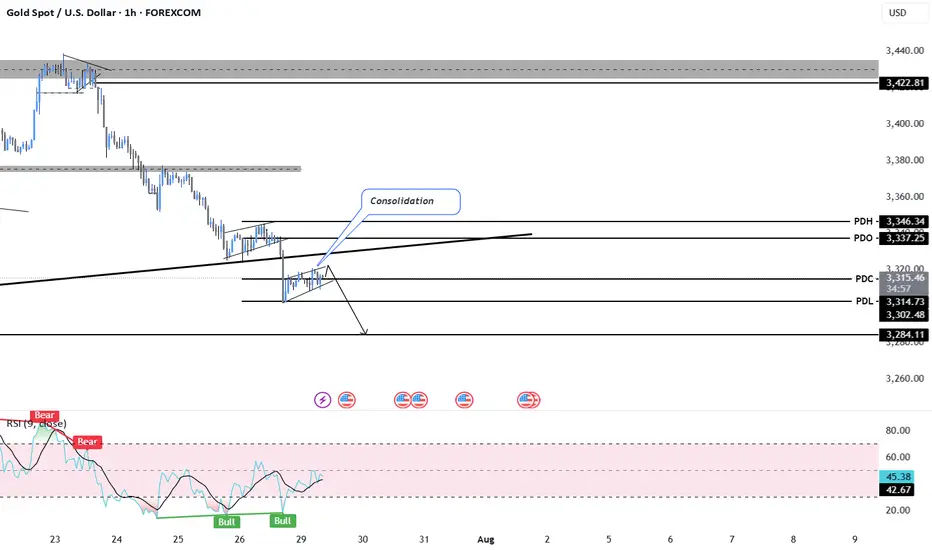
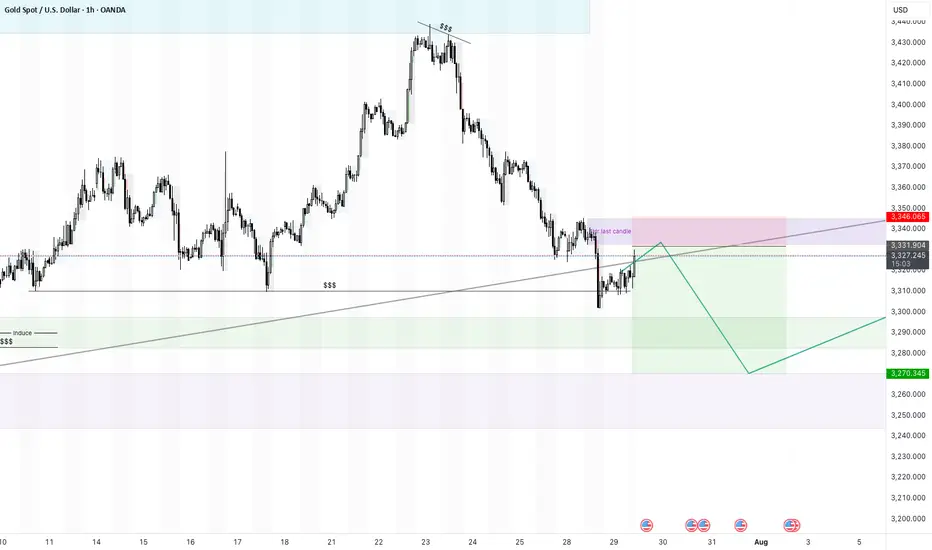
XAUUSD - 29/7/25 - continued bearish There was quite strong bearish momentum yesterday during the US session. Going into Asian session and London session today there is a consolidation bullish. There is a 4 hour zone marked out where i am looking for a retest and continuation bearish to a key zone below where a reversal pivot is expected and then continuing bullish with the larger trend.
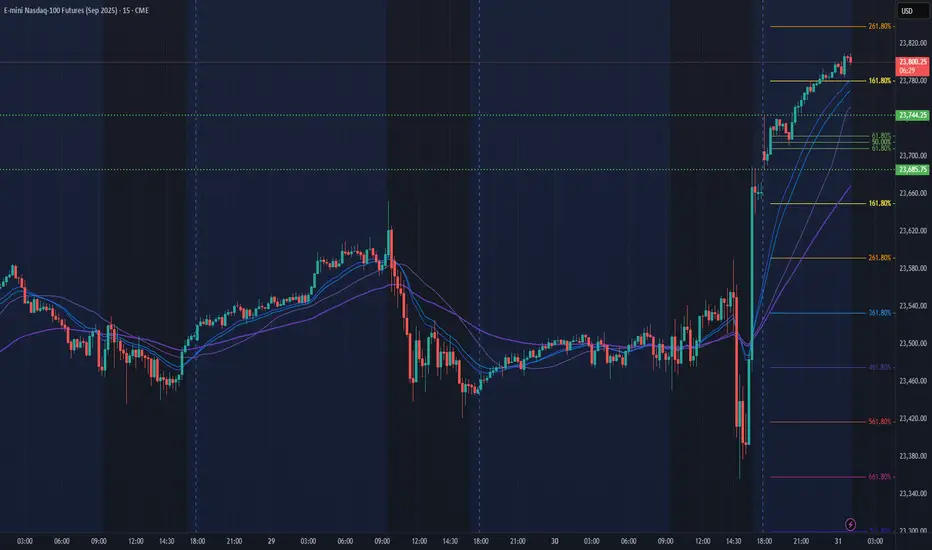
NQ Power Range Report with FIB Ext - 7/31/2025 SessionCME_MINI:NQU2025
- PR High: 23744.25
- PR Low: 23686.00
- NZ Spread: 130.5
Key scheduled economic events:
08:30 | Initial Jobless Claims
- Core PCE Price Index (MoM|YoY)
09:45 | Chicago PMI
New ATHs through Asian hours
Session Open Stats (As of 12:25 AM 7/31)
- Session Open ATR: 244.46
- Volume: 32K
- Open Int: 283K
- Trend Grade: Long
- From BA ATH: -0.6% (Rounded)
Key Levels (Rounded - Think of these as ranges)
- Long: 23811
- Mid: 22096
- Short: 20383
Keep in mind this is not speculation or a prediction. Only a report of the Power Range with Fib extensions for target hunting. Do your DD! You determine your risk tolerance. You are fully capable of making your own decisions.
BA: Back Adjusted
BuZ/BeZ: Bull Zone / Bear Zone
NZ: Neutral Zone
Aussie Shorts Looks Promising This is a pullback trend trade anticipating trend continuation. Entry is based on LVN (low volume node) for entry. Also looking on the footprint chart there is a high volume node with -ve delta that was traded at 0.64715.
If the sellers return to defend that price then this pullback should give some strong rejection once we pierce the entry zone and send bulls packing.
TP1 - First swing low
TP2 - Value area low of the range, which also is in confluence with the ExoFade peak on the 1HR timeframe. ExoFade peaks always gets taken out in a strong trend, that's why i love using them as price targets for exits. ExoFade is free on Tradingview for those curious about it. Just search for it.

USDJPY Buy analysis/ideaThis trade is based on the daily and 3-hour timeframes and executed using reversal trading and trend formation. This is an update for the previous analysis that I posted earlier on this pair . complete explanation in the video!

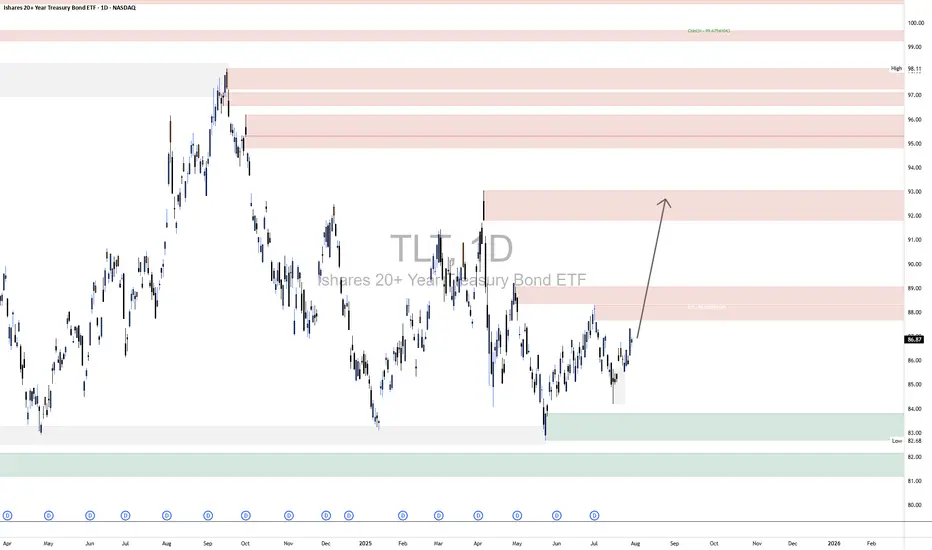
TLT LongThe broader market structure on the TLT 1D chart shows a clear downtrend, followed by a Change of Character (CHoCH) when price broke above the lower high near $86.50, signaling a potential trend reversal. This CHoCH is further validated by a strong push off the demand zone around $83–$84, where buyers stepped in with conviction, leading to a series of higher lows and an emerging bullish structure.
The demand zones below, especially the wide green area near $82.68–$84, are strong; price previously reversed sharply from this level, indicating institutional interest. In contrast, the supply zones between $88–$93 appear layered and moderately strong, especially around $88.20 and $92.70, where price previously sold off. However, the lack of deep wicks and clean rejections in the lower supply zones suggests that sellers may be weakening.
Currently, price is pushing upward toward the $88–$89 zone with bullish momentum. Within the marked region, price is climbing steadily after forming a minor higher low. If it can break above $88.20 convincingly, the next logical target would be the supply near $92.70–$93. A minor pullback to the $85.50–$86 zone could offer a buying opportunity if demand holds.
The trade bias is bullish with an expected continuation toward $92.70, assuming momentum holds. Invalidation of this outlook would occur if price breaks back below $84.00, which would indicate a failed breakout and potential return to the broader bearish trend. Momentum currently favors buyers, with higher closes and strong-bodied candles confirming upward intent.
GU 01/08Looking at this current H4 leg trending down, we have levels of H4 supply to come test with some gaps that need filled. We have high impact news incoming, my trading ideas are to follow what I see, we have a H4 demand level from the left which has deeper levels of daily demand with draws of liquidity in the form of lows and equal lows.
My idea is that we clear our H4 imbalance gaps resting within H4 supply and below, hopefully mitigating supply in order to look for continuation shorts into lower demand levels.
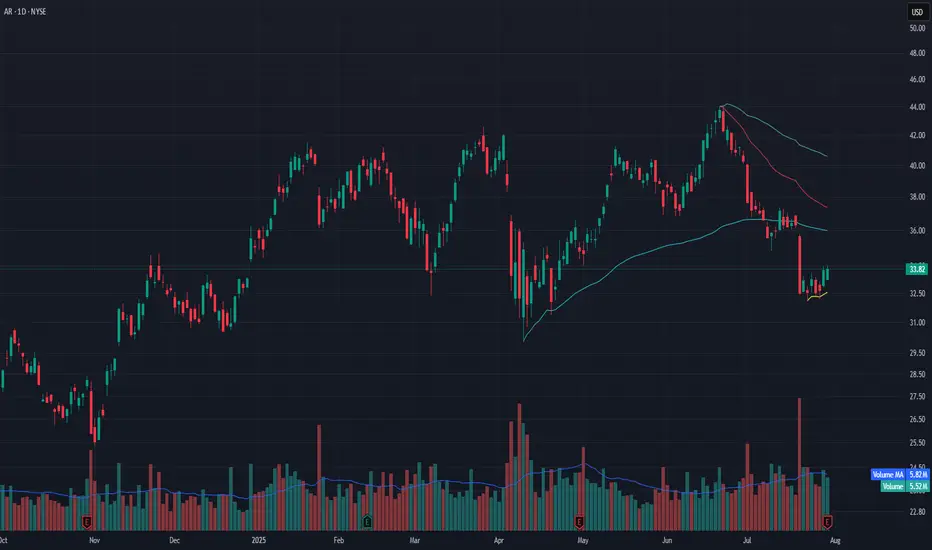
AR Rebounding from VWAP Zone – Watch for Break Above $34AR is attempting to base after a steep selloff from the $44 level. Over the past few sessions, price has found stability above the anchored VWAP (yellow line) and printed multiple higher lows. Today’s close at $33.82 brings it right up against the recent short-term resistance near $34.
Volume is steady (5.52M vs. 5.82M average), suggesting balance between buyers and sellers. A confirmed breakout above $34 with volume could trigger a move toward the $36.50–37 range, where the next anchored VWAP (red) and declining 20 EMA reside.
This setup favors early reversal traders with tight risk below VWAP and confirmation needed through $34.25.
Indicators used:
Anchored VWAP (short-term support reclaim)
Volume trend (flat but no selling surge)
Price structure (potential bottom formation with higher lows)
Entry idea: Long above $34
Target: $36.50–37
Stop: Below $32.75 or VWAP zone
SPX500USD | Retesting All-Time HighsThe index has extended its bullish rally, printing a new local high at 6,286.5 before showing signs of slight hesitation with consecutive small-bodied candles.
Support at: 6,134.5 / 6,026.0 / 5,926.2 🔽
Resistance at: 6,286.5 🔼
🔎 Bias:
🔼 Bullish: Sustains above 6,134.5 and breaks 6,286.5 for new highs.
🔽 Bearish: Break below 6,134.5 could trigger a retracement toward 6,026.0.
📛 Disclaimer: This is not financial advice. Trade at your own risk.

Gold Price Outlook: A Deeper Correction Ahead?Hello everyone! What are your thoughts on the current gold market?
Gold's decline is picking up speed, with the price now testing the 3,320 USD level. A stronger U.S. dollar, coupled with recent developments in the U.S.-EU trade agreement, has significantly reduced demand for gold as a safe-haven asset.
From a technical perspective, the break below the rising price channel is a key signal. It could mark the beginning of a deeper correction, as oscillators are starting to show negative momentum, indicating that the path of least resistance is now downward.
Looking ahead, all eyes will be on Wednesday’s FOMC decision. The market will be watching closely for any signs of a rate cut roadmap from the Federal Reserve, especially during Powell’s press conference. Additionally, several important U.S. macroeconomic data releases this week could provide new momentum for the USD and play a crucial role in shaping gold's next move.
What are your thoughts on where gold is heading? Let us know in the comments below!

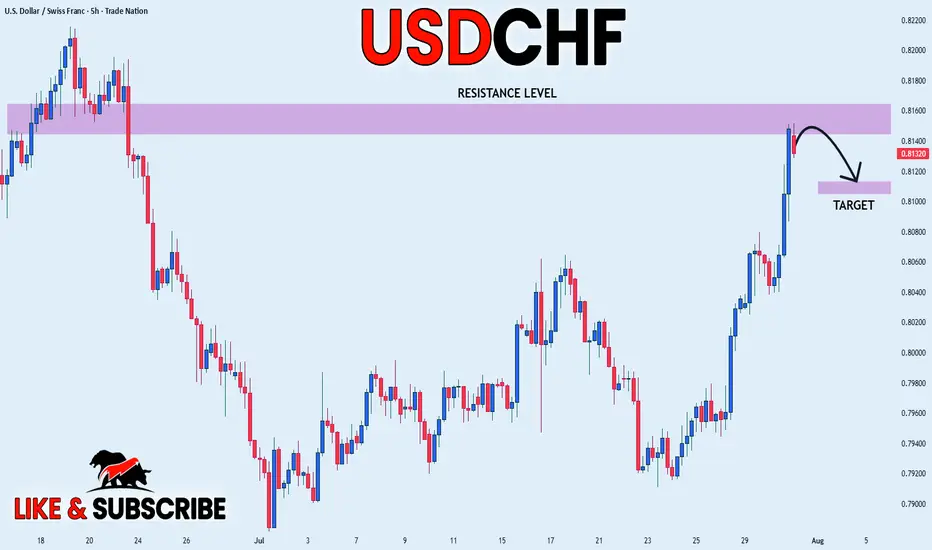
USD_CHF LOCAL SHORT|
✅USD_CHF price went up sharply
But a strong resistance level was hit at 0.8152
Thus, as a pullback is already happening
And a move down towards the
Target of 0.8113 shall follow
SHORT🔥
✅Like and subscribe to never miss a new idea!✅
Disclosure: I am part of Trade Nation's Influencer program and receive a monthly fee for using their TradingView charts in my analysis.
XAUUSD – Weak recovery, selling pressure still dominatesHello everyone! What do you think – is it time to buy or sell gold?
After clearly breaking the ascending trendline late last week, gold made a slight rebound from the 3,325 zone. However, in my view, this bounce was relatively weak and mostly technical in nature.
Currently, price is retesting a key confluence area around 3,345–3,355, which includes the previous trendline and a nearby resistance zone.
If we see a clear rejection candle form at this level, there's a high chance the price may reverse and continue its downward trend. The short-term target I’m watching is 3,300 USD – and if that level doesn’t hold, we could see stronger reactions near 3,283.
According to the VRVP indicator, volume is concentrated around lower price levels, suggesting that liquidity is still sitting near previous lows. Structurally, the market continues to form lower highs and lower lows, and with the EMA sloping downward, my primary bias remains to SELL on rallies within the trend.