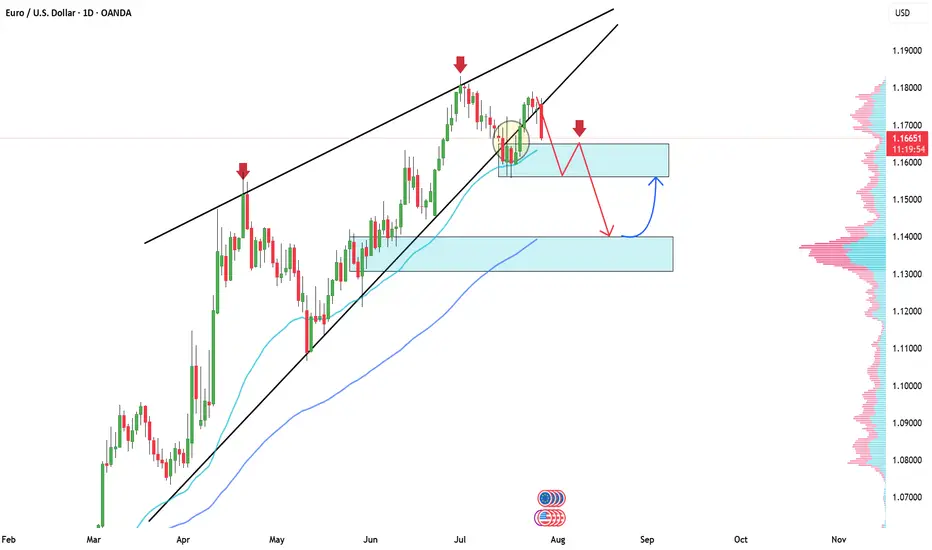
EURUSD: Buy or Sell?Dear friends!
On our 1D chart, after careful observation, we can see that a wedge pattern is forming. After EURUSD breaks out of the previous trend and completes the correction phase, a new downtrend is likely to be established.
Adam's target is to break above the 1.16000 support level and head towards the lower support level of 1.140000, which is where the pine attracts a large amount of buyers.
And you, do you think the price will go up or down? What is the target for your thinking?
Supply and Demand
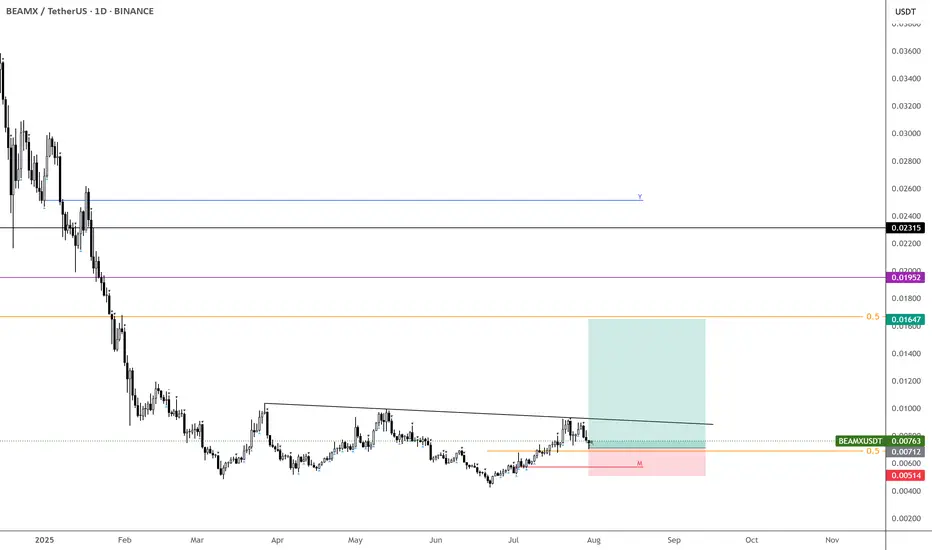
$BEAMX – Waiting for the Pop
One of those coins that’s hard not to track—when it expands, it does so aggressively.
The META sector’s been slow this year and might stay that way, with utility coins taking the spotlight this quarter, so it's key to pick your winners wisely.
That said, NASDAQ:BEAM still has a solid shot at moving higher. Buying some here and ready to adjust if it breaks above the trendline.
Targeting just above a 2x for my first offload. BINANCE:BEAMXUSDT
$FARTCOIN – Third Time's the Charm?
Back at a solid bid zone—third test of this level, so grabbing a small position here.
A move above $1.60 could trigger a push toward the range high, where I’ll look to offload some as first TP.
Let’s see how this one unfolds. MEXC:FARTCOINUSDT

$POPCAT – Patience Before the Pounce
BYBIT:POPCATUSDT holding up well—expecting a move after 2 weeks of ranging.
Starting to slowly scale in around 30c and under (if you haven't already).
Will reassess if 24c is lost and stays below for too long.
Still targeting $1 if momentum kicks in.

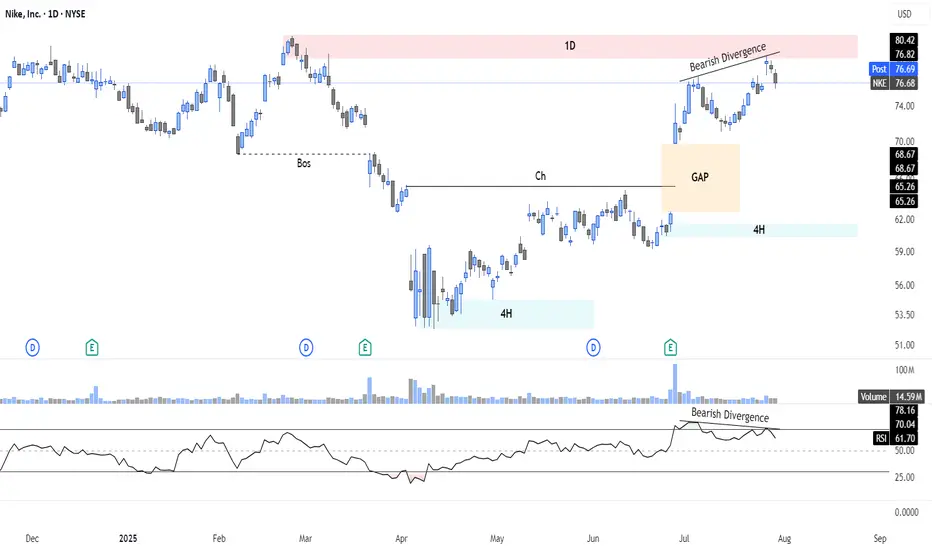
Bearish Setup on Nike ($NKE): Divergence + Supply Rejection📉 I'm watching a high-probability bearish setup on NYSE:NKE , with price rejecting a key 1D supply zone ($77–80) on bearish RSI divergence and fading momentum. A downside gap below adds further confluence.
📊 Technical Context:
Clear 1D supply rejection with divergence
Lower RSI highs vs higher price highs = Bearish divergence
Volume weakening near resistance
Open gap ($65–$68.67) below = magnetic target
Previous BOS indicates potential for continuation move lower
🎯 Strategy Ideas:
Bear Call Spread 80/85 (credit spread with resistance overhead)
Put Debit Spread 75/65 (targeting full gap fill)
⏳ Expiry: Sep 20 – well-timed before IV builds
📌 Setup offers attractive R/R with clearly defined invalidation above $81
🔔 Key Alerts:
$81: "Invalidation – bias flips if breakout confirmed"
$68.67: "Gap close in progress – partial target zone"
➡️ Follow for structured trade setups combining price action, divergence, and options strategies.
USD Dollar Index (DXY): Pushing Higher As Forecast!Welcome back to the Weekly Forex Forecast for the week of July 30 - Aug1
In this video, we will analyze the following FX market:
USD Index
In my last USD video, the forecast was for higher prices. Check the related links below to see that video forecast. It played out exactly as analyzed. The +FVG was used to push for higher prices. The FOMC decision to keep the rate unchanged only pushed it further along.
Enjoy!
May profits be upon you.
Leave any questions or comments in the comment section.
I appreciate any feedback from my viewers!
Like and/or subscribe if you want more accurate analysis.
Thank you so much!
Disclaimer:
I do not provide personal investment advice and I am not a qualified licensed investment advisor.
All information found here, including any ideas, opinions, views, predictions, forecasts, commentaries, suggestions, expressed or implied herein, are for informational, entertainment or educational purposes only and should not be construed as personal investment advice. While the information provided is believed to be accurate, it may include errors or inaccuracies.
I will not and cannot be held liable for any actions you take as a result of anything you read here.
Conduct your own due diligence, or consult a licensed financial advisor or broker before making any and all investment decisions. Any investments, trades, speculations, or decisions made on the basis of any information found on this channel, expressed or implied herein, are committed at your own risk, financial or otherwise.

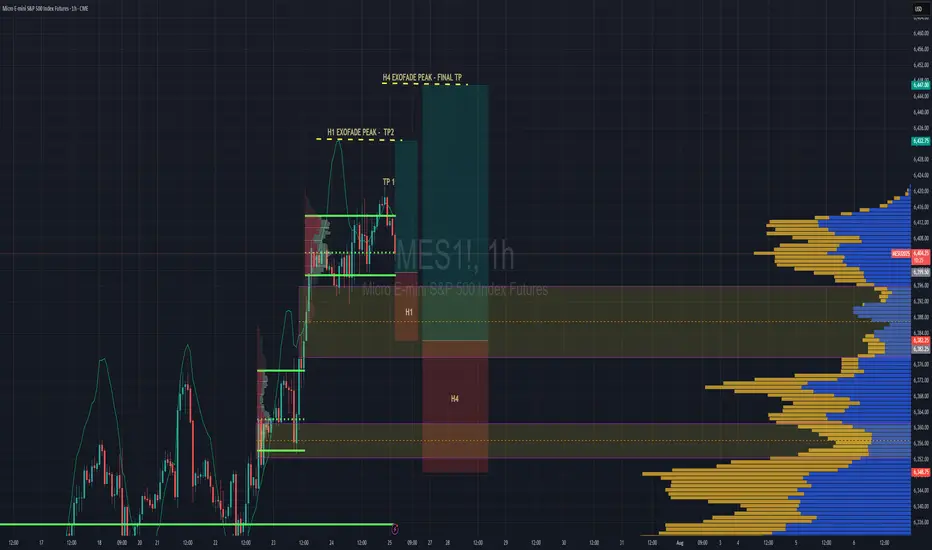
S&P 500 Intraday & Swing Entries H1 entry is close to getting activated for intraday.
If you want a swing trade then wait for H4 entry (you might be waiting a while obviously)
Reason for entries - We have broken out of Balance since July 25th and currently in a trend phase until we establish a new value area, or return to the one we broke out from.
So since Trend and Momentum is UP, then we should find Low Volume Areas to enter in the direction of the trend for a classic pullback entry trade.
Dieteren Group Quote | Chart & Forecast SummaryKey Indicators On Trade Set Up In General
1. Push Set Up
2. Range Set Up
3. Break & Retest Set Up
Notes On Session
# Dieteren Group Quote
- Double Formation
* (Reversal Argument)) + (Diagonal Shift)) | Completed Survey
* (Downtrend Argument)) - *Double Top Structure | Subdivision 1
- 49 bars, 67d | Date Range Method
- Triple Formation
* (P1)) / (P2)) & (P3)) | Subdivision 2
* Daily Time Frame | Trend Settings Condition | Subdivision 3
- (Hypothesis On Entry Bias)) | Indexed To 100
- Position On A 1.5RR
* Stop Loss At 118.00 EUR
* Entry At 107.00 EUR
* Take Profit At 91.00 EUR
* (Downtrend Argument)) & Pattern Confirmation
- Continuation Pattern | Not Valid
- Reversal Pattern | Valid
* Double Top | Short Set Up
* Ongoing Entry & (Neutral Area))
Active Sessions On Relevant Range & Elemented Probabilities;
European-Session(Upwards) - East Coast-Session(Downwards) - Asian-Session(Ranging)
Conclusion | Trade Plan Execution & Risk Management On Demand;
Overall Consensus | Sell

POTENTIAL EURUSD SHORT OPPORTUNITY...POSITION TRADEHello hello TradingView family! Hope you guys are doing amazingly well! Just wanted to come on here and make another post for a potential longer term opportunity I am seeing on the major currency pair EURUSD. So put your seat belts on and let's dive in!!
OK so I'm going to keep this very very simple. Not because I don't want to go in depth but because my trading is very simple and I'm just going to give it to you straight. So here are the points
1. Price is @ monthly supply
2. Price has made new highs & sitting at a monthly fib extension
3. Monthly RSI overbought conditions
4. Weekly has bearish divergence forming
5. Weekly/Daily buyer is slowing down
Make sense? If not..then I know you will figure it out. Watch for price to potentially poke a little higher but nice confluences for a fall in price. Appreciate you all!
MARKET CONTEXT...#1 TOOL FOR PROFITABLE TRADING...EURUSD EXAMPLEHey hey TradingView family! Hope you are all doing amazing! I just wanted to come on and make a video speaking on market context, the #1 tool/idea that helped me go from struggling to profitable trader.
Understanding the bigger picture in trading, like TRULY understanding the higher timeframe perspective will work wonders in your analysis & trading whether you are a scalper or a position trader. It gives you the context for what market and the stage of market you are in whether in short term or longer term positions, which will IMMEDIATELY give you an edge.
Understanding=profitability in the markets. So does simplicity.
So watch this video as many times as you guys need, keep it simple, and watch this change your trading starting TODAY for the GOOD!
Cheers!

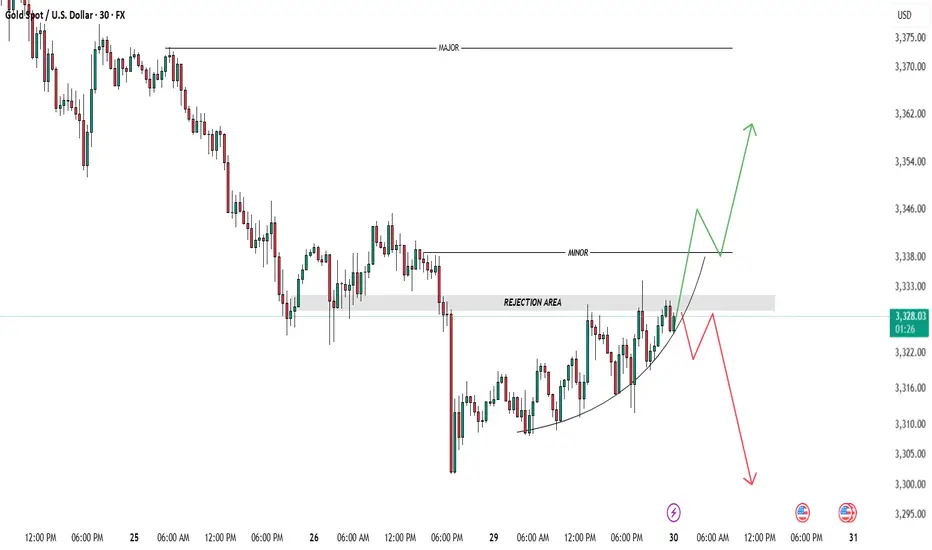
GOLD -Key Levels-Wait for Confirmation!Gold (XAUUSD) is now testing a critical Rejection Area 📍 (around 3,328–3,333), right beneath a minor CHOCH zone. This is a key decision level, and I'm just waiting for price to show its intrest – no early entries here. ⚠️
🔼 Bullish Scenario:
Price fails to hold above minor CHOCH ✅
Comes back to retest the Rejection Area as support 🧱
If we get a clean bounce + confirmation, I’ll look for buys toward 3,346 → 3,360 🎯
🔽 Bearish Scenario:
Price rejects from minor CHOCH ❌
Gives strong bearish confirmation 🔻
Then retests the Rejection Area as resistance 🚫
That’s my cue to short toward 3,310 → 3,295 📉
NOTE: possibility is that market take all liquidity from sell side. Avoid Taking any trade untill setup is clean.
Being patient here. Confirmation is everything! Let’s see🔍💡
Avoid Mid-Zone Entries!
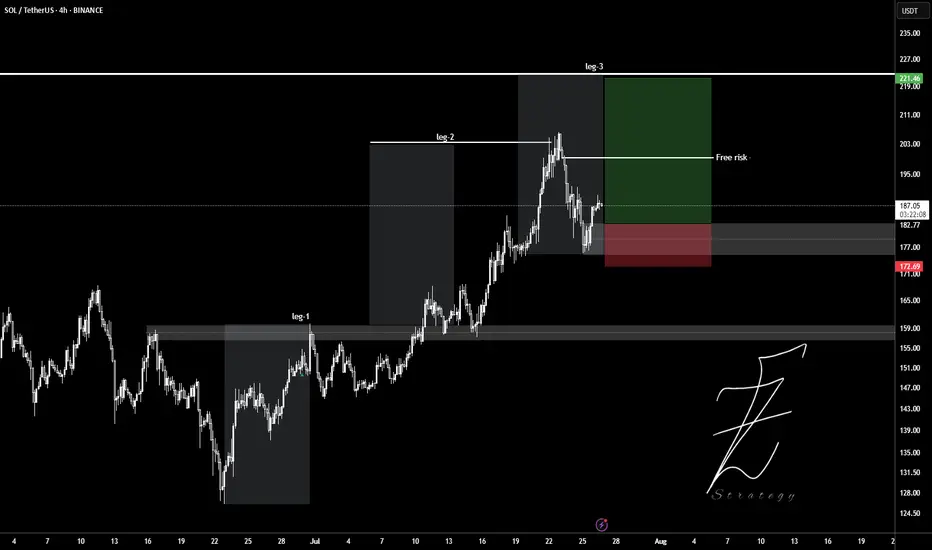
SOLUSDTWait for pollback to 180$ level and ready to get buy position.
Target set in leg2 and leg3.
Entry: 182
Stop: 177
Tp: 190 - 200 - 210 - 220
Please control Risk management.
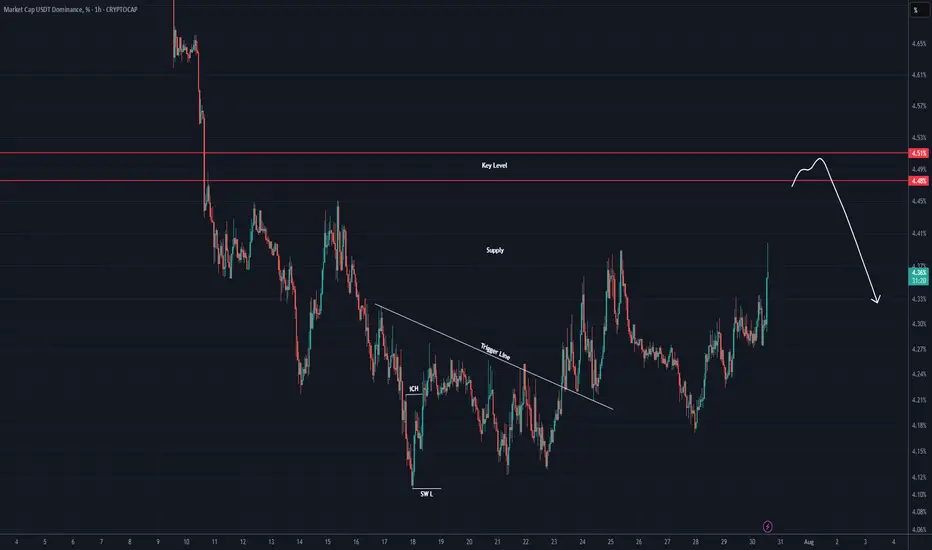
USDT DOMINANCE New Update (4H)First of all you should know that "USDT Dominance" is always moving inverse of BTCUSDT
We have a key level on the chart that This key level has been lost, and there hasn't been a pullback to it yet. It seems that the candles intend to make a pullback to this level. Upon this pullback, we expect a rejection to the downside.
Let's see what happens.
For risk management, please don't forget stop loss and capital management
Comment if you have any questions
Thank You
THE KOG REPORT - FOMCTHE KOG REPORT – FOMC
This is our view for FOMC, please do your own research and analysis to make an informed decision on the markets. It is not recommended you try to trade the event if you have less than 6 months trading experience and have a trusted risk strategy in place. The markets are extremely volatile, and these events can cause aggressive swings in price.
It’s been an aggressive month on the markets especially this week which has been testing for traders due to the extended movement on gold. We’ve managed to stay ahead of the game and although we missed the move downside, we’ve capture scalps up and down trading it on an intra-day basis rather than a swing.
Looking at the 4H chart, we can see we have support forming at the 3310 level which is the key level for this week and will need to be broken to go lower. If we can flip the 3334 resistance, price should attempt higher into the 3355-60 region which is where we may settle in preparation for NFP. on Friday This is the level that needs to be watched for the daily close, as a close above will confirm the structure and pattern test which can form a reversal if not breached.
Now, here is the flip! We’re still sitting below the daily red box but we know this break does give a retracement and with sentiment long, it may not be a complete retracement again. Here 3345-50 is the red box to watch and as above, if not breached, we may see a rejection here which will confirm no reversal for higher and, potentially a further decline into the 3270-5 regions for the end of the month and quarter.
Pivot – 3323-6
RED BOX TARGETS:
Break above 3335 for 3338, 3340, 3345, 3347 and 3357 in extension of the move
Break below 3320 for 3310, 3306, 3302, 3297 and 3393 in extension of the move
Please do support us by hitting the like button, leaving a comment, and giving us a follow. We’ve been doing this for a long time now providing traders with in-depth free analysis on Gold, so your likes and comments are very much appreciated.
As always, trade safe.
KOG

LONG ON NZD/USDNZD/USD is at a major demand level.
Dollar is bearish. Economic News this afternoon should assist and pushing this pair up.
Looking to catch 200 pips to the previous high.

USDJPY Short from ResistanceHello Traders
In This Chart USDJPY HOURLY Forex Forecast By FOREX PLANET
today USDJPY analysis 👆
🟢This Chart includes_ (USDJPY market update)
🟢What is The Next Opportunity on USDJPY Market
🟢how to Enter to the Valid Entry With Assurance Profit
This CHART is For Trader's that Want to Improve Their Technical Analysis Skills and Their Trading By Understanding How To Analyze The Market Using Multiple Timeframes and Understanding The Bigger Picture on the Charts
FMC Corporation Quote | Chart & Forecast SummaryKey Indicators On Trade Set Up In General
1. Push Set Up
2. Range Set Up
3. Break & Retest Set Up
Notes On Session
# FMC Corporation Quote
- Double Formation
* (1st Entry Area)) - *70.00 USD | Completed Survey
* (A+ SIgnal)) - *Retest Feature | Subdivision 1
- Triple Formation
* (P1)) / (P2)) & (P3)) | Subdivision 2
* 119 bars, 165d, 1.5RR - Date Range Method | Subdivision 3
* Daily Time Frame | Trend Settings Condition
- (Hypothesis On Entry Bias)) | Regular Settings
- Position On A 1.5RR
* Stop Loss At 48.00 USD
* Entry At 41.00 USD
* Take Profit At 31.00 USD
* (Downtrend Argument)) & Pattern Confirmation
- Continuation Pattern | Valid
* Pennant Structure | Short Set Up
- Reversal Pattern | Not Valid
* Ongoing Entry & (Neutral Area))
Active Sessions On Relevant Range & Elemented Probabilities;
European-Session(Upwards) - East Coast-Session(Downwards) - Asian-Session(Ranging)
Conclusion | Trade Plan Execution & Risk Management On Demand;
Overall Consensus | Sell

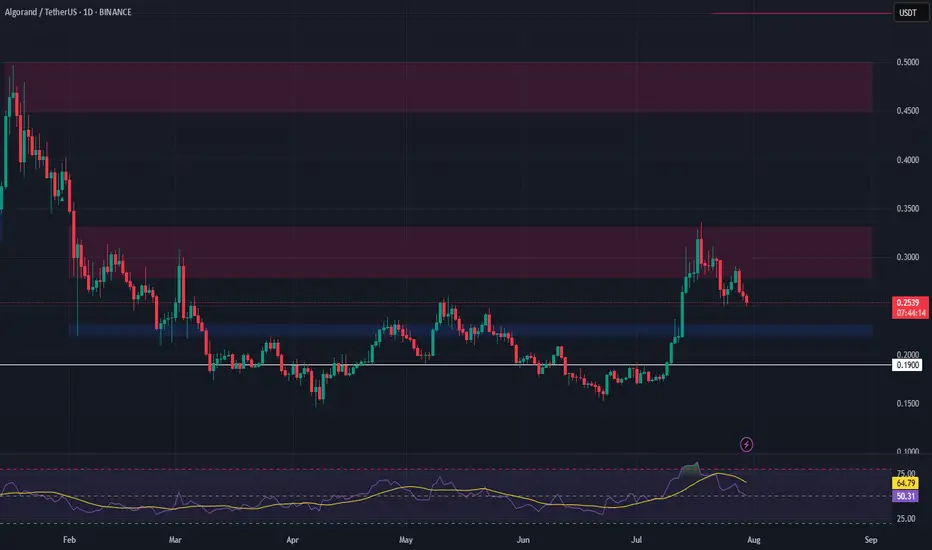
ALGO Swing Trade – Waiting for Pullback to Key SupportAfter a 100%+ surge, ALGO is now retracing and approaching a critical support zone. A dip into this area could offer a strong entry for the next leg higher.
📌 Trade Setup:
• Entry Zone: $0.22 – $0.23
• Take Profit Targets:
o 🥇 $0.28 – $0.33
o 🥈 $0.45 – $0.50
• Stop Loss: Just below $0.19
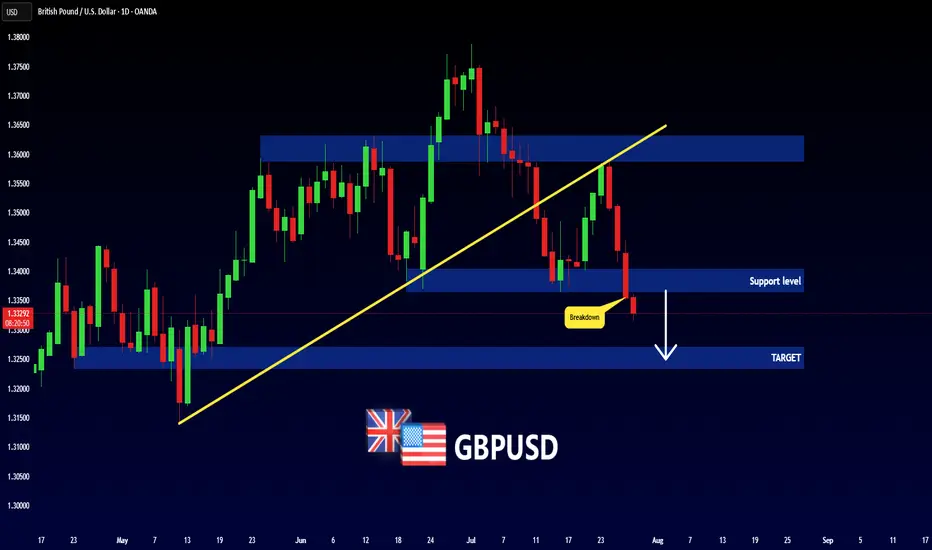
GBPUSD - NEW BREAKDOWN !Hello Traders !
The GBPUSD broke the support level (1.34037 - 1.33650).
This key level becomes new resistance!
So, I expect a bearish move📉
_______________
TARGET: 1.32710🎯
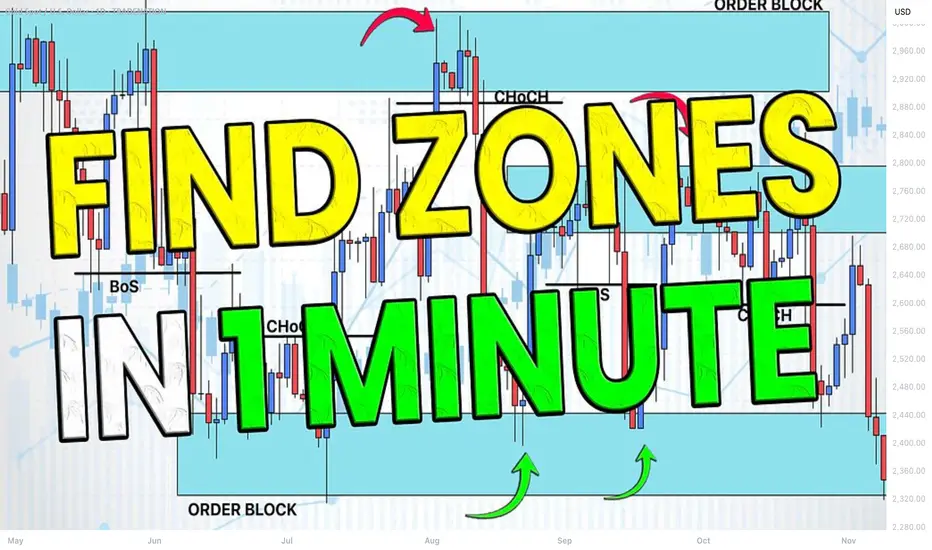
How to Find Liquidity Zones/Clusters on Any Forex Pair (GOLD)
You need just 1 minute of your time to find significant liquidity zones on any Forex pair and Gold.
In this article, I will teach you how to identify supply and demand zones easily step by step.
Liquidity Basics
By a market liquidity, I mean market orders.
The orders are not equally distributed among all the price levels.
While some will concentrate the interest of the market participants,
some levels will be low on liquidity.
Price levels and the areas that will attract and amass trading orders will be called liquidity zones.
How to Find Supply Zones
To find the strongest liquidity clusters, we will need to analyze a daily time frame.
A liquidity zone that is above current prices will be called a supply zone.
High volumes of selling orders will be distributed within.
One of the proven techniques to find such zones is to analyze a historic price action. You should identify a price level that acted as a strong resistance in the past.
4 horizontal levels that I underlined on EURGBP influenced market behavior in the recent past.
The price retraced from these levels significantly.
Why It Happened?
A down movement could occur because of an excess of selling orders and a closure of long positions by the buyers.
These factors indicate a high concentration of a liquidity around these price levels.
How to Draw Supply Zone?
One more thing to note about all these horizontal levels is that they cluster and the distance between them is relatively small .
To find a significant liquidity supply zone, I advise merging them into a single zone.
To draw that properly, its high should be based on the highest high among these levels. Its low should be based on the highest candle close level.
Following this strategy, here are 2 more significant supply zones.
We will assume that selling interest will concentrate within these areas and selling orders will be spread across its price ranges.
How to Find Demand Zones
A liquidity zone that is below current spot price levels will be called a demand zone . We will assume that buying orders will accumulate within.
To find these zones, we will analyze historically important price levels that acted as strong supports in the past.
I found 3 key support levels.
After tests of these levels, buying pressure emerged.
Why It Happened?
A bullish movement could occur because of an excess of buying orders and a closure of short positions by the sellers. Such clues strongly indicate a concentration of liquidity.
How to Draw Demand Zones?
Because these levels are close to each other, we will unify them into a one liquidity demand zone.
To draw a demand zone, I suggest that its low should be the lowest low among these key levels and its high should be the lowest candle close.
Examine 2 more liquidity zones that I found following this method.
Please, note that Demand Zone 2 is based on one single key level.
It is not mandatory for a liquidity zone to be based on multiple significant levels, it can be just one.
We will assume that buying interest will concentrate within these areas and buying orders will be allocated within the hole range.
Broken Liquidity Zones
There is one more liquidity zone that I did not underline.
That is a broken supply zone. After a breakout and a candle close above, it turned into a demand zone. For that reason, I plotted that based on the rules of supply zone drawing.
Start Market Analysis From Liquidity
Liquidity zones are one of the core elements of forex trading.
Your ability to recognize them properly is the key in predicting accurate price reversals.
Identify liquidity zones for:
spotting safe entry points,
use these zones as targets,
set your stop losses taking them into consideration.
They will help you to better understand the psychology of the market participants and their behavior.
I hope that the today's tutorial demonstrated you that it is very easy to find them.
❤️Please, support my work with like, thank you!❤️
I am part of Trade Nation's Influencer program and receive a monthly fee for using their TradingView charts in my analysis.
GBP Forming Head & Shoulders - Possible Bearish Scenario AheadHello traders!
As you can see, price has formed a Head and Shoulders pattern on the daily chart.
If it breaks below the current support/demand area, it could move lower toward the 1.32000 – 1.33000 zone.
We’ll be watching closely to see what it does in the coming weeks.

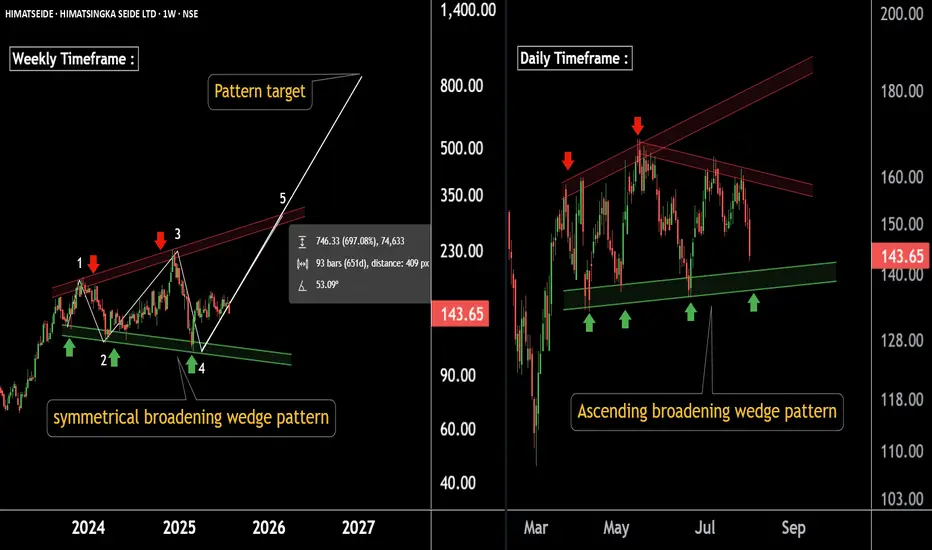
Massive Base Formation on Charts – Potential Multibagger LoadingThere are two Chart of HIMATSINGKA SEIDE.
Himatsingka Seide is forming a symmetrical broadening wedge pattern on the weekly timeframe, with a strong support zone near ₹100.
On the daily timeframe, Himatsingka Seide is forming an ascending broadening wedge pattern, with a crucial support level near ₹135.
If this level is Sustain then we may see higher prices in Himatsingka Seide.
Thank You !!
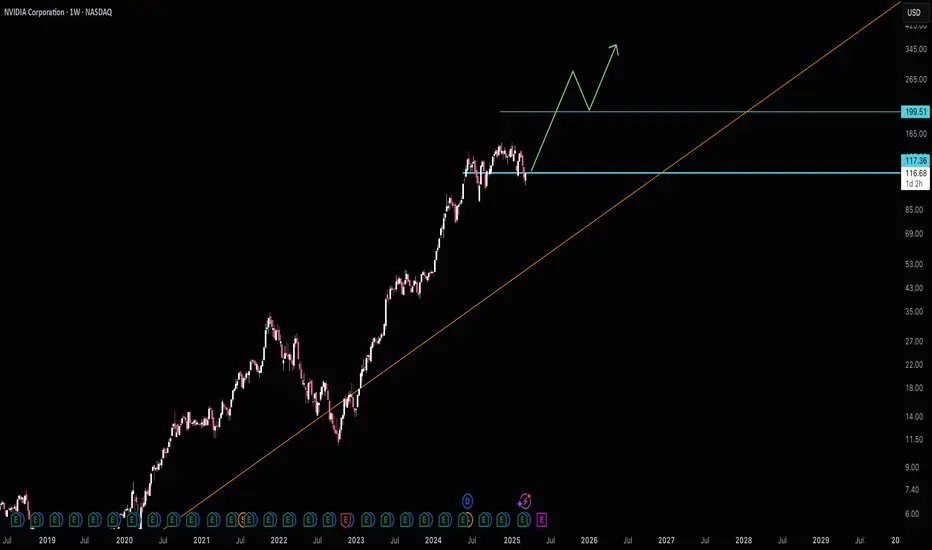
Nvidia Just Under Major SupportNvidia seems to have been pulled down by the Dow just like Apple as both are just under major support. I'm sorry for my previous Nvidia chart that drew support near 140, I recognize where I screwed up, but this chart should be good. Fortunately actual 117 support wasn't that far below and my NVDA isn't too in the red.
NVDA has the lowest revenue multiple in years right now. I know it's well off it's long term trend line, but it's growth rate is unlike anything it's ever been so expecting a steeper trend line to appear makes a lot of sense. Eventually I would imagine we'll get back to that trend line, but not anytime soon.
The Dow hitting major support should finally lift NVDA and the others that have been dragged down like AAPL and AMZN.
Good luck!