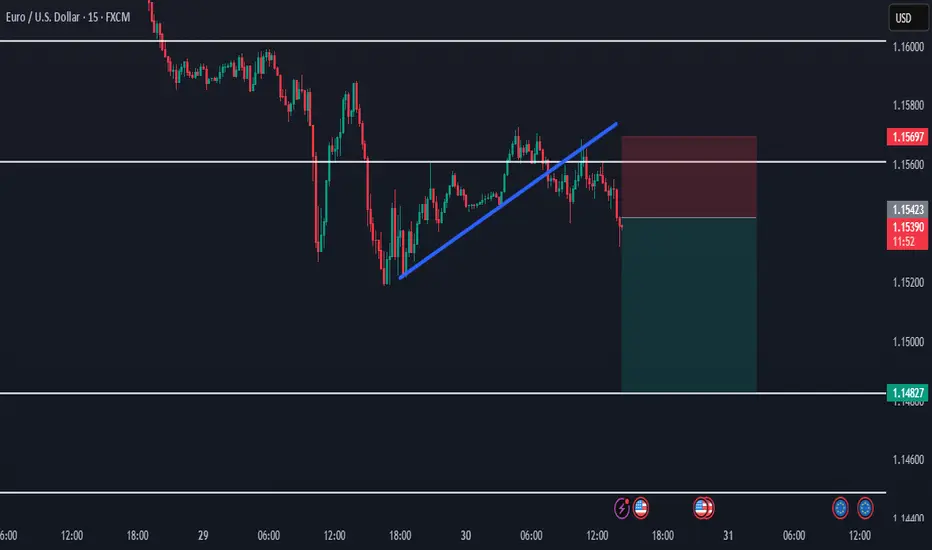
EURUSD Sell SetupHello traders!
Price has strong bearish momentum and is expected to move lower.
We're selling here with the target around the higher timeframe demand zone.
Manage your risk and trade safe!
Supply and Demand
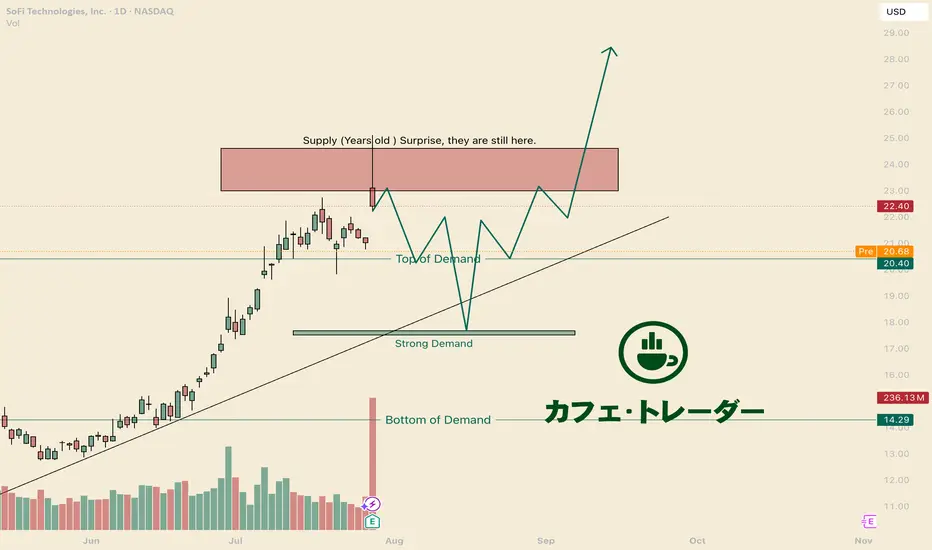
Scared? Become a BuyerHello I am the Cafe Trader.
With heightened interest in SOFI, I am seeing many worried posts, and skepticism. Before taking profits early, consider these levels fist.
Years Old Supply.
This Supply zone (marked in the red box) has been sitting here for years. It is no suprise that we get a dynamic reaction at this level.
Welcome to the Range
Now that you know there is a seller sitting there, If this doesn't jump back up and close above 24.71 by friday, expect to be sitting in a range for months.
Bulls are in Control
Even with that massive reacion, All previous bulls are still in tact and ready to accumulate more. Top of demand will fae the most pressure, but there are alot of buyers at that strong demand level. Be patient, and you can get great pricing.
Long Term
For those looking to get into SOFI, I have some prices that should line up with your personal sentiment.
FOMO Aggressive = $21.67 ( i dont recommend)
Aggressive = 20.40
Good price = 17.50 - 17.75
STEAL - 7.50-9.50
That's all for SOFI. Comment below if you want to see any other analysis!
Happy Trading
@thecafetrader
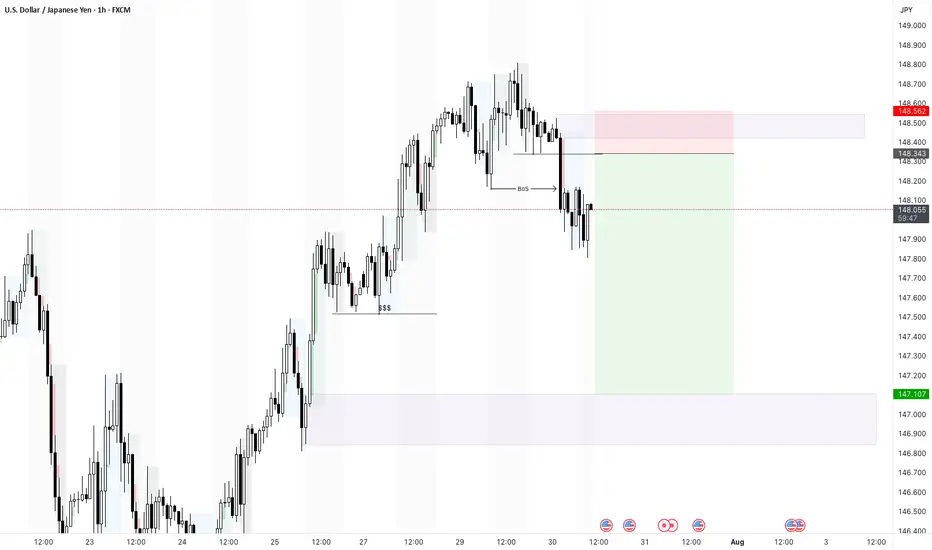
USDJPY - 30/7/25 - BoS to a bearish pull backI dont normally trade USDJPY but i see a setup based on my strategy. The price was climbing to take out a previous high on the 4H and Daily TF. But on the hourly there is a clear BoS which suggests that there may be a pull back even though the HTF bias is still bullish.
+ve:
1. there is a BoS on the 1 hour chart
2. Equal low liquidity just below which will draw price to this zone
3. Big imbalance below the equal low liquidity
-ve:
1. Fed news today may push the market against my trade idea
CADCHF 60/15 Pullback LongOverall up trend. Looking for a pullback, then long. But if break market shift line, then will start looking for short.

BankNfity levels - Jul 31, 2025Utilizing the support and resistance levels of BankNifty, along with the 5-minute timeframe candlesticks and VWAP, can enhance the precision of trade entries and exits on or near these levels. It is crucial to recognize that these levels are not static, and they undergo alterations as market dynamics evolve.
The dashed lines on the chart indicate the reaction levels, serving as additional points of significance. Furthermore, take note of the response at the levels of the High, Low, and Close values from the day prior.
We trust that this information proves valuable to you.
* If you found the idea appealing, kindly tap the Boost icon located below the chart. We encourage you to share your thoughts and comments regarding it.
Wishing you successful trading endeavors!

Nifty levels - Jul 31, 2025Nifty support and resistance levels are valuable tools for making informed trading decisions, specifically when combined with the analysis of 5-minute timeframe candlesticks and VWAP. By closely monitoring these levels and observing the price movements within this timeframe, traders can enhance the accuracy of their entry and exit points. It is important to bear in mind that support and resistance levels are not fixed, and they can change over time as market conditions evolve.
The dashed lines on the chart indicate the reaction levels, serving as additional points of significance to consider. Furthermore, take note of the response at the levels of the High, Low, and Close values from the day prior.
We hope you find this information beneficial in your trading endeavors.
* If you found the idea appealing, kindly tap the Boost icon located below the chart. We encourage you to share your thoughts and comments regarding it.
Wishing you success in your trading activities!

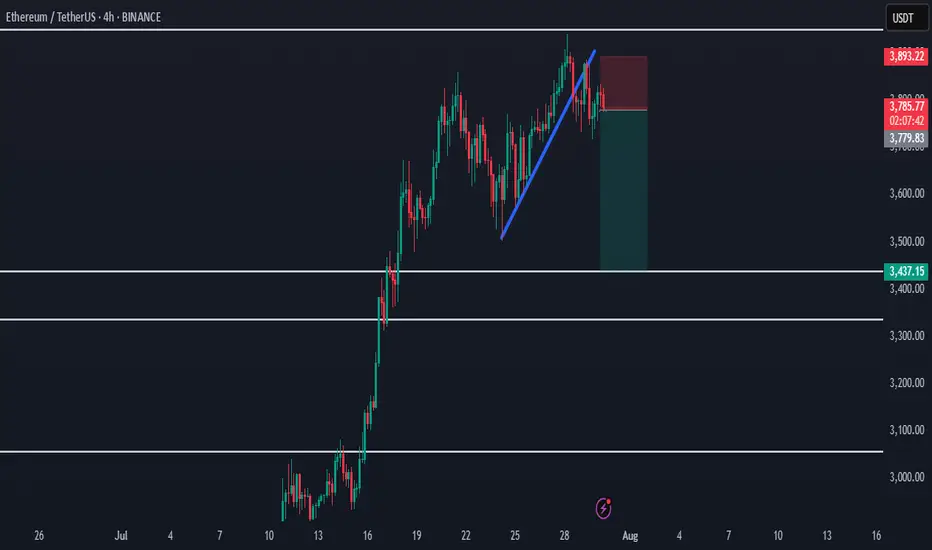
Ethereum Rejected from Supply - Bearish Shift in ProgressHello everybody!
Price has been rejected from a supply area.
The bullish trend has slowed down, and the market structure is slightly shifting bearish.
A polished upward trendline has been broken on the 1H timeframe.
We’re aiming for a target around the first untouched demand zone: 3437.
Manage your risk and trade safe!
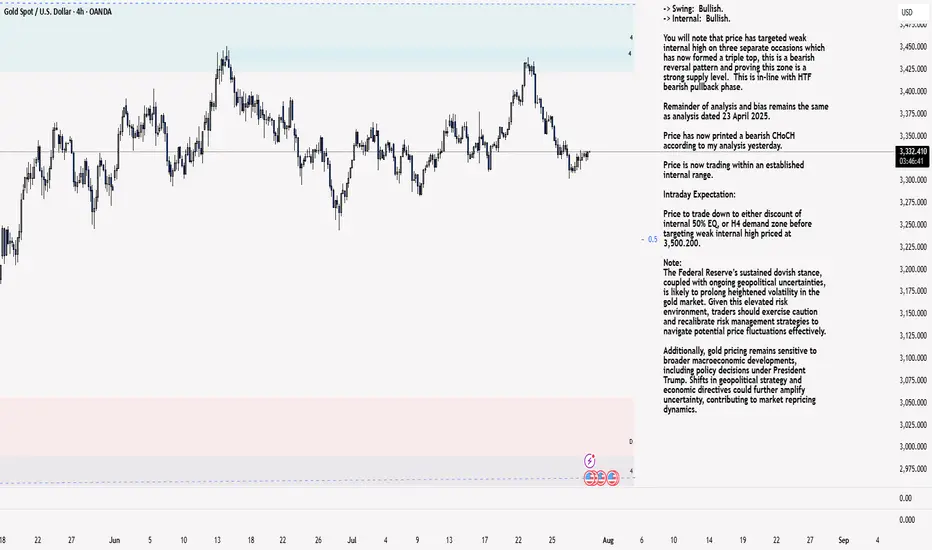
XAU/USD 30 July 2025 Intraday AnalysisH4 Analysis:
-> Swing: Bullish.
-> Internal: Bullish.
You will note that price has targeted weak internal high on three separate occasions which has now formed a triple top, this is a bearish reversal pattern and proving this zone is a strong supply level. This is in-line with HTF bearish pullback phase.
Remainder of analysis and bias remains the same as analysis dated 23 April 2025.
Price has now printed a bearish CHoCH according to my analysis yesterday.
Price is now trading within an established internal range.
Intraday Expectation:
Price to trade down to either discount of internal 50% EQ, or H4 demand zone before targeting weak internal high priced at 3,500.200.
Note:
The Federal Reserve’s sustained dovish stance, coupled with ongoing geopolitical uncertainties, is likely to prolong heightened volatility in the gold market. Given this elevated risk environment, traders should exercise caution and recalibrate risk management strategies to navigate potential price fluctuations effectively.
Additionally, gold pricing remains sensitive to broader macroeconomic developments, including policy decisions under President Trump. Shifts in geopolitical strategy and economic directives could further amplify uncertainty, contributing to market repricing dynamics.
H4: Chart:
M15 Analysis:
-> Swing: Bullish.
-> Internal: Bullish.
H4 Timeframe - Price has failed to target weak internal high, therefore, it would not be unrealistic if price printed a bearish iBOS.
The remainder of my analysis shall remain the same as analysis dated 13 June 2025, apart from target price.
As per my analysis dated 22 May 2025 whereby I mentioned price can be seen to be reacting at discount of 50% EQ on H4 timeframe, therefore, it is a viable alternative that price could potentially print a bullish iBOS on M15 timeframe despite internal structure being bearish.
Price has printed a bullish iBOS followed by a bearish CHoCH, which indicates, but does not confirm, bearish pullback phase initiation. I will however continue to monitor, with respect to depth of pullback.
Intraday Expectation:
Price to continue bearish, react at either M15 supply zone, or discount of 50% internal EQ before targeting weak internal high priced at 3,451.375.
Note:
Gold remains highly volatile amid the Federal Reserve's continued dovish stance, persistent and escalating geopolitical uncertainties. Traders should implement robust risk management strategies and remain vigilant, as price swings may become more pronounced in this elevated volatility environment.
Additionally, President Trump’s recent tariff announcements are expected to further amplify market turbulence, potentially triggering sharp price fluctuations and whipsaws.
M15 Chart:
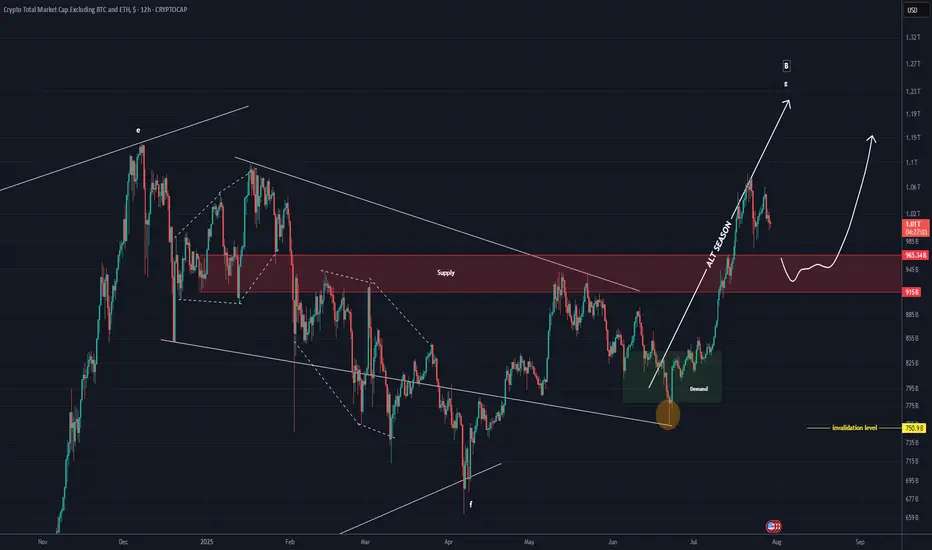
TOTAL 3 New Update (12H)This analysis is an update of the analysis you see in the "Related publications" section
This index has broken below the red zone; if a pullback to this area occurs, it may act as support again and the index could move upward
For risk management, please don't forget stop loss and capital management
Comment if you have any questions
Thank You
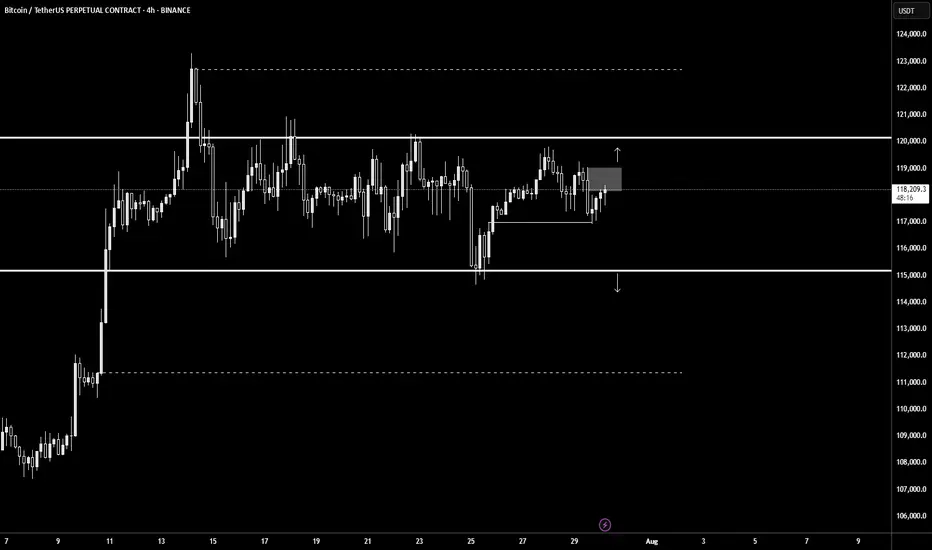
BTCUSDT.PThe best area to buy MARKETSCOM:BITCOIN is $119,000 and wait for the pullback to be complete.
But for selling and shorting, be sure to wait for $115,000 to break down.
⚠️Please control risk managements.
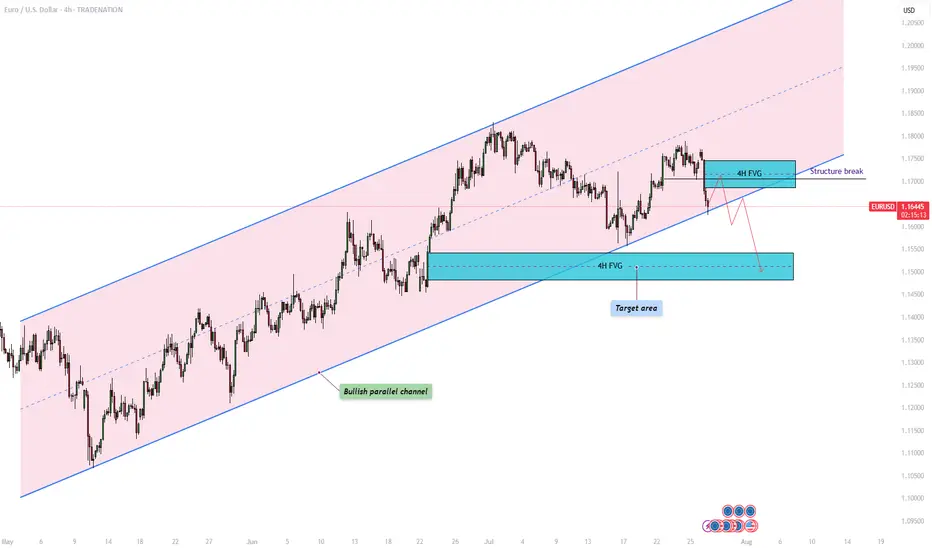
EURUSD – Will the bullish parallel channel hold?The EUR/USD currency pair is currently trading within a clearly defined bullish parallel channel, as shown on the 4-hour chart. This channel has provided consistent directional structure over recent weeks, with price respecting both its upper resistance and lower support boundaries. At present, the pair is approaching the lower end of this channel, raising the critical question: will it bounce off support and continue the bullish trajectory, or will it decisively break down, opening the door to lower price targets?
Bullish parallel channel
On the 4-hour timeframe, the EUR/USD has been consistently moving within a bullish parallel channel, characterized by higher highs and higher lows. This price structure suggests sustained upward momentum, with the top of the channel acting as dynamic resistance and the bottom as reliable support. Today, price action is testing the lower boundary of the channel once again. A successful hold at this level could confirm continued bullish structure and open the door for a potential rebound.
Bullish scenario
In the bullish scenario, the EUR/USD holds its ground at the support region around 1.164, where the lower boundary of the channel intersects with price. For upward continuation, it must overcome the short-term resistance posed by the 4-hour Fair Value Gap (FVG) between 1.169 and 1.174. A reclaim and close above this zone could signal a shift in short-term momentum and lead to a move back toward the upper boundary of the channel. However, the path upward is not without resistance , price must navigate through potential supply zones and maintain higher lows to preserve the bullish structure.
Bearish scenario
On the other hand, a break and close below the channel support could indicate a change in market sentiment and invalidate the bullish pattern. In this bearish case, we would expect a structure break confirmation followed by a possible retest of the broken trendline and the 4-hour FVG. If this retest fails to reclaim the trendline, bearish continuation becomes more likely. The next significant area of interest lies around the 1.150 level, where a bullish 4-hour FVG exists. This zone could act as a potential short-term support and serve as a target for the downside move before any meaningful bounce occurs.
Final thoughts
The EUR/USD pair is currently at a technical crossroads. Traders should watch closely for price behavior around the lower channel boundary to determine whether bullish momentum will resume or whether a bearish breakout will set the tone for deeper retracement. Confirmation, either through a bounce or a breakdown with a retest, will be key in validating the next directional move.
-------------------------
Disclosure: I am part of Trade Nation's Influencer program and receive a monthly fee for using their TradingView charts in my analysis.
Thanks for your support. If you enjoyed this analysis, make sure to follow me so you don't miss the next one. And if you found it helpful, feel free to drop a like 👍 and leave a comment 💬, I’d love to hear your thoughts!
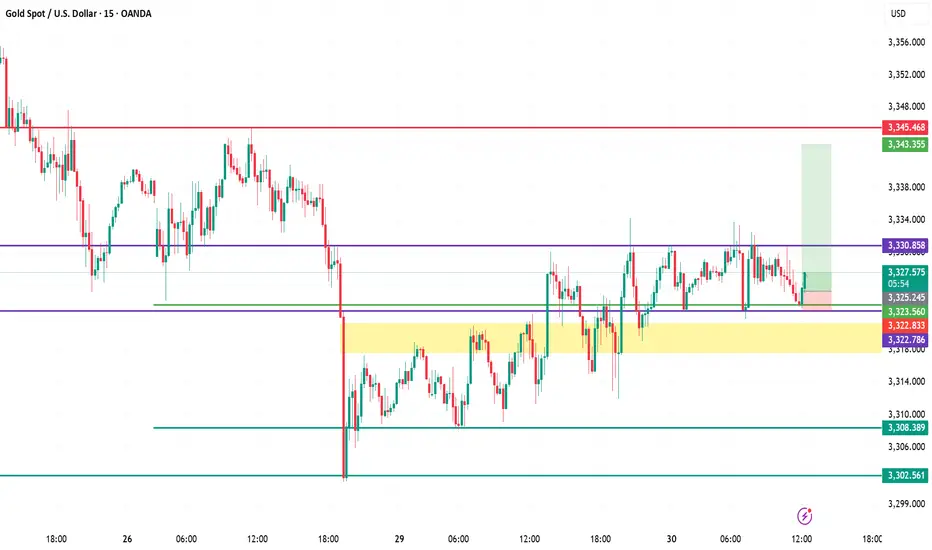
XAUUSD (Gold) Analysis – July 30, 2025 | 15-Min ChartStructure & Context
Gold is consolidating just above the key intraday support of $3,323, following a bounce from the high-demand zone ($3,322–$3,323.5).
Demand Zone Validity
The yellow zone has consistently attracted buyers, defending it multiple times with sharp rejections. This confirms it as a short-term demand base.
Resistance Still Capping Upside
$3,330.85 acts as immediate resistance. Price has failed to close above it despite several wicks testing this zone — showing strong seller presence.
Scalp Long Idea In Play
A buy setup is in motion with entry near $3,323.5, stop below $3,322, and target at $3,337.5. Risk-to-reward remains favorable while above demand.
Critical Levels to Watch
Support: $3,322.8 → $3,308.3 → $3,302.5
Resistance: $3,330.8 → $3,337.5 → $3,345.4
🎯 Bias: Bullish above $3,322, bearish if broken.
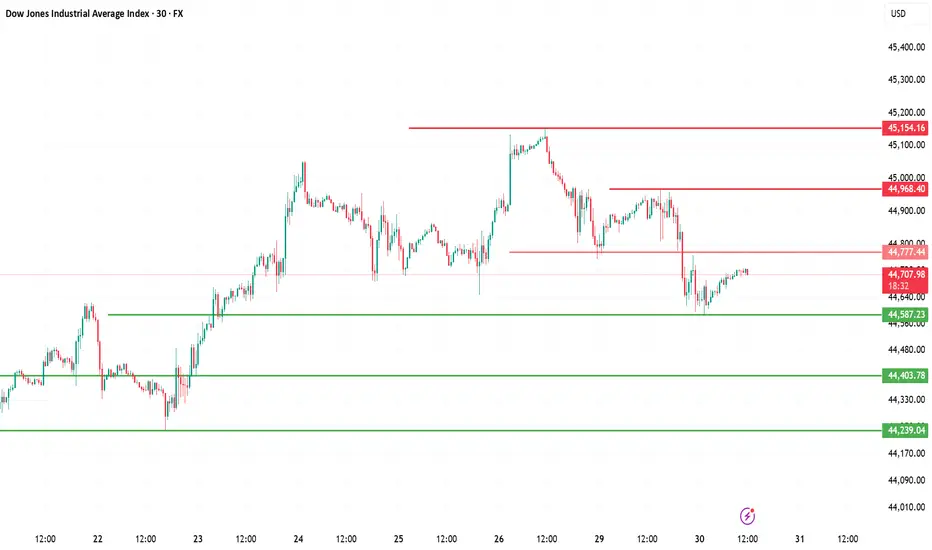
Dow Jones Index (DJI) – July 30, 2025 | 30-Min Chart Analysis
1. Current Market Structure
DJI is consolidating just below the intraday resistance at 44,777. Price is attempting to recover after a sharp drop from the 45,154 high.
2. Supply Zone Rejection
Price faced strong rejection near 45,154 and again at 44,968 — confirming this area as an active seller zone.
3. Support Zone Defense
Buyers stepped in at 44,587 and 44,403, creating a short-term demand base. These levels have provided stability for now.
4. Trend Outlook
The lower high formation and recent sharp sell-off hint at bearish pressure. Price is currently in a retracement — unless 44,968 breaks cleanly, sellers remain in control.
5. Key Levels to Watch
Resistance 44,777 → 44,968 → 45,154
Support 44,587 → 44,403 → 44,239
🔁 Bias: Short-term bearish unless price breaks above 44,968 and holds.
USDT DOMINANCE Update (2H)After losing important levels, the price has now started to pull back, and it seems that some of the market’s major players have taken profits.
On the chart, the price faces two key levels ahead, from which it could be rejected at either one.
There is also a possibility that the price will reach the key level zone.
We are waiting for the reaction to these levels.
A daily candle close above the invalidation level will invalidate this analysis.
For risk management, please don't forget stop loss and capital management
Comment if you have any questions
Thank You

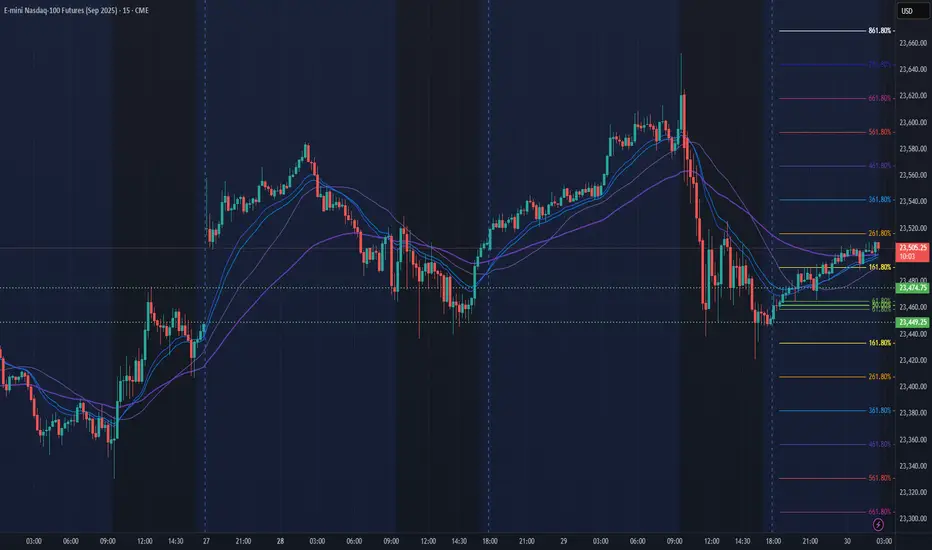
NQ Power Range Report with FIB Ext - 7/30/2025 SessionCME_MINI:NQU2025
- PR High: 23474.75
- PR Low: 23449.25
- NZ Spread: 57.0
Key scheduled economic events:
08:15 | ADP Nonfarm Employment Change
08:30 | GDP
10:30 | Crude Oil Inventories
14:00 | FOMC Statement
- Fed Interest Rate Decision
14:30 | FOMC Press Conference
AMP temp margins increase anticipating vol spike for economic events
Session Open Stats (As of 12:25 AM 7/30)
- Session Open ATR: 232.98
- Volume: 16K
- Open Int: 281K
- Trend Grade: Long
- From BA ATH: -0.6% (Rounded)
Key Levels (Rounded - Think of these as ranges)
- Long: 23811
- Mid: 22096
- Short: 20383
Keep in mind this is not speculation or a prediction. Only a report of the Power Range with Fib extensions for target hunting. Do your DD! You determine your risk tolerance. You are fully capable of making your own decisions.
BA: Back Adjusted
BuZ/BeZ: Bull Zone / Bear Zone
NZ: Neutral Zone
could continue to trendI am still fairly new to trading. It took my quite some time to analyze this chart, it was a trend, then it became a ranged market. I had difficulty finding a support, however, i did find my middle support, it is the black line, it could possible drop there, or, it would stay in my green support

JPY at Key Zone – EURJPY & GBPJPY Could Drop 1k+ PipsExactly one year ago, the JPY Currency Index broke above the falling trendline of a falling wedge, signaling the end of a bearish cycle that had lasted nearly five years.
As is typical after long-term reversals, the reaction was sharp and fast, and the price quickly reached the first resistance target of the pattern.
Since then, the index entered a lateral phase, with clear support forming around the 730 zone.
________________________________________
🔍 Current Price Action
Recently, the price pulled back to test that same support, and at the time of writing it sits at 737, forming a tight consolidation.
This suggests we’re again at an inflection point.
________________________________________
📊 Trade Outlook
From a medium-term perspective, I believe the index is preparing for another leg higher, potentially toward resistance at 780.
➡️ That would mean a 7% rise on the JPY Index – and this move could translate into more than 1,000 pips of downside for pairs like EURJPY and GBPJPY.
________________________________________
🔄 What’s Next?
In the coming sessions, I’ll focus on these two pairs as they offer the clearest setups and have the strongest volatility.
Stay tuned — follow for the next updates. 🚀

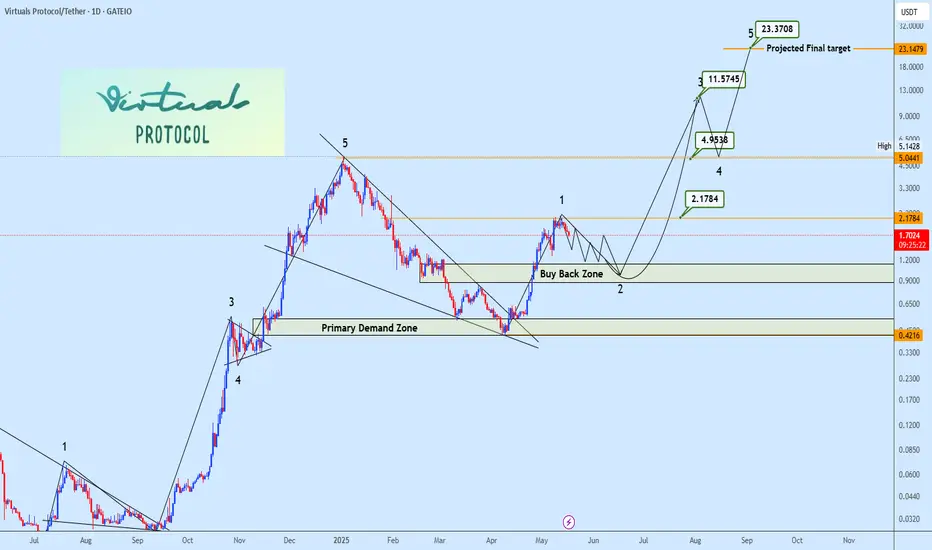
VIRTUAL PROTOCOL Wave 2 Correction in Play After 4x ImpulseFollowing the completion of its previous cycle correction, Virtual Protocol confirmed a bullish reversal via a breakout from a falling wedge, initiating Impulse Wave (1) with an impressive ~4x move. Current price action signals the commencement of Wave (2) corrective structure, aligning with standard Elliott Wave Theory post-impulsive behavior.
The buy-back zone (highlighted on chart) represents the high-probability retracement region based on Fib confluence (0.5–0.618 retracement levels) and prior structural support.
Wave (3) and Wave (5) targets are projected using Fibonacci extensions and historical momentum analogs. Eyes remain on the buy-back zone for optimal re-entry.
XAUUSD 5M SUPPLY SETUPDuring the Asia-to-London session, price was in a clear uptrend, printing higher highs. However, in the pre-New York session, momentum shifted , price failed to break the recent high and instead formed a new low, eventually breaking structure with a lower low and confirming a trend reversal. This move left a clean supply zone behind. Price later retraced to that supply zone and showed strong rejection with a clear wick reaction, signaling potential selling pressure. I waited for the candle break and entered short, placing stops above the highest wick within the zone. Targeted a 1:2 R:R. Price consolidated briefly but eventually hit target, securing profits and wrapping up the session with discipline and precision.

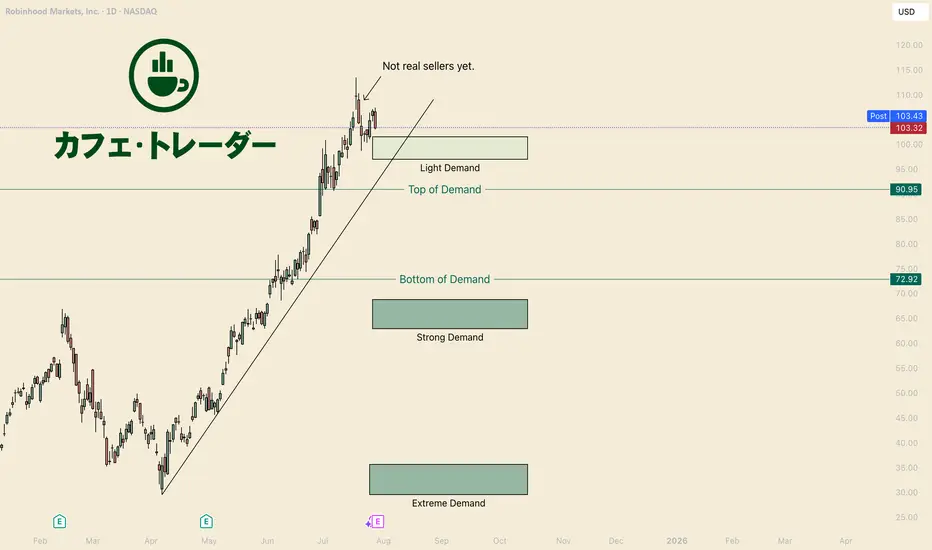
How to Buy HoodHello I am the Cafe Trader.
Since visiting that Extreme Demand back in April, Robinhood has essentially moved strait up.
If you have not seen my previous post on HOOD, we were able to identify EXACTLY where the buyers were. I strongly encourage you take a look at that article.
Today I'm going to give you a Short Term and Long Term perspective.
Short Term
What we do Know
"Light Demand" have the most aggressive Bulls, but we have to assume that they are the most fragile .
We know this selling hasn't been shown to be an aggressive Bear yet. This also assumes there is no reason to short this until sellers gain some control.
1) With these things in mind: Until the trend breaks or bears close below the "Light Demand" zone, II find no reason, and would even say its daring to short HOOD.
2) Yes it's overextended when it comes to a channel, a fib, an MA... No one can confidently tell you where the top is. Unless you are looking at the footprint seeing an absurd amount of absorption IMO.
With these things in mind, all I can say is to be patient, and wait for the market to give you more information that you can do something with.
Day Traders like myself will have the best odds to make intra-day plays, but that's not this articles focus.
Long Term
If you got in early and you are still holding, Great work!
for those who feel like they missed the move, or are looking to add some to your long term, don't worry we are position you for success.
This list of areas is according to your personal sentiment. The "Good Price" is where I think they best position is going to be.
Hyper Aggressive = 97.50 - 101.50 (Light Demand)
Aggressive = 91 (Top of Demand)
Good Price = 62 - 68.5 (Strong Demand)
STEAL = 31.50-36.50 (Extreme Demand)
Exciting times for HOOD! I am bullish myself, and I hope to see better and bigger things from Robinhood.
Thank you for reading, Follow for more evaluations and live trades.
Happy Trading!
@thecafetrader
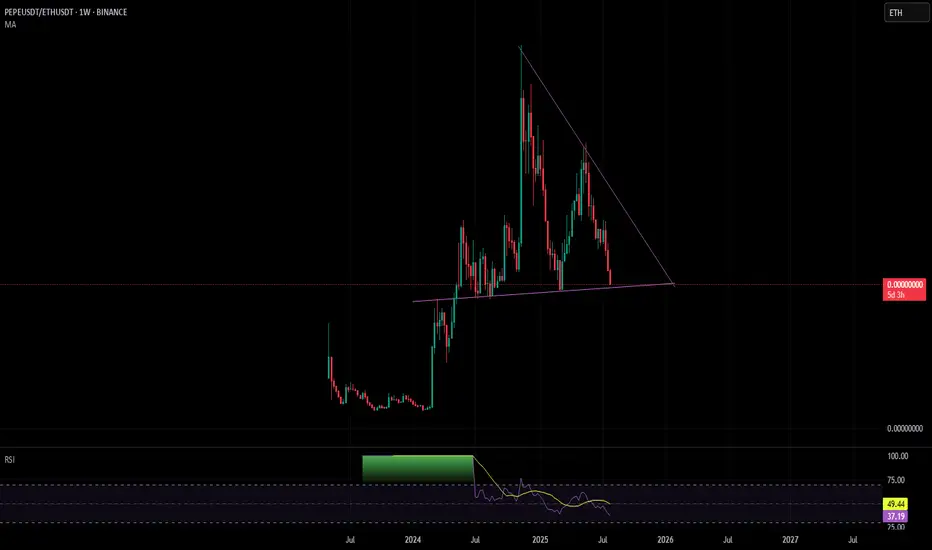
PEPE/ETH Weekly longPEPE against ETH is nearing a nice support level,
I will buy PEPE here and sell it at the tops against ETH to gain more ETH
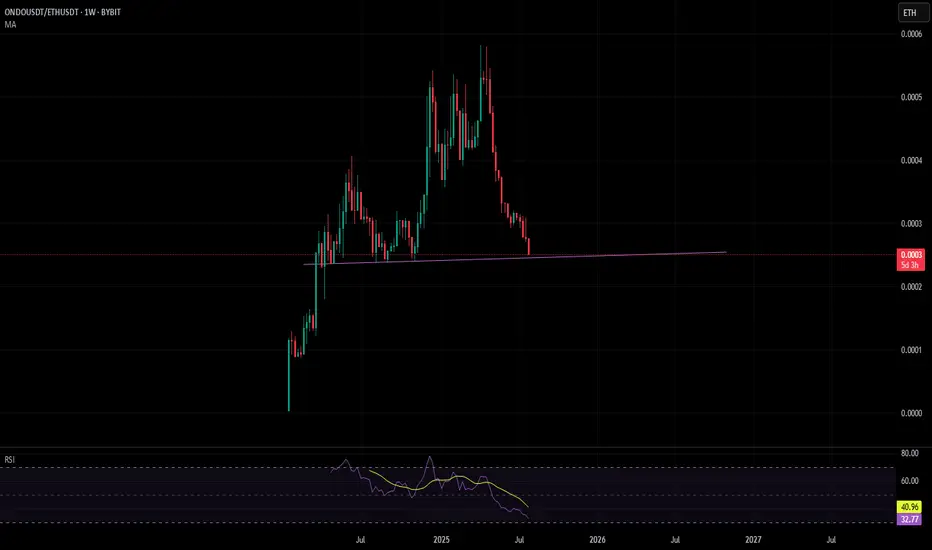
ONDOETH WeeklyOndo-ETH is nearing a nice clean support level.
I will buy ondo here and sell it at the top against ETH
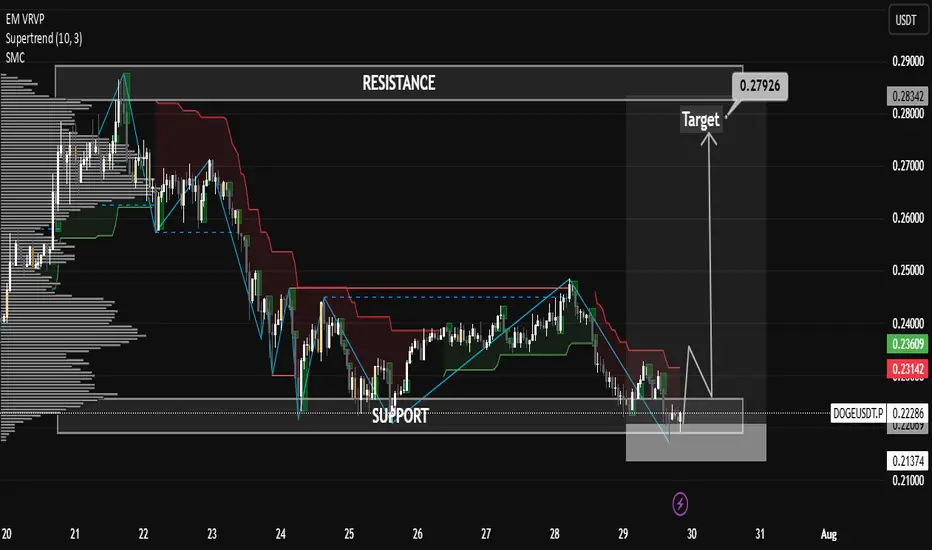
DOGE Looking Strong as Support HoldsDOGE Looking Strong as Support Holds
🔹 1. Support Zone Validated
The chart shows Dogecoin retested the lower boxed region around $0.221–$0.223, and bounced sharply from that zone. Given the heavy spike in volume during the retest, this suggests aggressive buying and accumulation—a hallmark of bullish conviction.
CryptoRank
The Tradable
🔹 2. Fibonacci 0.618 Support Bounce
On the 4‑hour timeframe, DOGE held firm above the critical Fibonacci 61.8% retracement level, and delivered a strong rebound—indicating technical significance and buyer interest at this level.
Blockchain News
🔹 3. Double-Bottom + Trendline Breakout
Analysts have identified a classic double-bottom formation, with price clearing the neckline (~$0.230–$0.231) and then retesting it successfully. Holding this retest confirms a breakout, suggesting more upside ahead.
Crypto Basic
🔹 4. Whale Activity & Accumulation
On-chain data shows $250 million in Dogecoin accumulation by whales, especially around the support zone—creating a structural demand base and reinforcing the bullish setup.
CoinCentral
🎯 Price Targets & Key Levels
Scenario Levels Rationale
Bullish continuation $0.239–$0.241 union resistance First resistance zone—price must reclaim to continue bullish momentum
$0.260–$0.280 Reclaiming $0.241 could open room toward mid‑channel resistance or prior highs
$0.300+ Potential target if momentum sustains and broader breakout occurs
Bearish invalidation $0.223 support Invalid break below suggests fading momentum—risk of correction to $0.215–$0.218
$0.215–$0.218 Secondary support zone if expansion of sell side continues
⚙️ Trade Setup for a Bullish Bias
Entry Focus: Consider entering long near $0.223 if price retests and holds, with a tight stop just below support.
Stop-Loss Zone: Slightly beneath $0.221 to account for volatility.
Targets: Scale out around $0.241, with larger targets at $0.260–$0.280, and possibly $0.30+ on sustained strength.
Confirmation: Watch for rising volume, break and close above resistance zones, and bullish indicator alignment.
⚡ Market Sentiment & Broader Themes
Momentum Shift: A bearish retrace reversed quickly amid accumulation, suggesting strong buyer commitment.
CryptoRank
The Tradable
AInvest
Double Bottom Status: Analyst commentary supports a reversal setup, with targets toward $0.310–$0.46 if the neckline holds.
Crypto Basic
AInvest
CryptoRank
Macro View: DOGE remains within a bullish channel; some forecasts project