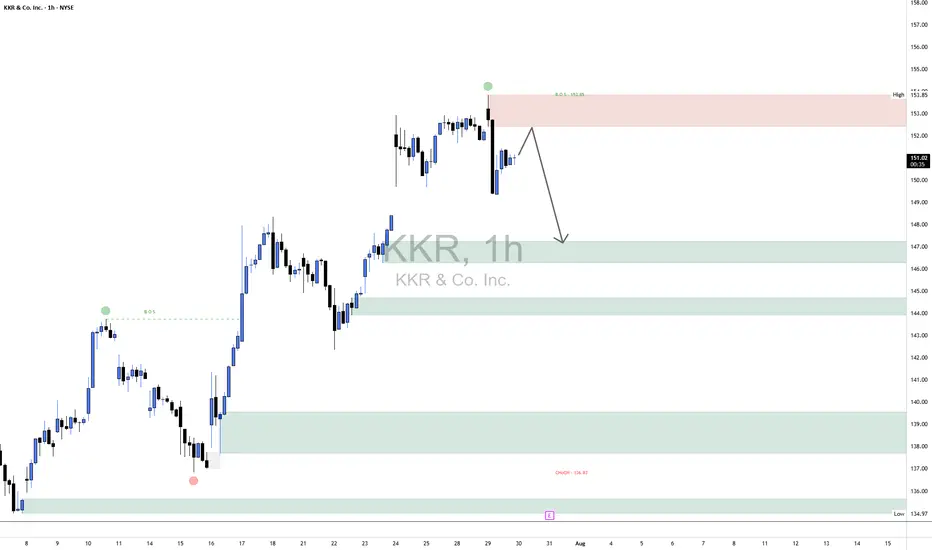
KKR Short1. Market Structure Context
Trend Prior to CHoCH: Bullish structure with higher highs and higher lows.
CHoCH (Change of Character): Occurred at $136.83 — a key higher low broke, indicating a possible trend reversal from bullish to bearish.
BOS (Break of Structure): Confirmed at $153.85, marking a shift to lower highs and supporting bearish continuation.
2. Key Supply & Demand Zones
🟥 Supply Zone (Resistance):
$153.05 – $153.85
Price previously distributed here before dropping.
Acts as a liquidity trap for late buyers and resistance for pullbacks.
🟩 Demand Zones (Support):
Zone 1: $147.00 – $148.00 → Minor demand; short-term reaction likely.
Zone 2: $144.50 – $146.00 → Historical pivot with volume; moderate demand.
Zone 3: $138.00 – $142.00 → Consolidation base; strong prior bullish impulse.
Zone 4: $134.00 – $137.00 → Final defense; includes the CHoCH at $136.83 and expected reaction if deeper retracement occurs.
3. Current Price Action (Bordered Region Focus)
Price currently trades around $151.06, beneath the key supply zone.
The market rejected supply and showed a bearish reaction.
Expectation: A pullback to ~$153 may occur, targeting trapped liquidity, before resuming bearish movement.
Next targets:
Primary: $147.50 (Demand Zone 1)
Secondary: $144.50 if breakdown intensifies.
Supply and Demand
XLU Long1. Market Structure Overview
A notable Change of Character (CHoCH) occurred at 84.09, breaking below a prior higher low and signaling a shift from bullish to bearish momentum. This was followed by a clear Break of Structure (BOS) at 83.40, confirming the bearish sentiment and initiating a new lower low sequence.
2. Supply and Demand Zones
Supply Zones (Resistance):
85.00–85.55: Strongest supply zone where multiple bearish rejections originated.
84.75–85.00: Closest overhead supply zone—price is expected to react if it reaches this area.
Demand Zones (Support):
84.00–84.20: Local demand that initiated the recent bullish push; possible short-term support.
83.10–83.40: Major demand zone that sparked the latest upward move; strong buyer interest observed.
3. Current Price Action & Expectation
Price is currently trading at 84.46, moving upward from the 84.00–84.20 demand zone. The near-term outlook suggests a continued push toward the 84.75–85.00 supply zone. If price can decisively break above 84.99, bullish momentum could extend toward 85.30–85.55.
However, if price rejects from 84.75–85.00, a pullback into 84.00–84.20 is expected before another attempt higher. A breakdown below 84.00 would open downside risk toward the stronger demand at 83.10–83.40.
4. Momentum & Risk Outlook
Momentum is gradually shifting bullish after forming a swing low near 83.40. Maintaining structure above that level is crucial for a bullish continuation. Watch for a clean break and retest of the CHoCH level at 84.99 to confirm strength.

GOLD XAUUSD Gold moving as expected respecting our price and entries, will look for swinging opportunities ,and SL adjustments to BE
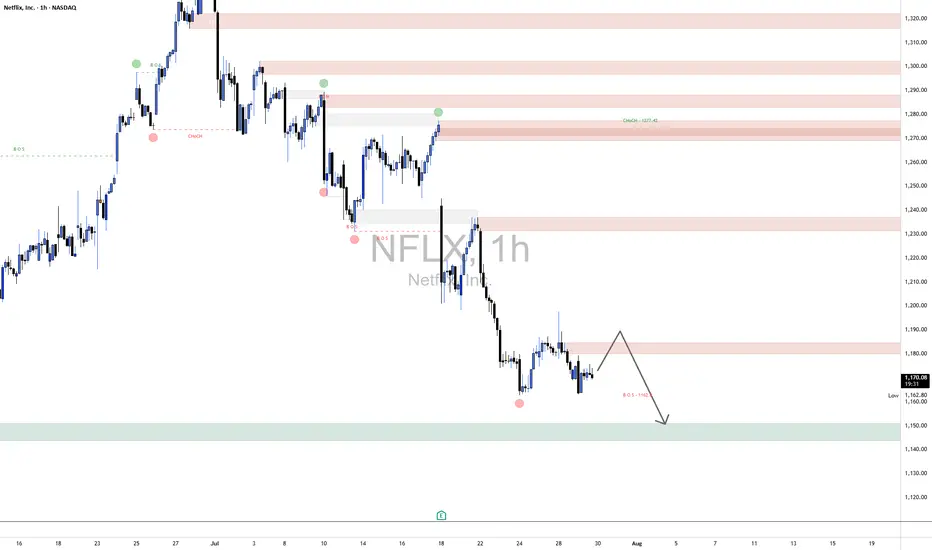
NFLX Short1. Market Structure Overview
The broader market structure has shifted bearish following a Change of Character (CHoCH) around 1277.42, where price broke below a prior higher low, suggesting a possible trend reversal. This was later confirmed by multiple Breaks of Structure (BOS) at lower levels, especially the key BOS at 1162.8, which solidified bearish intent. Each BOS has been followed by continued selling, showing strong bearish momentum and weakening buyer control.
2. Supply and Demand Zones
Several major supply zones (resistance) are present, especially at 1340–1330, 1300–1290, 1277–1260, and most immediately at 1185–1175, where price is currently reacting. These zones have previously shown strong rejections and are likely to cap bullish retracements.
On the demand side (support), the primary demand zone lies at 1130–1110, which acted as a prior accumulation base. A deeper demand area also exists near 1100–1090, which could serve as a last-resort support if price breaks lower.
3. Price Action Within Key Border
Currently, price is hovering around 1173.99, inside the lower supply zone of 1185–1175. The structure suggests a potential short-term retracement to this zone before continuation lower. If price rejects here again, the expectation is for a move toward the 1130–1110 demand zone. However, a strong breakout and hold above 1185 could open the path for retesting higher supply levels like 1225–1245.
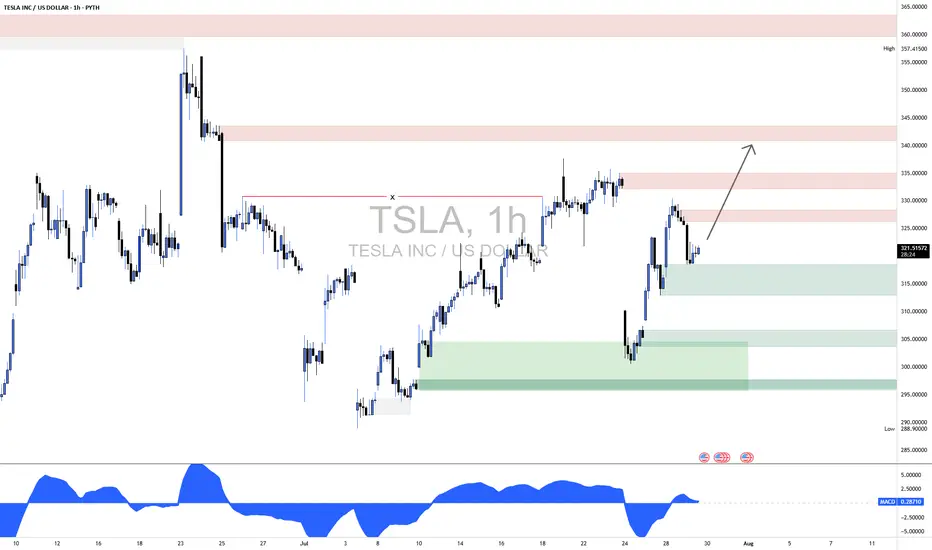
TSLA Long1. Market Structure Overview
1.1 Previous High Sweep (Fakeout) – ~357.41
Price made a strong push above previous highs but was sharply rejected.
Indicates potential liquidity grab and institutional selling.
1.2 Change of Character (CHoCH) – ~333
Price broke below the previous higher low structure, signaling the end of bullish momentum.
Marks a bearish shift after an extended uptrend.
1.3 Break of Structure (BOS) – ~317
Confirms bearish continuation after CHoCH.
Price closed below support, validating the downtrend.
2. Supply & Demand Zones
2.1 Supply Zones (Resistance)
Zone A (343–357)
Major Supply from the last distribution before the drop.
High volume selling occurred; strong resistance expected.
Zone B (328–336)
Local Supply formed after CHoCH.
Price may react here before testing higher levels.
2.2 Demand Zones (Support)
Zone C (315–319)
Price bounced from here twice; active buyer interest.
Critical zone for near-term bullish continuation.
Zone D (299–306)
Strong Demand and origin of the last large impulse up.
Institutional footprints likely; strong support if retested.
3. Price Action Analysis (Inside Bordered Region)
Current Price (~321.68) is rebounding from Zone C.
Price is forming higher lows intraday, showing bullish intent.
Expected Move:
Short-term bounce toward Zone B (328–336).
If sellers overpower, potential reversal from this supply.
If buyers maintain momentum and break above Zone B, move toward Zone A (343–357) is likely.
4. Momentum & Confirmation
MACD on the 1-hour shows a bullish crossover, suggesting short-term buying pressure.
Structure remains bearish to neutral unless price closes above 336.
A break and hold above 336 would shift bias back to bullish continuation.
5. Financial Context Supporting Price Zones
Recent Tesla Catalysts (July 2025):
Earnings Reported July 24: Mixed results. Strong delivery numbers but concerns about margins due to price cuts.
Investor Sentiment: Divided. Some bullish based on long-term EV growth; others cautious due to margin compression.
Macroeconomic Factors:
Fed policy indecision is increasing volatility.
Tech-heavy indexes (like Nasdaq) are pulling back slightly, causing large-cap techs to see choppy moves.
These events support the supply zone near 328–336 acting as resistance until new bullish data or technical breakouts occur.
GRTUSDT Triangle Coil Tension Builds Bullish Breakout in FocusGRTUSDT is forming a clean symmetrical triangle with price rebounding from the lower trendline which brings an encouraging signal for potential continuation to the upside.
As long as the structure holds, we anticipate a breakout above the triangle, which could ignite strong bullish momentum. The external demand zone remains ideal for strategic accumulation, while the internal supply area should be monitored for signs of short-term rejection.
If buyers absorb pressure at that level, GRT could rally toward the crucial upper supply zone, which marks the next major area for distribution. Let’s see how this unfolds, feel free to share your perspective.

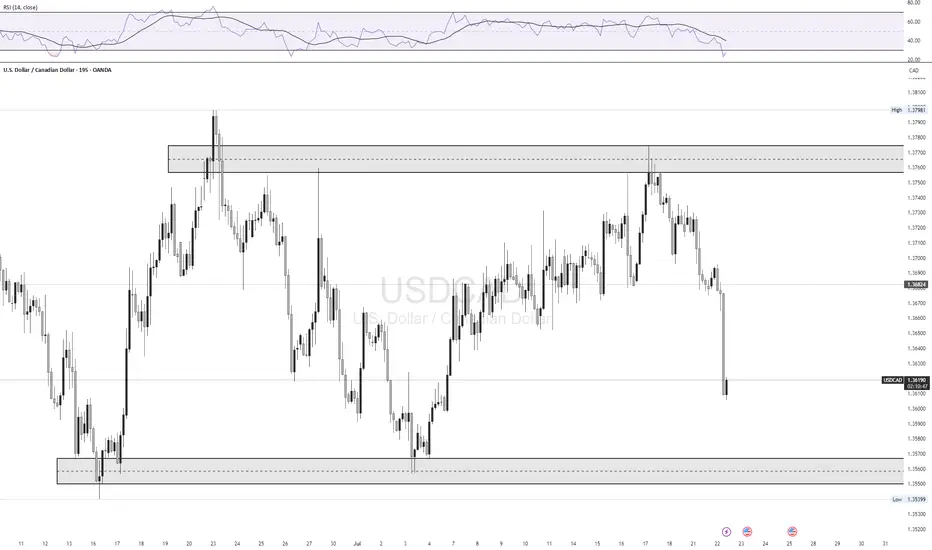
USD/CAD LongLooking for a retest of 1.35600 zone for a bounce back up to 1.37650 supply zone
FX:USDCAD
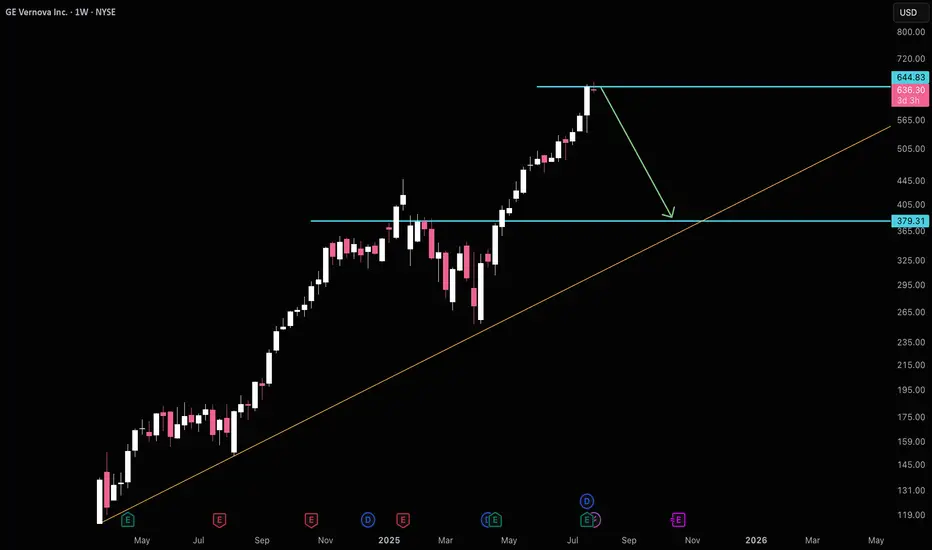
GEV High Risk $380GEV has a high risk of $380 at the moment. Obviously don't bet against the trend, especially while the S&P still has a lot of room to run, but it's an easy area to open some insurance for a potential fall to $380.
Good luck!
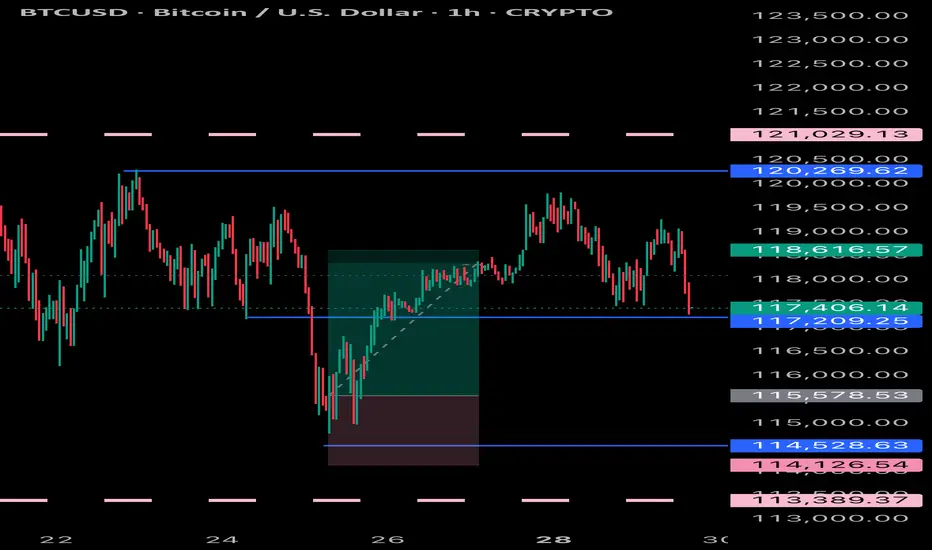
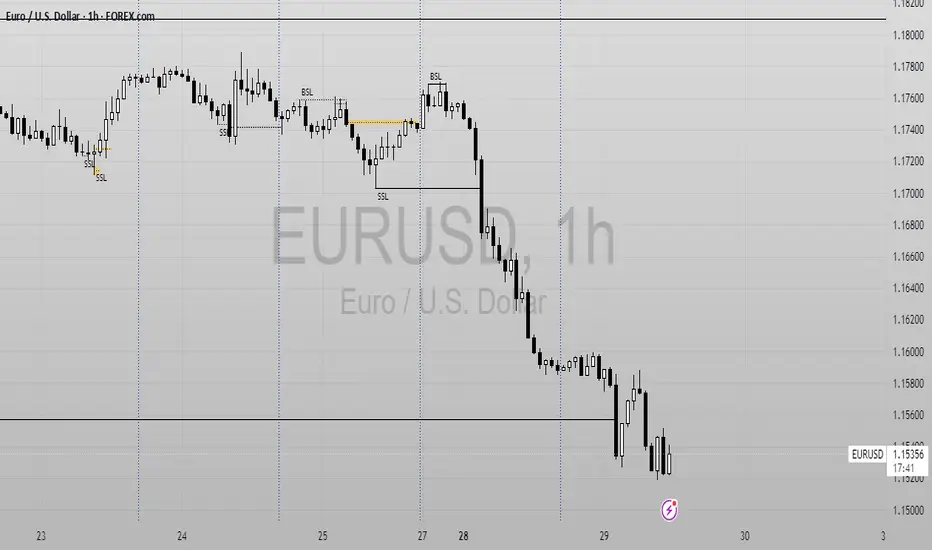
Where to next for EURUSD? With Monday's opening, we saw price sell off at a great force and attacked the previous week's low, taking it out, with short term liquidity taken, will price reverse and start moving up or is there no end in sight for this bearishness?
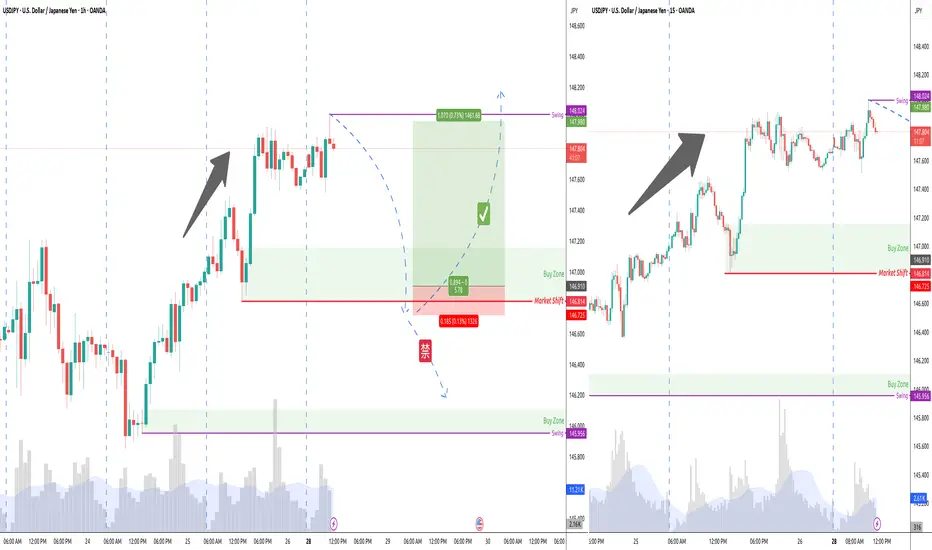
USDJPY 60/15 Pullback LongOverall bull trend. Waiting for pullback. If it pass the market shift and stay below, no go. Else will wait for long singal to go long.
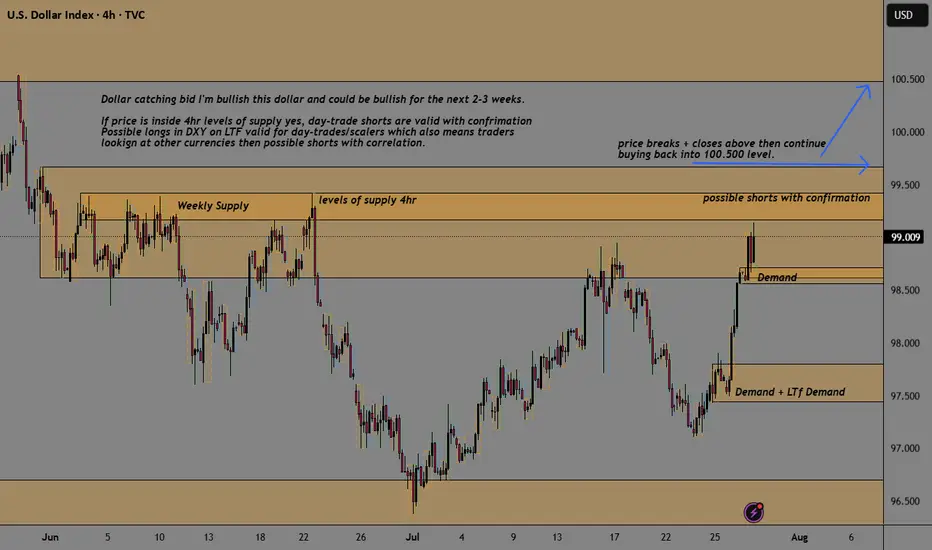
DXY Buyers Catching BidSee chart for analysis but even with price sitting inside levels of supply, we could easily see stronger Fundamentals coming out to drive this dollar back up into 100.5 areas of monthly supply. Short-term I remain bullish with long term views to the downside.
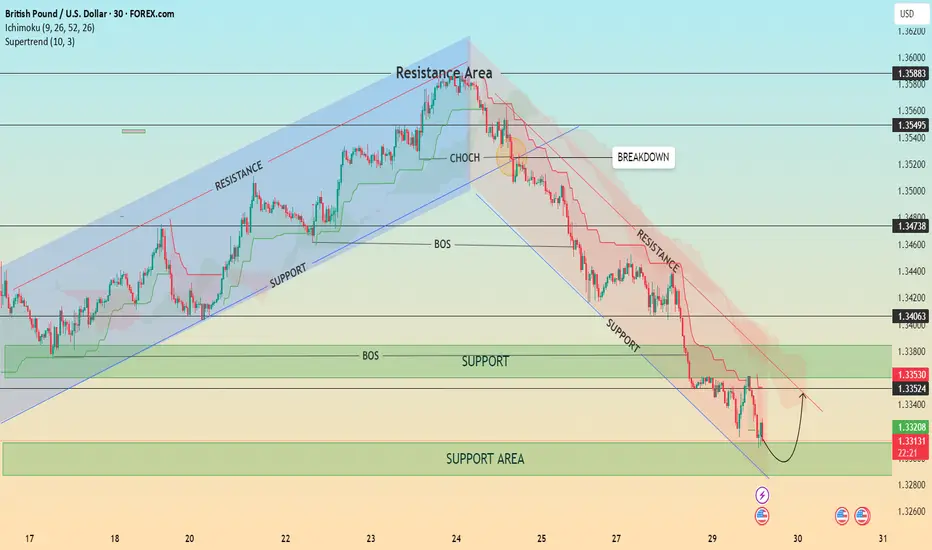
GBP/USD – Bearish Structure with Possible Short-Term Pullback📊 GBP/USD – Bearish Structure with Possible Short-Term Pullback
Timeframe: 30-Minute | Date: July 29, 2025
Price action recently broke down from a well-respected ascending channel, confirming a shift in market structure with a Change of Character (CHOCH) followed by a Break of Structure (BOS). Since then, GBP/USD has been respecting a descending trend channel, forming consistent lower highs and lower lows.
🔍 Current Setup:
Price is testing a major support area around 1.3300–1.3320.
A minor pullback is expected as indicated by the bullish wick rejections.
However, the overall bias remains bearish unless we break and hold above the 1.3353–1.3406 resistance zone and the descending trendline.
The Ichimoku Cloud and Supertrend both show bearish momentum.
📈 Potential Scenario:
Price may bounce from the support area and retest the upper boundary of the descending channel before resuming the bearish trend.
⚠️ Key Levels to Watch:
Resistance: 1.33530 / 1.34063 / 1.34738
Support: 1.33200 / 1.33000
💡 Structure Notes:
CHOCH = Trend Reversal Signal
BOS = Confirmation of Downtrend
Cloud = Dynamic Resistance
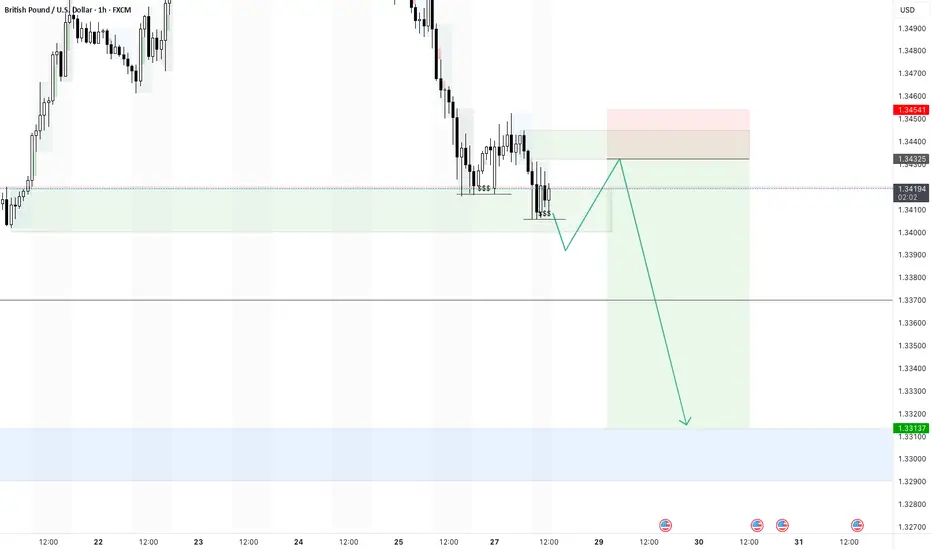
GBPUSD - 28/7/25 - Bearish continuationI do have a bullish trade open current from this zone, but will move the SL to breakeven or take a small loss.
The new idea if the equal low liquidity is swept is to take a bearish trade as shown.

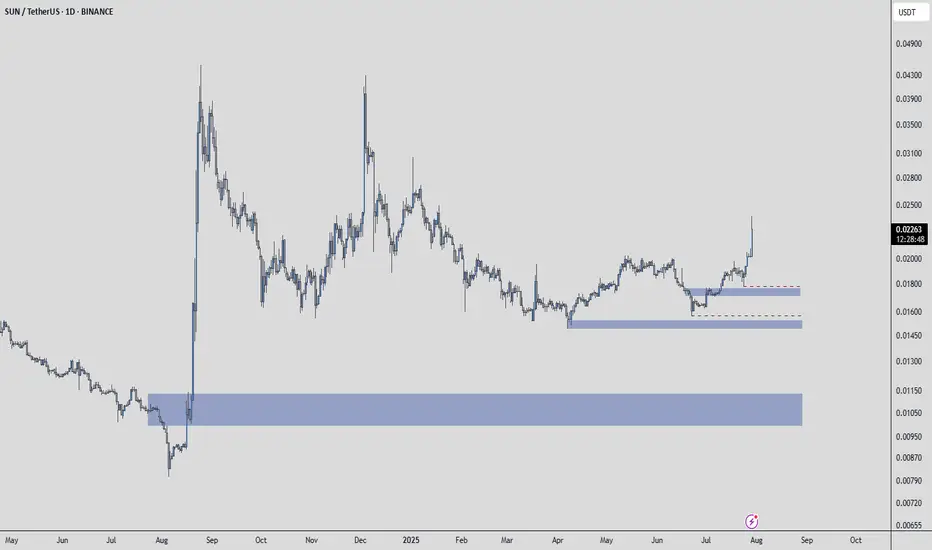
SUNUSDT – One Chart, Three Opportunities☀️ In SUN/USDT, three distinct blue box zones stand out. Each offers its own kind of opportunity — but only if you approach them with structure and discipline.
🎯 Here's How to Use Them
📍 Zone 1 → potential for short-term gains
📍 Zone 2 → better suited for medium-term positioning
📍 Zone 3 → promising long-term risk:reward
But don’t place blind orders — instead:
✅ Set alerts for each zone
✅ When price reaches one, switch to 1H chart
✅ Look for an upward breakout
✅ Confirm with positive & rising CDV
If these conditions align, then — and only then — execute a trade.
"The market pays those who are patient and prepared — not those who guess."
Without confirmation, you're trading hope, not setup.
Let’s stay smart. Let’s stay strategic.
UmutTrades 💙
📌I keep my charts clean and simple because I believe clarity leads to better decisions.
📌My approach is built on years of experience and a solid track record. I don’t claim to know it all but I’m confident in my ability to spot high-probability setups.
📌If you would like to learn how to use the heatmap, cumulative volume delta and volume footprint techniques that I use below to determine very accurate demand regions, you can send me a private message. I help anyone who wants it completely free of charge.
🔑I have a long list of my proven technique below:
🎯 ZENUSDT.P: Patience & Profitability | %230 Reaction from the Sniper Entry
🐶 DOGEUSDT.P: Next Move
🎨 RENDERUSDT.P: Opportunity of the Month
💎 ETHUSDT.P: Where to Retrace
🟢 BNBUSDT.P: Potential Surge
📊 BTC Dominance: Reaction Zone
🌊 WAVESUSDT.P: Demand Zone Potential
🟣 UNIUSDT.P: Long-Term Trade
🔵 XRPUSDT.P: Entry Zones
🔗 LINKUSDT.P: Follow The River
📈 BTCUSDT.P: Two Key Demand Zones
🟩 POLUSDT: Bullish Momentum
🌟 PENDLEUSDT.P: Where Opportunity Meets Precision
🔥 BTCUSDT.P: Liquidation of Highly Leveraged Longs
🌊 SOLUSDT.P: SOL's Dip - Your Opportunity
🐸 1000PEPEUSDT.P: Prime Bounce Zone Unlocked
🚀 ETHUSDT.P: Set to Explode - Don't Miss This Game Changer
🤖 IQUSDT: Smart Plan
⚡️ PONDUSDT: A Trade Not Taken Is Better Than a Losing One
💼 STMXUSDT: 2 Buying Areas
🐢 TURBOUSDT: Buy Zones and Buyer Presence
🌍 ICPUSDT.P: Massive Upside Potential | Check the Trade Update For Seeing Results
🟠 IDEXUSDT: Spot Buy Area | %26 Profit if You Trade with MSB
📌 USUALUSDT: Buyers Are Active + %70 Profit in Total
🌟 FORTHUSDT: Sniper Entry +%26 Reaction
🐳 QKCUSDT: Sniper Entry +%57 Reaction
📊 BTC.D: Retest of Key Area Highly Likely
📊 XNOUSDT %80 Reaction with a Simple Blue Box!
📊 BELUSDT Amazing %120 Reaction!
📊 Simple Red Box, Extraordinary Results
📊 TIAUSDT | Still No Buyers—Maintaining a Bearish Outlook
📊 OGNUSDT | One of Today’s Highest Volume Gainers – +32.44%
📊 TRXUSDT - I Do My Thing Again
📊 FLOKIUSDT - +%100 From Blue Box!
📊 SFP/USDT - Perfect Entry %80 Profit!
📊 AAVEUSDT - WE DID IT AGAIN!
I stopped adding to the list because it's kinda tiring to add 5-10 charts in every move but you can check my profile and see that it goes on..
BANANAS31USDT – Smart Entries, Not Chasing Pumps🍌 BANANAS31USDT – Smart Entries, Not Chasing Pumps
Although price has seen a remarkable rise, I believe the uptrend could still have fuel left in the tank.
I’ve marked two blue boxes as potential entry zones. These are not magic reversal levels — they’re simply areas where I’m willing to observe and possibly take action.
🎯 My Strategy
When price reaches a blue box:
I switch to the 5-minute chart
I watch for an upward breakout
I confirm with a rising CDV (Cumulative Delta Volume)
If it all aligns, I spend one bullet — just one, not the whole magazine. Risk is managed, emotion stays out.
These entries might not flip the market, but they can deliver solid, smart profits if executed with discipline.
“You don’t win by predicting the market — you win by preparing for it.”
As always, don’t chase, don’t rush.
Wait for the plan to meet the price.
— UmutTrades 💙
📌I keep my charts clean and simple because I believe clarity leads to better decisions.
📌My approach is built on years of experience and a solid track record. I don’t claim to know it all but I’m confident in my ability to spot high-probability setups.
📌If you would like to learn how to use the heatmap, cumulative volume delta and volume footprint techniques that I use below to determine very accurate demand regions, you can send me a private message. I help anyone who wants it completely free of charge.
🔑I have a long list of my proven technique below:
🎯 ZENUSDT.P: Patience & Profitability | %230 Reaction from the Sniper Entry
🐶 DOGEUSDT.P: Next Move
🎨 RENDERUSDT.P: Opportunity of the Month
💎 ETHUSDT.P: Where to Retrace
🟢 BNBUSDT.P: Potential Surge
📊 BTC Dominance: Reaction Zone
🌊 WAVESUSDT.P: Demand Zone Potential
🟣 UNIUSDT.P: Long-Term Trade
🔵 XRPUSDT.P: Entry Zones
🔗 LINKUSDT.P: Follow The River
📈 BTCUSDT.P: Two Key Demand Zones
🟩 POLUSDT: Bullish Momentum
🌟 PENDLEUSDT.P: Where Opportunity Meets Precision
🔥 BTCUSDT.P: Liquidation of Highly Leveraged Longs
🌊 SOLUSDT.P: SOL's Dip - Your Opportunity
🐸 1000PEPEUSDT.P: Prime Bounce Zone Unlocked
🚀 ETHUSDT.P: Set to Explode - Don't Miss This Game Changer
🤖 IQUSDT: Smart Plan
⚡️ PONDUSDT: A Trade Not Taken Is Better Than a Losing One
💼 STMXUSDT: 2 Buying Areas
🐢 TURBOUSDT: Buy Zones and Buyer Presence
🌍 ICPUSDT.P: Massive Upside Potential | Check the Trade Update For Seeing Results
🟠 IDEXUSDT: Spot Buy Area | %26 Profit if You Trade with MSB
📌 USUALUSDT: Buyers Are Active + %70 Profit in Total
🌟 FORTHUSDT: Sniper Entry +%26 Reaction
🐳 QKCUSDT: Sniper Entry +%57 Reaction
📊 BTC.D: Retest of Key Area Highly Likely
📊 XNOUSDT %80 Reaction with a Simple Blue Box!
📊 BELUSDT Amazing %120 Reaction!
📊 Simple Red Box, Extraordinary Results
📊 TIAUSDT | Still No Buyers—Maintaining a Bearish Outlook
📊 OGNUSDT | One of Today’s Highest Volume Gainers – +32.44%
📊 TRXUSDT - I Do My Thing Again
📊 FLOKIUSDT - +%100 From Blue Box!
📊 SFP/USDT - Perfect Entry %80 Profit!
📊 AAVEUSDT - WE DID IT AGAIN!
I stopped adding to the list because it's kinda tiring to add 5-10 charts in every move but you can check my profile and see that it goes on..

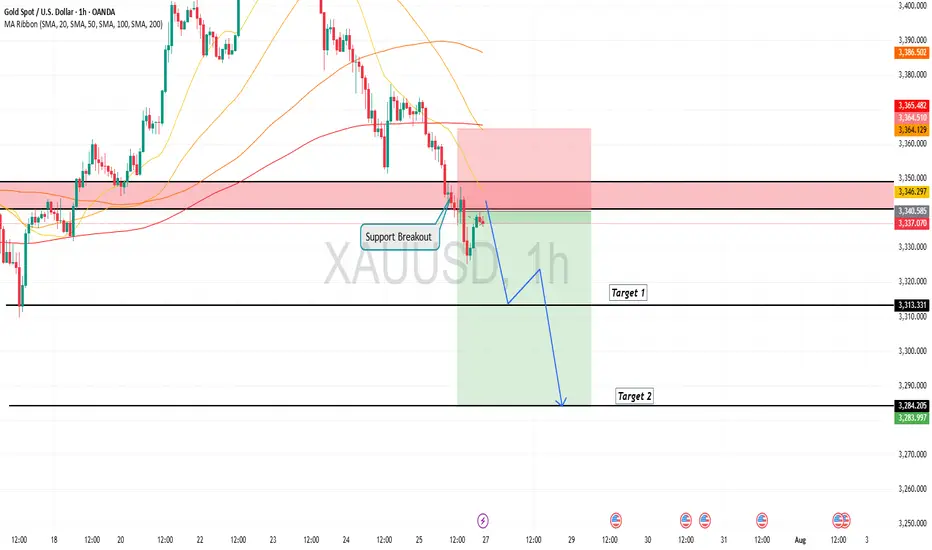
Gold is in the Bearish Direction after Breaking SupportHello Traders
In This Chart GOLD HOURLY Forex Forecast By FOREX PLANET
today Gold analysis 👆
🟢This Chart includes_ (GOLD market update)
🟢What is The Next Opportunity on GOLD Market
🟢how to Enter to the Valid Entry With Assurance Profit
This CHART is For Trader's that Want to Improve Their Technical Analysis Skills and Their Trading By Understanding How To Analyze The Market Using Multiple Timeframes and Understanding The Bigger Picture on the Charts
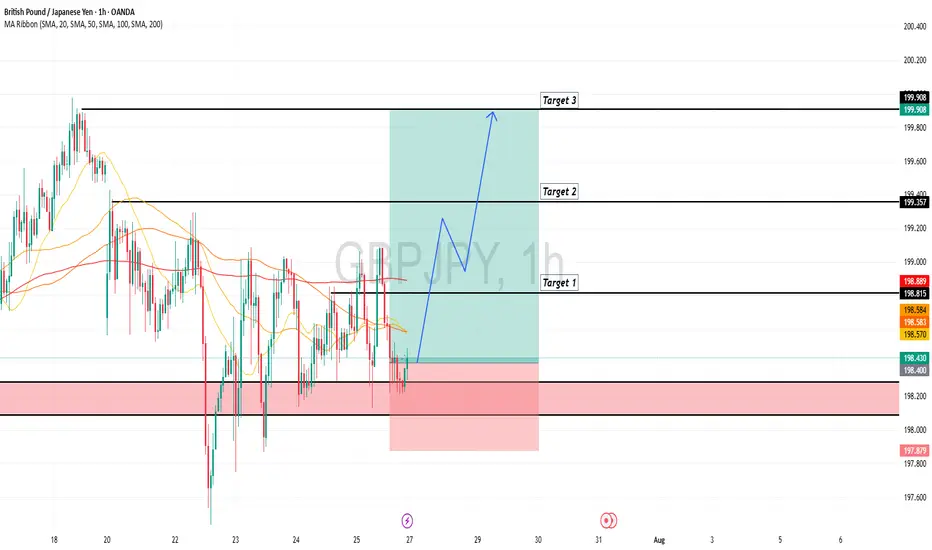
GBPJPY is Holding above the SupportHello Traders
In This Chart GBPJPY HOURLY Forex Forecast By FOREX PLANET
today GBPJPY analysis 👆
🟢This Chart includes_ (GBPJPY market update)
🟢What is The Next Opportunity on GBPJPY Market
🟢how to Enter to the Valid Entry With Assurance Profit
This CHART is For Trader's that Want to Improve Their Technical Analysis Skills and Their Trading By Understanding How To Analyze The Market Using Multiple Timeframes and Understanding The Bigger Picture on the Charts
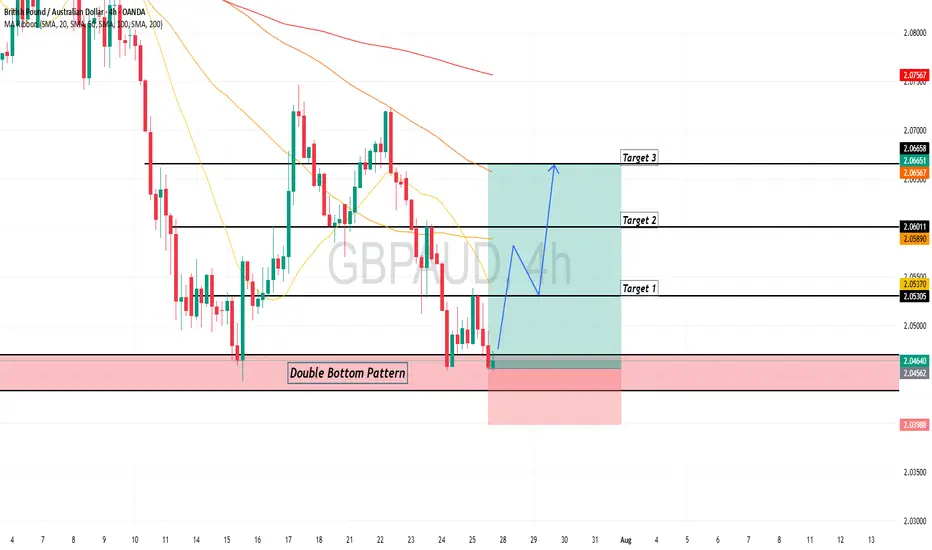
GBPAUD is Holding above the Support , All Eyes on BuyingHello Traders
In This Chart GBPAUD HOURLY Forex Forecast By FOREX PLANET
today GBPAUD analysis 👆
🟢This Chart includes_ (GBPAUD market update)
🟢What is The Next Opportunity on GBPJPY Market
🟢how to Enter to the Valid Entry With Assurance Profit
This CHART is For Trader's that Want to Improve Their Technical Analysis Skills and Their Trading By Understanding How To Analyze The Market Using Multiple Timeframes and Understanding The Bigger Picture on the Charts
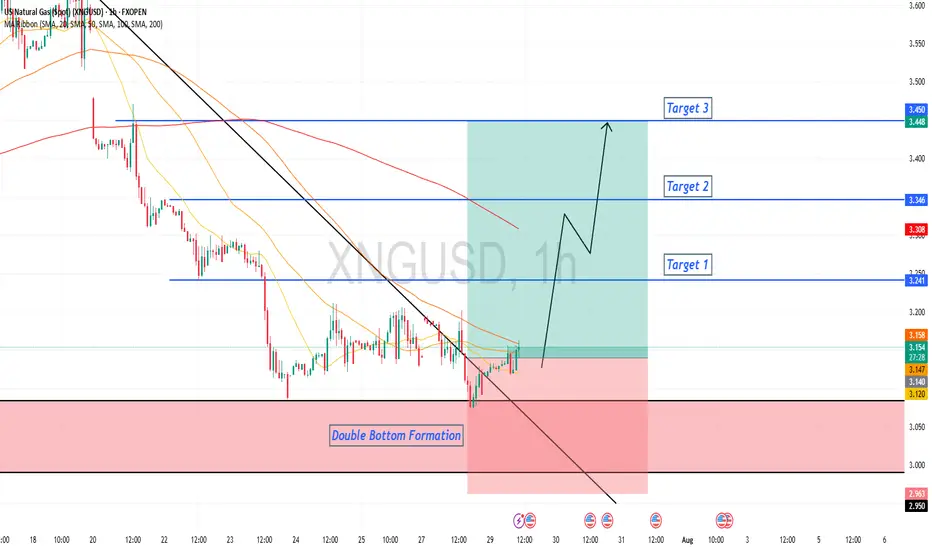
Natural Gas is in the Buying DirectionHello Traders
In This Chart NATGAS HOURLY Forex Forecast By FOREX PLANET
today NATGAS analysis 👆
🟢This Chart includes_ (NATGAS market update)
🟢What is The Next Opportunity on NATGAS Market
🟢how to Enter to the Valid Entry With Assurance Profit
This CHART is For Trader's that Want to Improve Their Technical Analysis Skills and Their Trading By Understanding How To Analyze The Market Using Multiple Timeframes and Understanding The Bigger Picture on the Charts
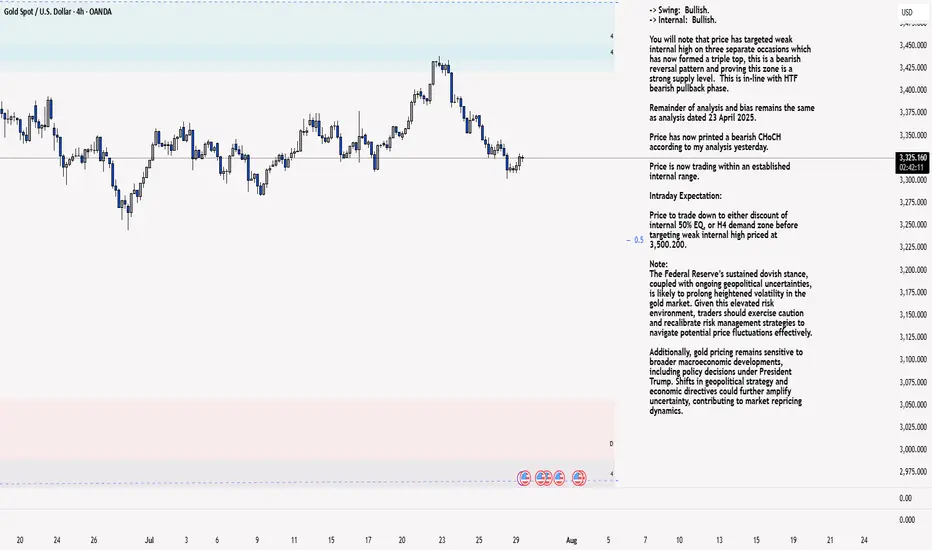
XAU/USD 29 July 2025 Intraday AnalysisH4 Analysis:
-> Swing: Bullish.
-> Internal: Bullish.
You will note that price has targeted weak internal high on three separate occasions which has now formed a triple top, this is a bearish reversal pattern and proving this zone is a strong supply level. This is in-line with HTF bearish pullback phase.
Remainder of analysis and bias remains the same as analysis dated 23 April 2025.
Price has now printed a bearish CHoCH according to my analysis yesterday.
Price is now trading within an established internal range.
Intraday Expectation:
Price to trade down to either discount of internal 50% EQ, or H4 demand zone before targeting weak internal high priced at 3,500.200.
Note:
The Federal Reserve’s sustained dovish stance, coupled with ongoing geopolitical uncertainties, is likely to prolong heightened volatility in the gold market. Given this elevated risk environment, traders should exercise caution and recalibrate risk management strategies to navigate potential price fluctuations effectively.
Additionally, gold pricing remains sensitive to broader macroeconomic developments, including policy decisions under President Trump. Shifts in geopolitical strategy and economic directives could further amplify uncertainty, contributing to market repricing dynamics.
H4 Chart:
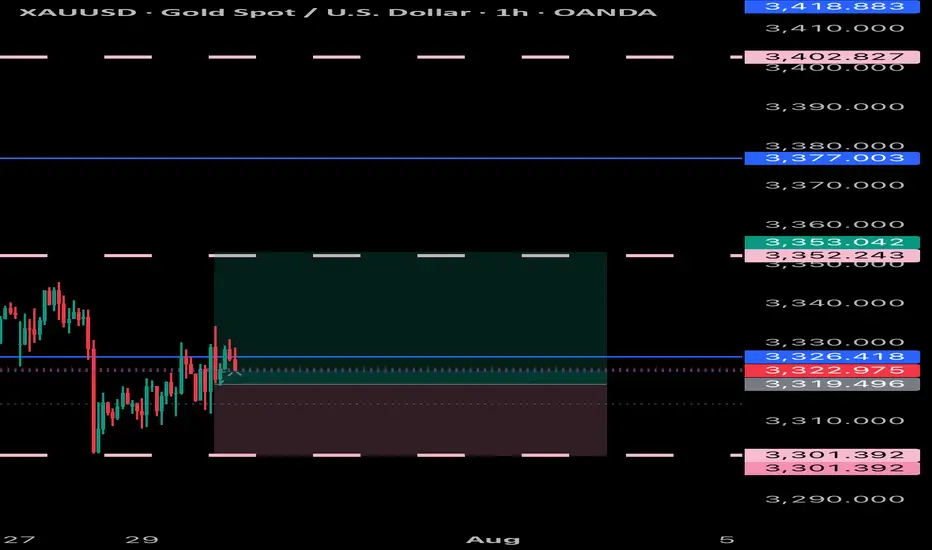
M15 Analysis:
-> Swing: Bullish.
-> Internal: Bullish.
H4 Timeframe - Price has failed to target weak internal high, therefore, it would not be unrealistic if price printed a bearish iBOS.
The remainder of my analysis shall remain the same as analysis dated 13 June 2025, apart from target price.
As per my analysis dated 22 May 2025 whereby I mentioned price can be seen to be reacting at discount of 50% EQ on H4 timeframe, therefore, it is a viable alternative that price could potentially print a bullish iBOS on M15 timeframe despite internal structure being bearish.
Price has printed a bullish iBOS followed by a bearish CHoCH, which indicates, but does not confirm, bearish pullback phase initiation. I will however continue to monitor, with respect to depth of pullback.
Intraday Expectation:
Price to continue bearish, react at either M15 supply zone, or discount of 50% internal EQ before targeting weak internal high priced at 3,451.375.
Note:
Gold remains highly volatile amid the Federal Reserve's continued dovish stance, persistent and escalating geopolitical uncertainties. Traders should implement robust risk management strategies and remain vigilant, as price swings may become more pronounced in this elevated volatility environment.
Additionally, President Trump’s recent tariff announcements are expected to further amplify market turbulence, potentially triggering sharp price fluctuations and whipsaws.
M15 Chart: