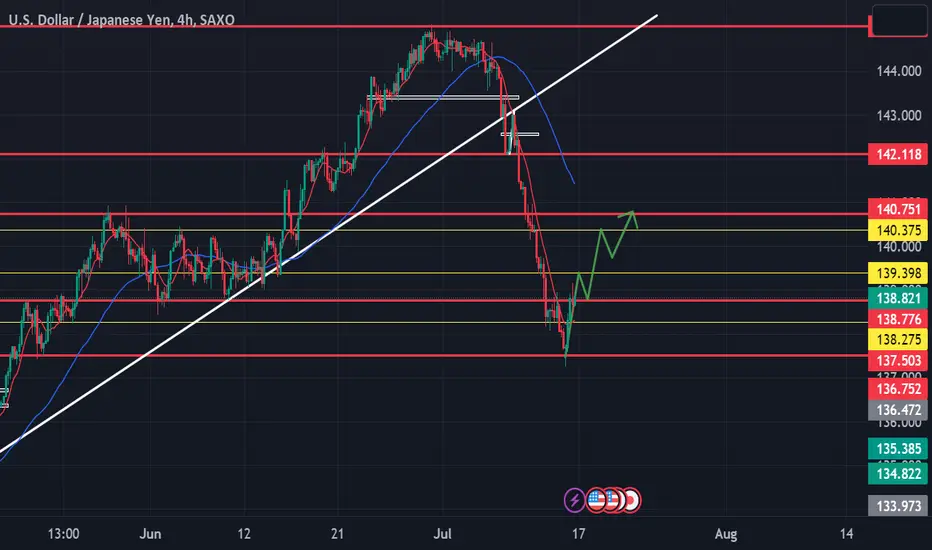
USDJPY, Are the Bulls back in control?UJ was on a bearish run from 07/09-07/14. On the Friday before the market closed UJ reached a key daily Supply/Demand level and closed above the zone. In the screen shot above is a projection of where the market will go. To confirm the bullish run, price must close above the daily supply/demand area @138.776. Once the four hour candle is closed above the area, look for the next major 4 hour supply/demand area that price could possibly begin to reject. Once a pullback occurs and closes above either the daily supply/demand zone or 4hr supply/demand zone, take your long entries and hold to your comfort.
is this just a temporary bull market run or will the bears strike back?
Supplyandemandzones
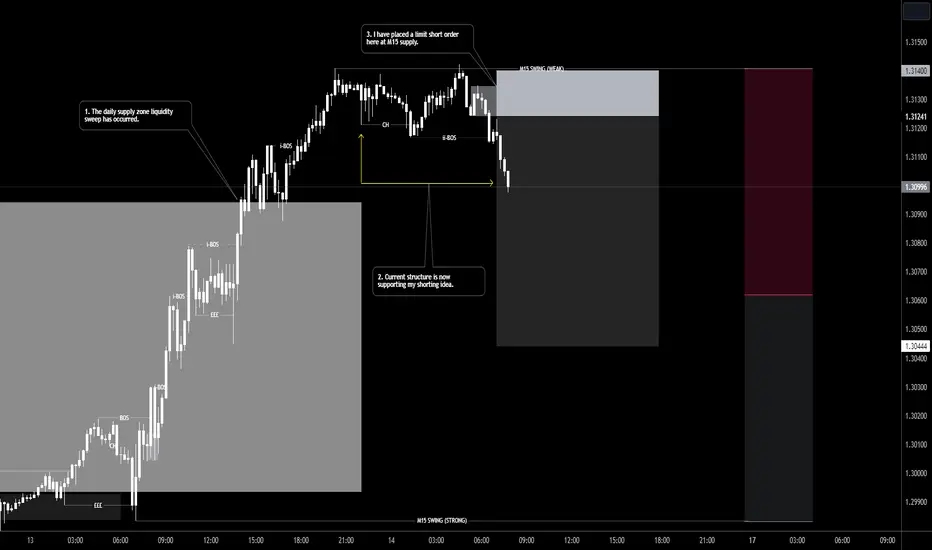
GBPUSD: SHORT OPPURTUNITY IS POTENIALLY IN PLAYSo this seems to be playing out. HTF on the daily & H2 has played perfectly into a LQS.
Today is Friday and I believe a lot of people will want to take their money out of the market, so as mentioned in my previous chart up we could see some nice PA.
My mechanical structure has played out perfectly in premium and I'm looking for a short from M15 supply. I've extended my supply zone to give it room to breathe.
My target is just below the previous M15 LQS to the left as we begin to push into discount prices on the M15.
My R:R is 5:1 for day trades.
What could go wrong here?
1. The liquidity run could not be finished and my structure is a fake.
2. There could still be a brief liquidity spike on LTF that would take out my supply zone even at the highs
3. My supply zone could not be triggered due to bearish momentum.
All you can do is plan the trade and trade the plan.
What's important is that:
-I'm not chasing trades.
-I'm not buying in the premium.
-I've waited for my structure to inform me of my decision.
If it works or fails at this point is irrelevant. I have done everything by my book
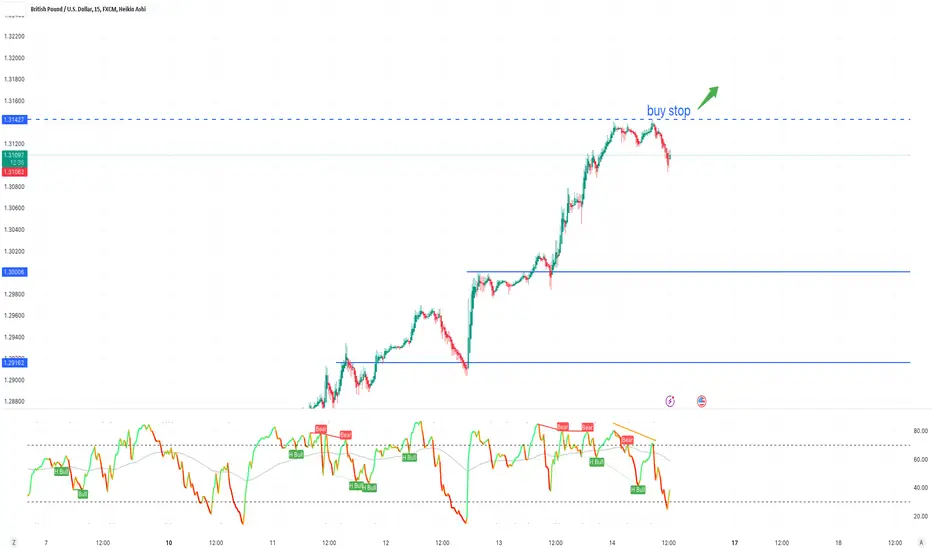
GBPSUD Buy Order PlanPlace your buy orders for GPUSD or wait for resistance to break.
Manage your risk accordingly!
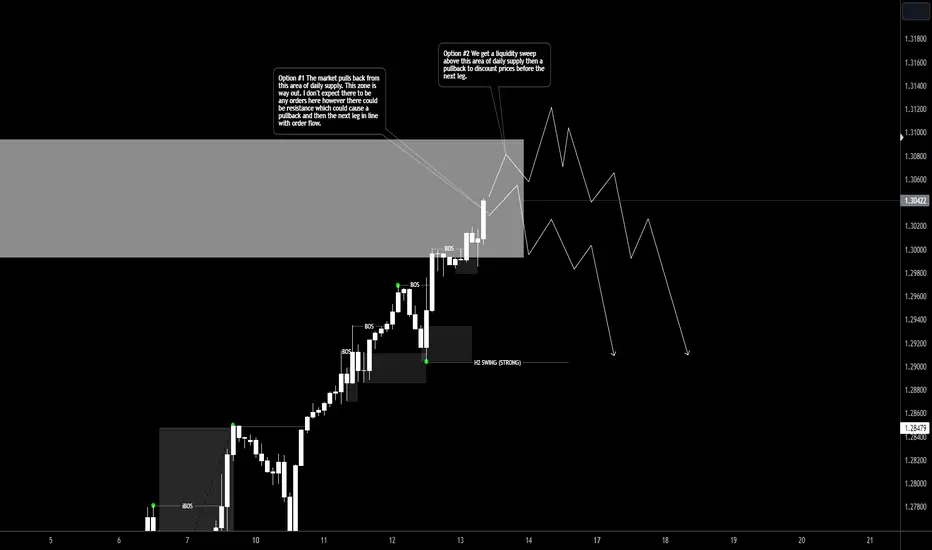
GBPUSD: Potential resistance at daily supply or liquidity sweep H2 has been moving to the upside aggressively over the past few days. Which means there will be a lot of traders going long. In order for this run to continue there needs to be a pullback to take out stops and fuel the next set of order.
The 2 options I have called out on the chart are the most possible from my framework and viewpoint.
When the pullback happens I will be looking at the M15 orderflow to take advantage of the move back to discount prices.
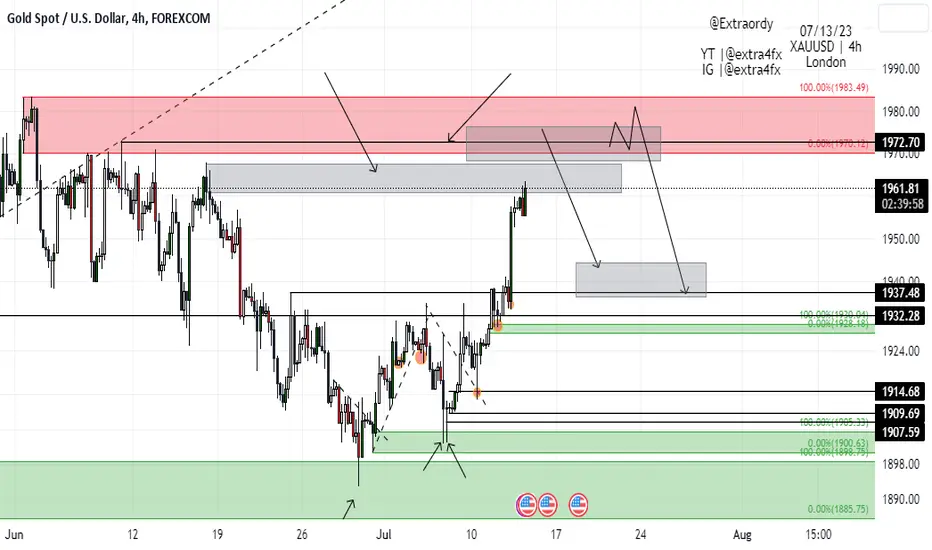
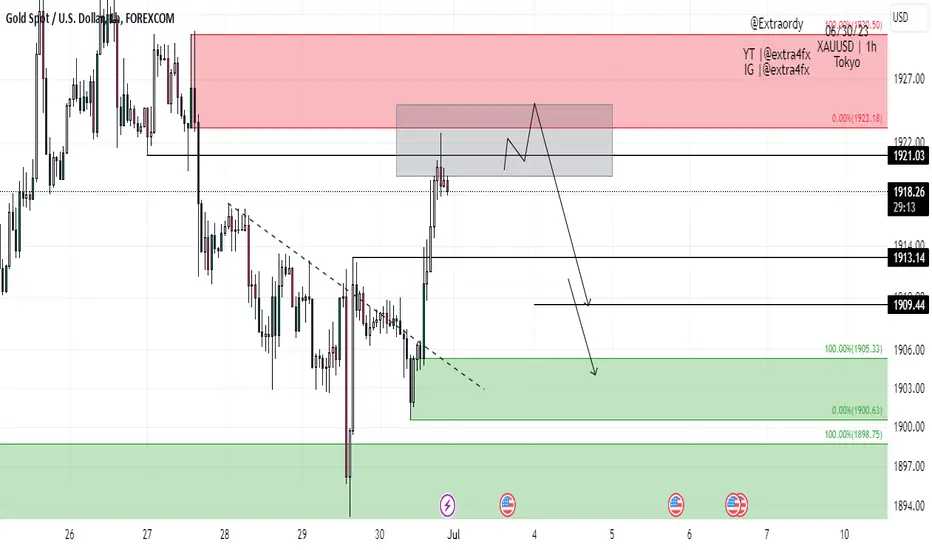
Watch Out! Supply Zone Ahead | GOLDGOLD is approaching a potential supply zone which could be the beginning of a consolidation retracement, the best point for shorting is above 1972.70 liquidity point in the supply zone looking down to a target 1942.68 or 1937.48
GBP/JPY Potential Forecast|HTF Analysis| Wednesday, 12 July 2023Hi everyone!
-GBP/JPY give us a nice bullish price delivery previous week and for now is changin the direction (switch in orderflow)
-It have a lot of liquidity and IMB below him so that can be your potential target.
-If you are gonna enter on supply use confirmations.
I hope you will have a great trading day.

Guide to Recession - What Is It? Recession is a scary word for any country An economic recession occurs when the economy shrinks. During recessions, even businesses close their doors. Even an individual can see these things with his own eyes:
1. People lose their jobs
2. Investment lose their value
3. Business suffers losses
Note: The recession is part of an economic cycle.
If you haven't read that article, you can check it below:
What is the Recession?
Two consecutive quarters of back-to-back declines in gross domestic product constitute a recession. The recession is followed by the peak phase. Even if a recession lasts only a few months, the economy will not reach its peak after serval years when it ends.
Effect on supply & Demand - The demand for goods decreased due to expensive prices. Supply will keep increasing, and on the other hand, demand will begin to decline. That causes an "excess of supply" and will lead to falling in prices.
A recession usually lasts for a short period, but it can be painful. Every recession has a different cause, but they have the main reason for the cause of the recession.
What is depression? - A deep recession that persists for a long time eventually leads to depression.
During a recession, the inflation rate goes down.
How to avoid recession?
1. Monetary Policy
- Cut interest rates
- Quantitative easing
- helicopter money
2: Fiscal policy
- Tax Cut
- Higher government spending
3: higher inflation target
4: Financial stability
Unemployment :
We know that companies are healthy in expansion, but there is a saying, "too much of anything can be good for nothing."
During peak,
The company is unable to earn the next marginal dollar.
Companies are taking more risk and debt to reset the growth
Not only companies but investors and debtors also invest in risky assets.
Why does lay-off occur?
After the peak phase, companies are unable to earn the next marginal dollar. Now, the business is no more profitable. CCompaniesstart to reduce their costs to enter into a profitable system. For example - Labour
Now, Companies are working with fewer employees. Fewer employees must work more efficiently. Otherwise, they may be lay-off by the company too. You can imagine the workload and pressure.
You may argue that they should leave the company! Really? Guys, we just discussed the employment rate declines. How will you get a job when there is no job? Now, you get it!
Let's assume the effects of the recession on the common man:
Condition 1: He may be laid off.
Condition 2: Perhaps he will be forced to work longer hours. The company is unable to maintain a positive outlook. Fewer employees are doing more work due to massive lay-off. His wages decline, and he has no disposable income.
As a result, consumption rates are reduced, resulting in lower inflation rates. A slowdown in the economy is caused by lower prices, which decrease profits, resulting in more job cuts.
Four Causes of Recession:
1. Economic Shocks
2. Loss of Consumer
3. High-interest rates
4. Sudden stock market crash
1) Economic shocks - When there is an external or economic shock the country faces. For example, COVID-19,
2) Consumer confidence - Negative perception about the economy and the company from consumers who lack confidence in their spending power. Instead of spending, they will choose to save money. As there is no spending, there is no demand for goods and services. The absence of spending results in a lack of demand for goods and services.
3) High-interest rates - High-interest rates will reduce spending. Loans are expensive, so few people take them out. Consumer spending, auto sales, and the housing market will be affected. There can be no good demand if there is no lending. There will be a decline in production.
4) Sudden stock market crash - evade people's trust in the stock market. As a result, they do recall their money and emotion drives them crazy. It can also be considered a psychological factor. As a result, people will not spend money and GDP will decline.
Consumer Spending:
During the recession, consumers don’t have additional income called disposable income.
Consumer spending parts
-- Durable goods - Lasts for more than one year
-- Non-durable goods - Lasts for less than one year
-- Service - Accounting, legal, massage services, etc.
Durable goods surfer during the recession. Non-durable goods are recession-proof because their day-to-day fundamentals are not affected by recessions.
Let's take an example of two stocks,
ABC Food vs ABC car
But, will you stop buying food because of the recession? Will you reduce your consumption of toothpaste, bread, and milk?
The answer is "NO".
Consumers buy the same amount of food in good or bad times, On the other hand, consumers only trade in or trade off their car purchase when they are not only employed but optimistic about the safety of their jobs & confident that they could get a promotion or a high paid job with another employer. And People's disposable income is absorbed during the recession.
Consumer spending is the crucial point to displacing recession.
Auto sales:
As we discussed, few people buy cars during a recession. New car sales count as economic growth. You may have heard about 0% loans. The company facilitates a 0% loan to increase auto sales. Mostly, people repair their cars or buy old cars during the recession.
You may see a boost in the used car market and spare parts selling companies’ sales.
Home sales/housing markets:
I have a question now!
Which is your biggest asset? Most of you will say, my home!
New home sales are part of economic growth. Also, house price impact how wealthy consumer feel. Higher the home prices, the more they feel rich, and vice versa. When home prices are higher, consumers feel they are wealthy and they are willing to spend. But when house price declines, they reduce spending/consumption.
If your biggest asset price declines, you don’t spend and the economy takes a longer time to recover. A higher rate stops increasing the home price because they have to pay more EMI. central bank reduces rates during the recession, and the housing market rate boosts because the loan/EMI is cheap.
Interest rates:
Generally, interest rates decline during a recession. Central banks cut interest rates that’s why loans become cheap.
Benefits of Lower interest rates -
- - Boost in the housing market.
- - Increase sales of durable goods
- - Boost in business investment
- - Bonds and interest rates have an inverse relationship. An economic downturn tends to bring investors to bonds rather than stocks, which can perform well in a recession.
- - During the recession, interest rates are lower and banks higher the criteria for getting loans, so that people can face the abstracts while lending money.
Stock Market:
I want to clarify that, the stock market is not an economy. The economic cycle is lagging behind the market cycle and sentiment cycle. It gives me a chill as a technical analyst and a sad moment as an economics lover. Sometimes it's ahead, and sometimes it's behind. Recession = bear market .
Recession-Proof Industries:
* Consumer staples
* Guilty pleasures
* Utilities
* Healthcare
* Information technology
* Education
I will write about this in the future, but for the time being, let's get back to technical analysis .
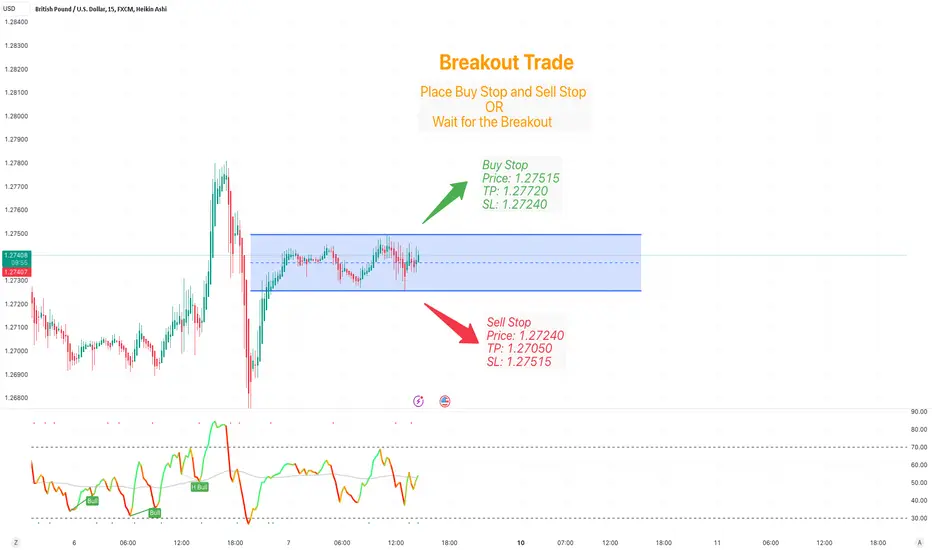
GBPUSD Potential Breakout TradePotential Breakout trade on currency pair GBPUSD, place Buy Stop and Sell Stop Orders or wait for Breakout.
Manage your risk accordingly.
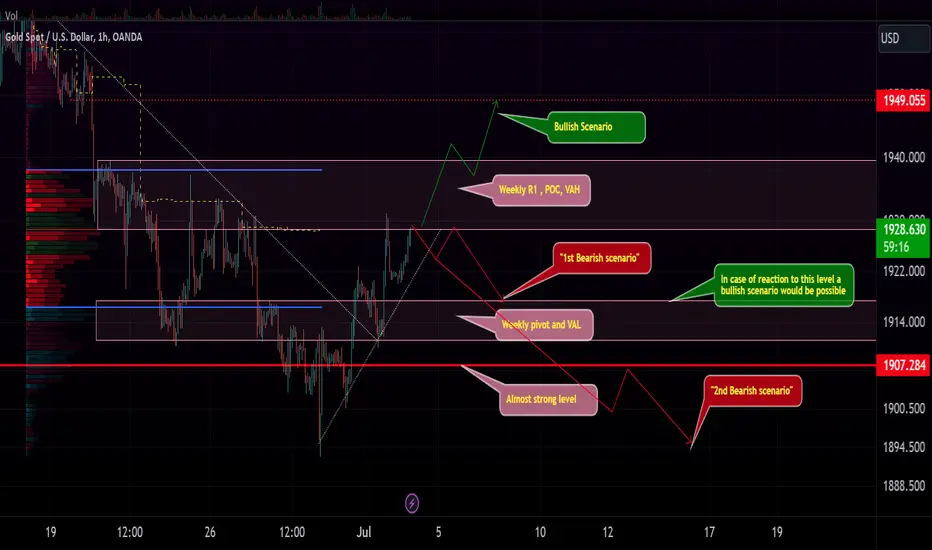
GOLD Possible scenarios."Bullish Scenario" will be activated after breaking 1939.50. 1st tp is around 1948.
"Bearish Scenario" will be activated in case of price crossing the bullish-trend-line under.
In that case a reaction to the 1917.400 could provide a long opportunity there.
If Hawks seems to be more powerful in FOMC meeting, you should wait for the "2nd bearish scenario"
i love the game simplified ( peep the related ideas) and with the basics inplace and large areas of money and probability i take my time one love

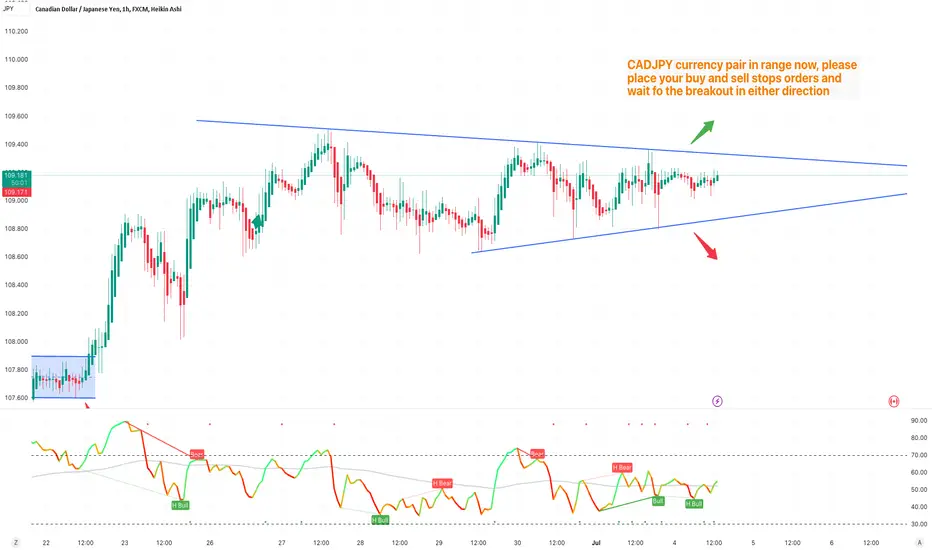
CADJPY Breakout Trade SetupCADJPY is about to break its range please place buy and sell order to take trade.
Manage your risk accordingly.
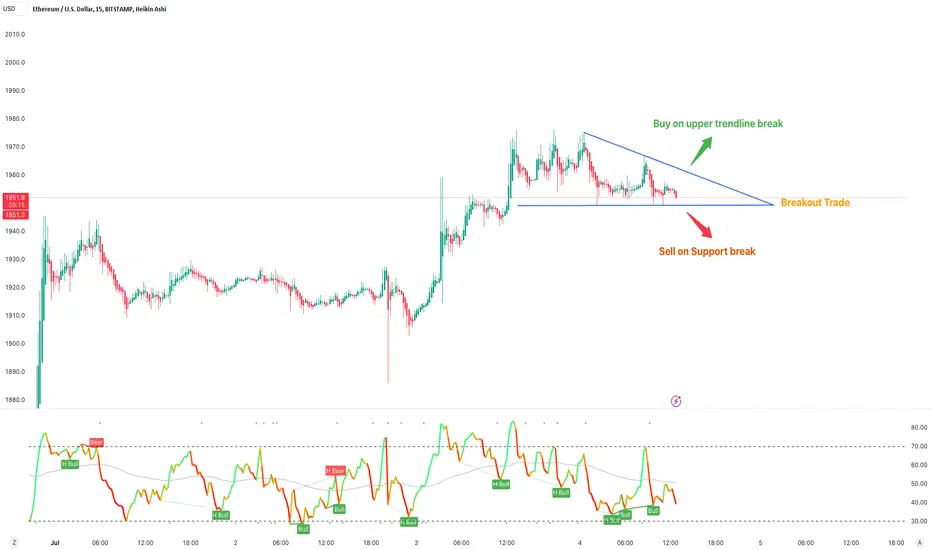
ETHUSD Breakout TradePlace your buy stop and sell stop or wait for breakout of trendline or support to get into the trade.
Manage your risk accordingly!
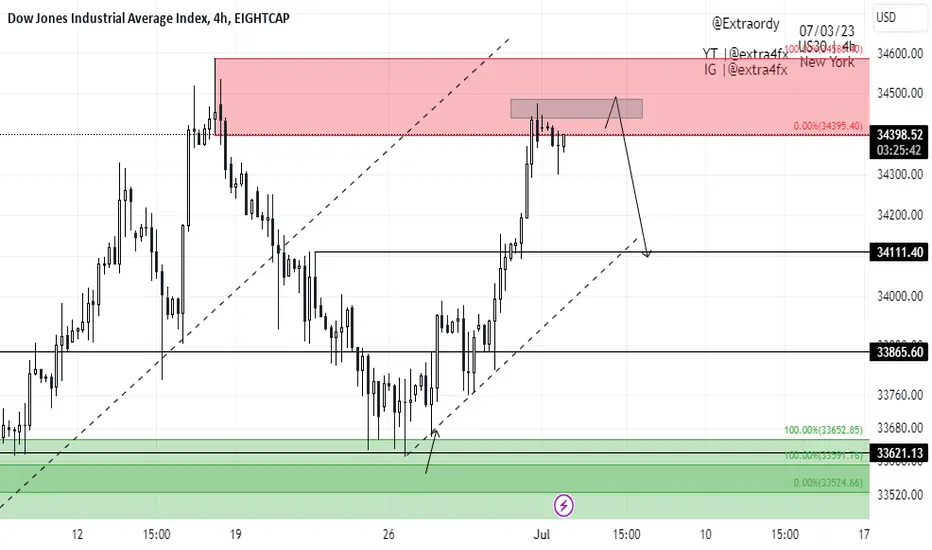
us30 Short-term retracement?Ricky sell, us30 is on supply zone considerably look for sell confirmation to 34111.40
Break and Retest @ $1,909 Weekly Level 📈Ethereum created a Higher High on the Daily Timeframe after the daily candle closed at $1,933 on Friday. Additionally, Eth closed up 3.15% on the Month and this suggests a further increase for July. More aggressive positioning for an increase in the month of July would be the anticipation that Ethereum closes above $1,909 Weekly supply level. Trade Idea : It uses what once was a Supply/Resistance level as a new Support/Demand level. This would translate into a swift break and retest trade above $1,909 and looking for new high prices to formulate as the new monhtly and weekly candle's kick off.
We have
1) Monthly candle just closed bullish
2) After 1 week of testing $1,909 Weekly Supply level, price has done a fair job of sticking right at it, current price $1,913
3) After all the crazy news, price remains at the medium term highs after a 16% pump across the past 2.5 weeks.
A Look at the Daily Chart, Created a Higher High and we may now use $1909 to do a break and retest to head towards $1,995

Gold Short-term Sell to Demand zoneGold should sell back to key demand zone, gold have been in a downtrend, its a short-term sell because gold react from a key demand zone, confirmation of the zone could be a beginning of a bull trend,
240 MINS TIME FRAME - RAYMOND STOCKThe Structure looks good to us, waiting for this instrument to correct and then give us these opportunities as shown on this instrument (Price Chart).
Note: Its my view only and its for educational purpose only. Only who has got knowledge about this strategy, will understand what to be done on this setup. its purely based on my technical analysis only (strategies). we don't focus on the short term moves, we look for only for Bullish or Bearish Impulsive moves on the setups after a good price action is formed as per the strategy. we never get into corrective moves. because it will test our patience and also it will be a bullish or a bearish trap. and try trade the big moves.
we do not get into bullish or bearish traps. We anticipate and get into only big bullish or bearish moves (Impulsive Moves). Just ride the Bullish or Bearish Impulsive Move. Learn & Know the Complete Market Cycle.
Buy Low and Sell High Concept. Buy at Cheaper Price and Sell at Expensive Price.
Keep it simple, keep it Unique.
please keep your comments useful & respectful.
Thanks for your support....
Tradelikemee Academy

Bullish Descending Wedge ? ₿ Weekly S/R Level $24,363Price is squeezing to the downside as we approach our 24,363$ Weekly S/R Zone. It also happens to be an extreme Daily Zone. The next Daily zone being at 22K which is a 10% drop from $24,363 Level. Short Traders have enjoyed a consistent downside push across the past 2 Months ever since BTC tapped into the $30,000 Weekly Level. This Long idea has to do more with the psychology of some players wanting to jump in the short/downside train. We'll see if a correction will change their minds as I can see a correction to clear out liquidity after we touch into a weekly S/R level ( 24,363$) . This Weekly s/r level was quite relevant during August 22' and February 23' .

BTCUSD Potential Breakout Trade SetupBTCUSD is about to break its range please place buy and sell order to take trade.
Manage your risk accordingly.

ETHUSD Potential Breakout Trade SetupETHUSD breakout trade on either side, if broke resistance or support. Place TP and SL with buy stop and sell stop orders.

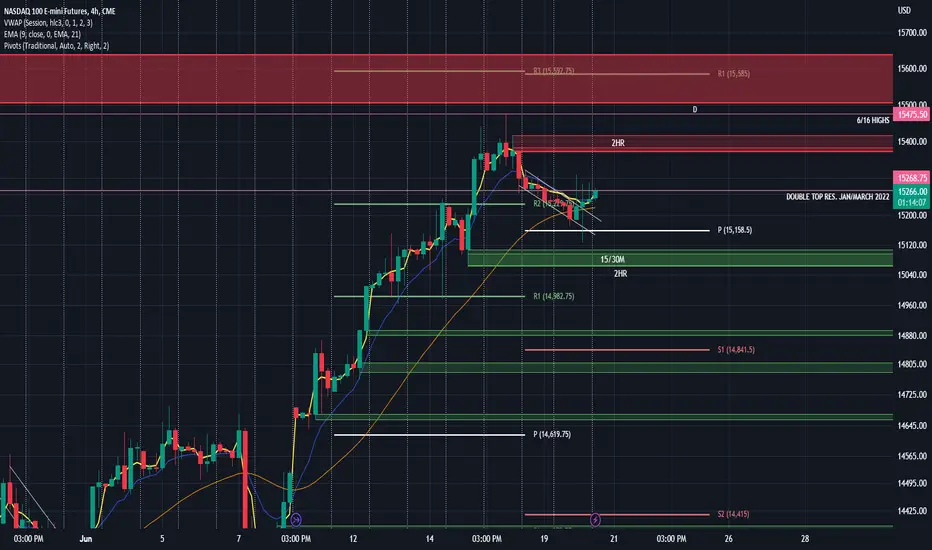
NQ1! Supply Demand Levels 6/20We just recently broke from the 1HR downtrend line and looking to break to make newer highs. We have news releases this week for possible momentum to do just that. For this reason, I have bigger EOW targets to possibly reach. For intraday targets, targeting 0.5-1% of the NQ price.
BULLS:I am interested in breaking the top of the trendline at 6/16/23 recent highs of 15475 and then the Daily supply zone above to be filled near 15.5k.
BEARS: I like the 14981 area as we had previous bounces on the 4HR TF about 3x. If we can break through this area, I would like the 14879 zone to be filled.
Link for chart: tradingview.sweetlogin.com
USD/JPY Potential Forecast|HTF Analysis| Tuesday 20 June 2023Hi everyone!
-USD/JPY have a nice demand below
-The poi was refined from daily time frame
-Use confirmations if the price mitigate our poi
-I hope you all will have a great trading week

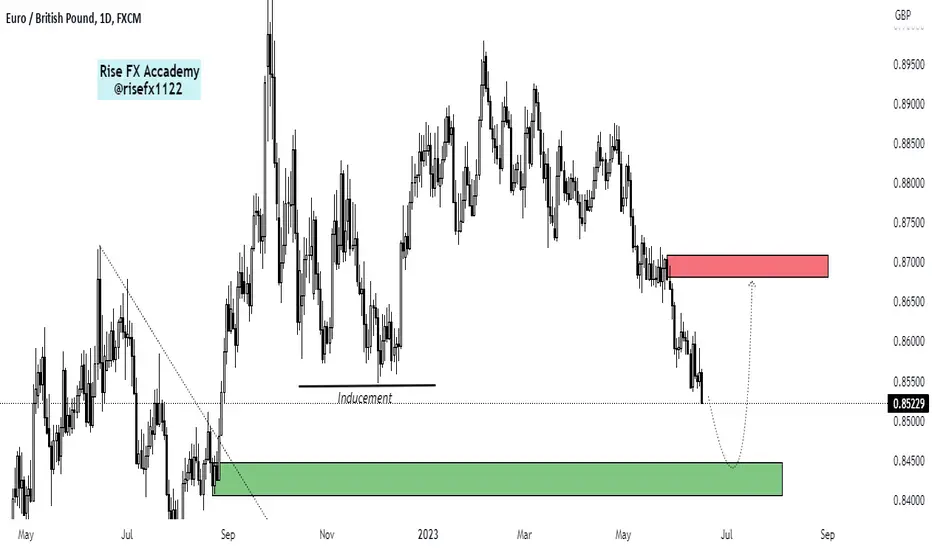
EURGBP Daily outlook still week on HTFEURGBP Daily outlook still week on HTF. but Reaching out at the Demand is the strong level we can use the confirmation rule for a long setup if we have a break of structure or break of vailed TL then we can go long until hit the nearest supply level
Thanks plz share your thoughts in comment box
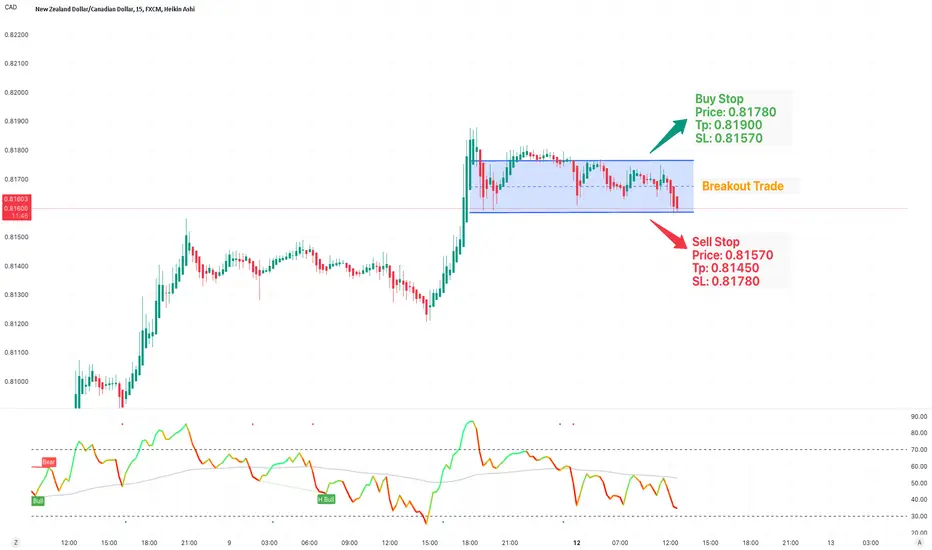
NZDCAD Potential Breakout TradeNZDCAD is about to break its range please place buy and sell order to take trade.
Manage your risk accordingly.