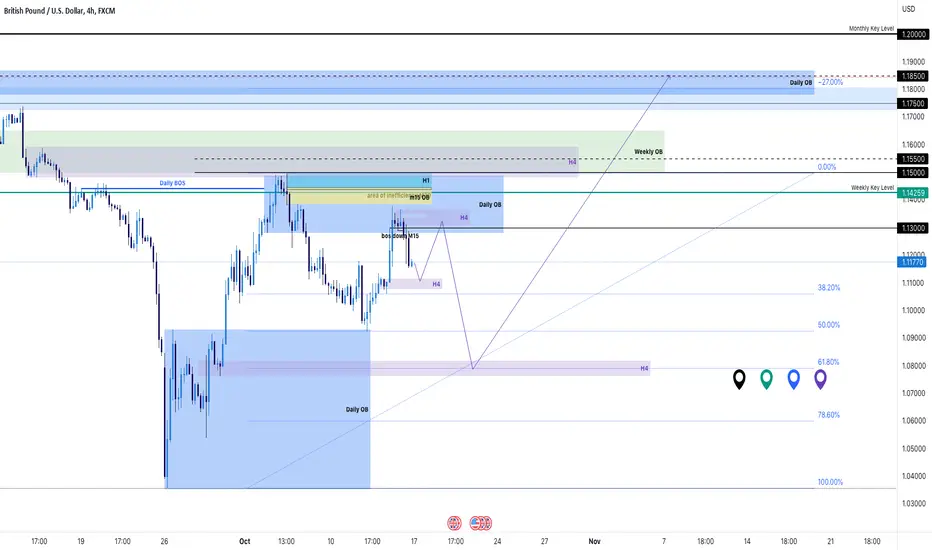
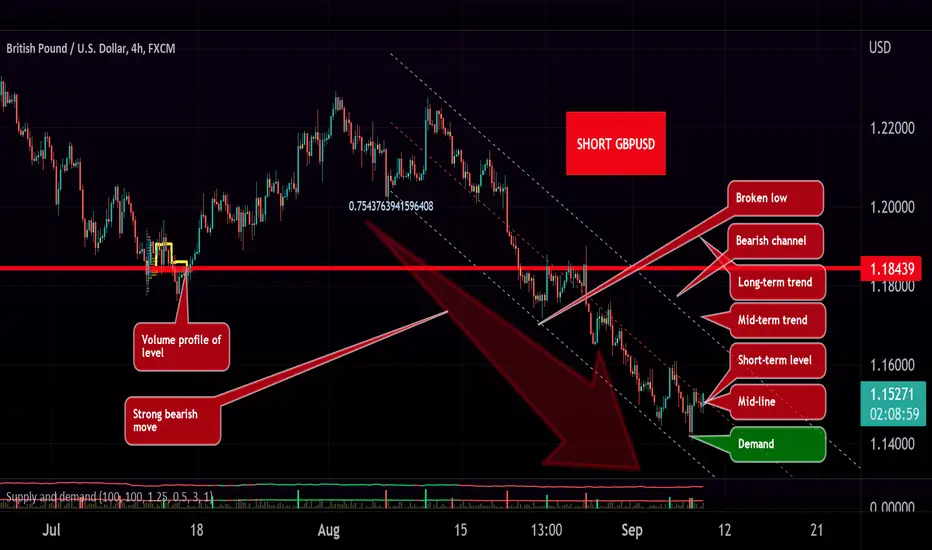
GBPUSD bullish switch to mitigate monthly fib retracement @ 38.2Please see chart markups and anchored notes for multi-time frame top-down analysis from monthly - weekly - daily - H4
Chart demonstrates my price direction bias based on H4 liquidity/ supply & demand areas
Supplyandemandzones
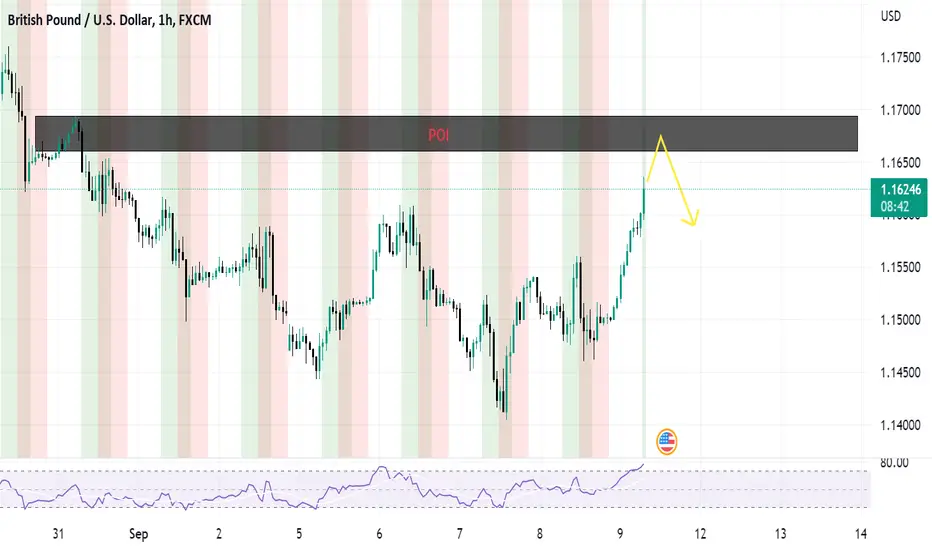
SHORTPrice has reached the weekly highs and it's possible to see some retracement before formation of new higher highs. You can take shorts at cmp and target the levels indicated.
Risk management is important.
All the best

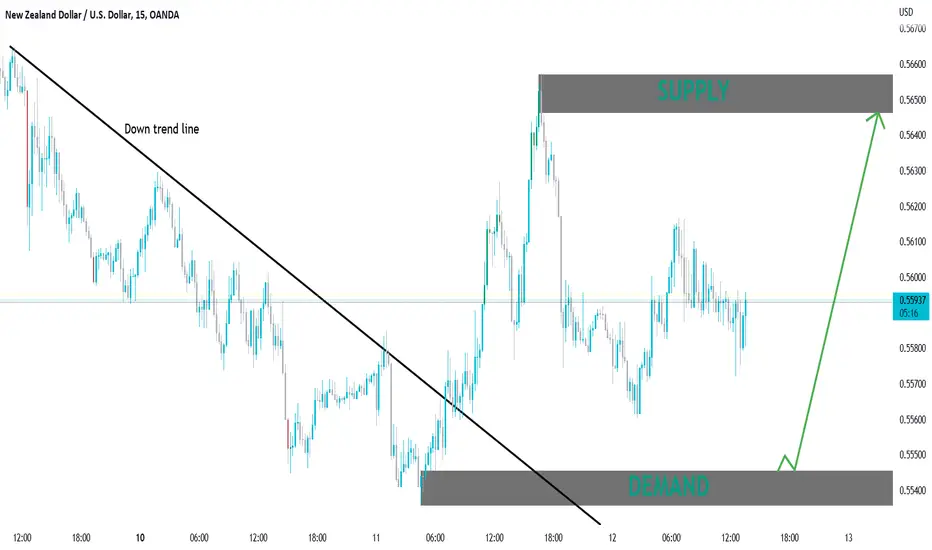
💰BUY NZDUSD at the best price and place🧨🔰You can see the analysis of the New Zealand dollar to US dollar currency pair in a 15-minute time frame (NZDUSD_ 15min) 🔍🧨
💥If the price breaks the Down trend line🖤, if the price returns to the DEMAND zone, it can rise to the SUPPLY zone🚀🔺
Do you think this analysis can be profitable❓
I hope the analysis was useful for you🤍🌹
_______📈TRADER STREET📉______
AUDUSD Swing Upward 200+ PipsWelcome back! Let me know your thoughts in the comments!
**AUDUSD - Listen to video!
We recommend that you keep this pair on your watchlist and enter when the entry criteria of your strategy is met.
Please support this idea with a LIKE and COMMENT if you find it useful and Click "Follow" on our profile if you'd like these trade ideas delivered straight to your email in the future.
Thanks for your continued support!
Brian & Kenya Horton, BK Forex Academy

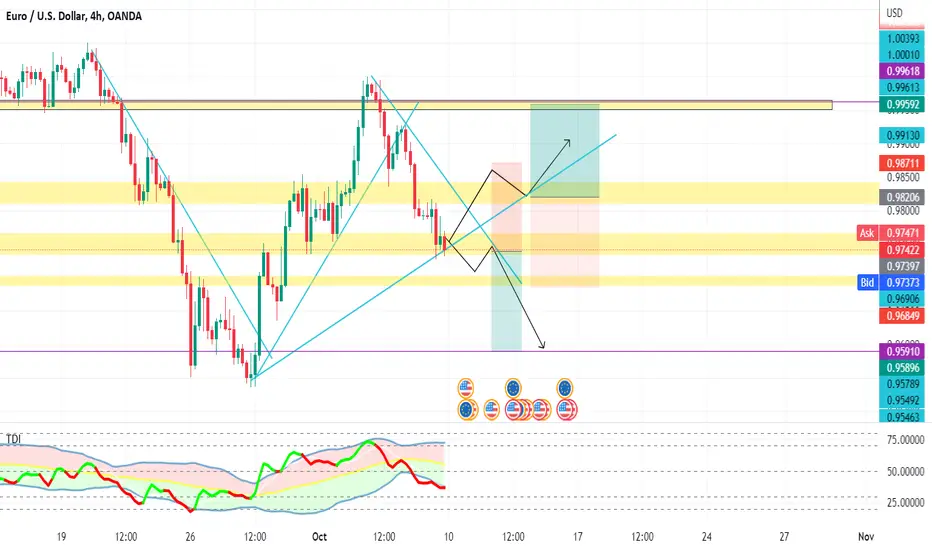
EURUSD Short IdeaEU FX:EURUSD RUSD is in a Downtrend plus we had a pullback to the latest supply zone
overall , the pair is in a downtrend in 4H and Daily timeframe
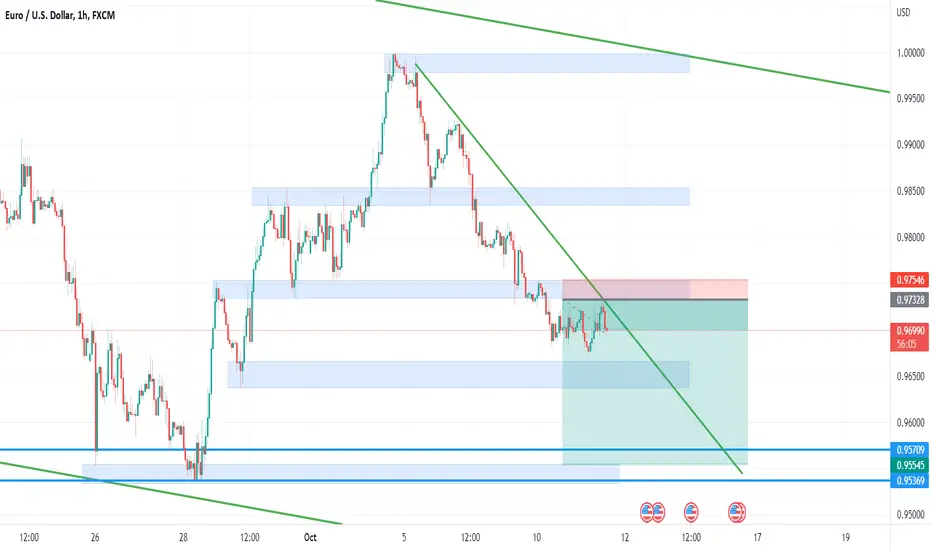
EURUSD either waysHello dear Traders.
Looking at the eurusd for the next week, I am between two possible scenarios. Either the price action will continue the fresh trend by giving LL and LH respecting the descending trend line and will be a short opportunity after the break-retest of demand zone of 0.97638 searching for the yearly lows of EU.
Or it will form a new structure consisted of HH - HL breaking the bearish trend line and coninuing according to the new one heading to the nearest strong supply zone.
Waiting for your comments.
Good Luck
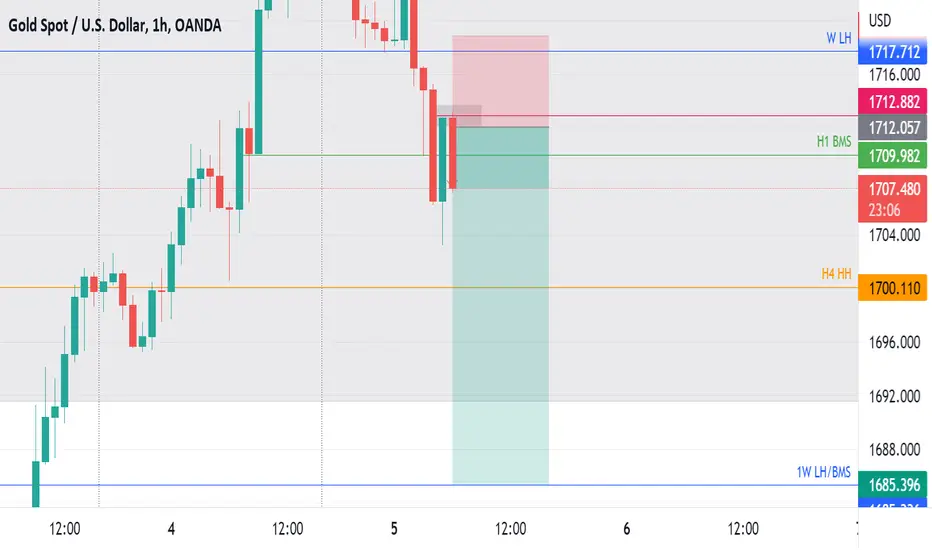
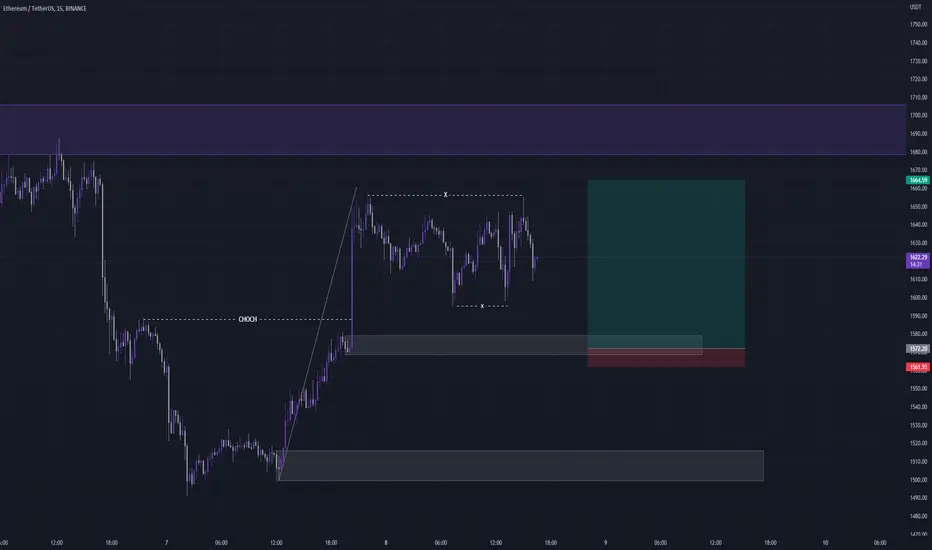
SHORTPrice successfully filled inefficiency on H4 around 1721. It is also below the previous weeks highs, and it's starting to form new bearish structures on lower timeframe. For short re entries, Use the M5 OB(1712) that was formed after H1 Break of structure. Possible Targets 1685, 1670, 1647, 1628.
All the best
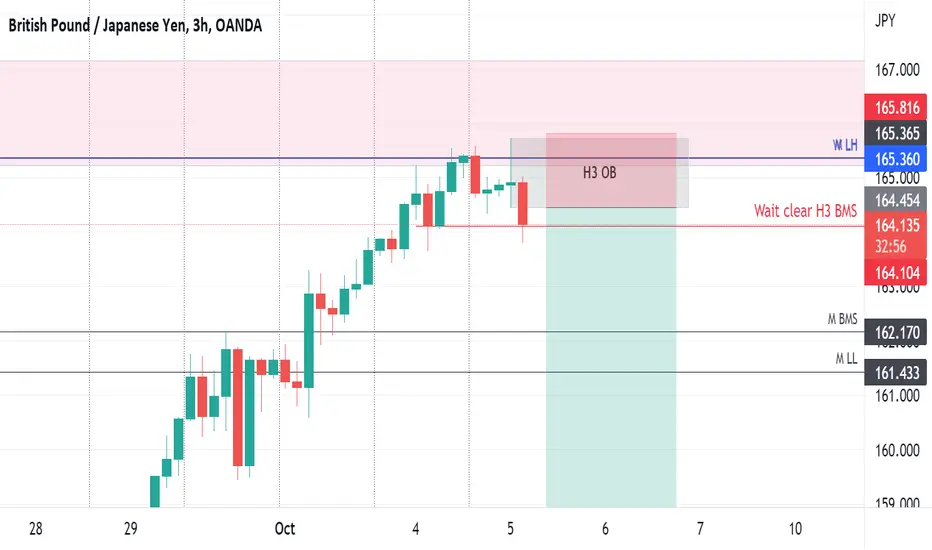
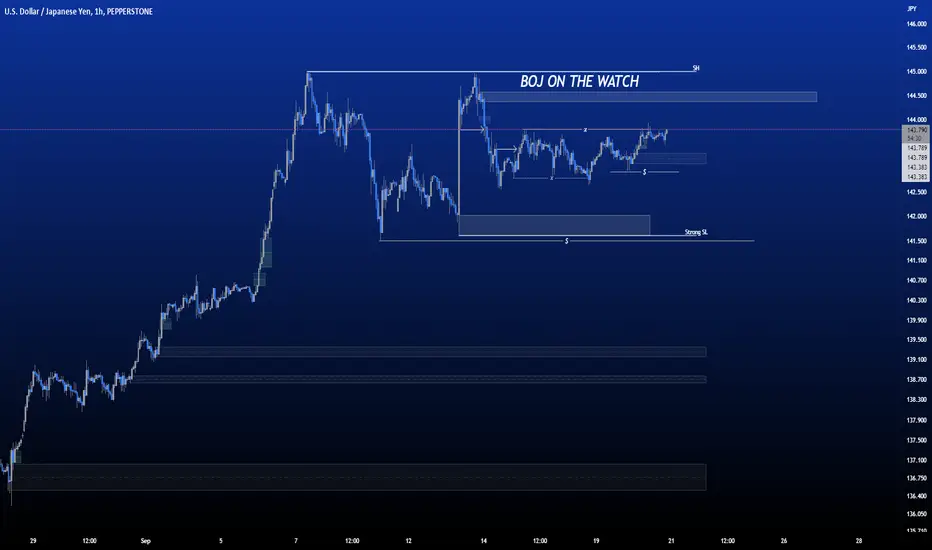
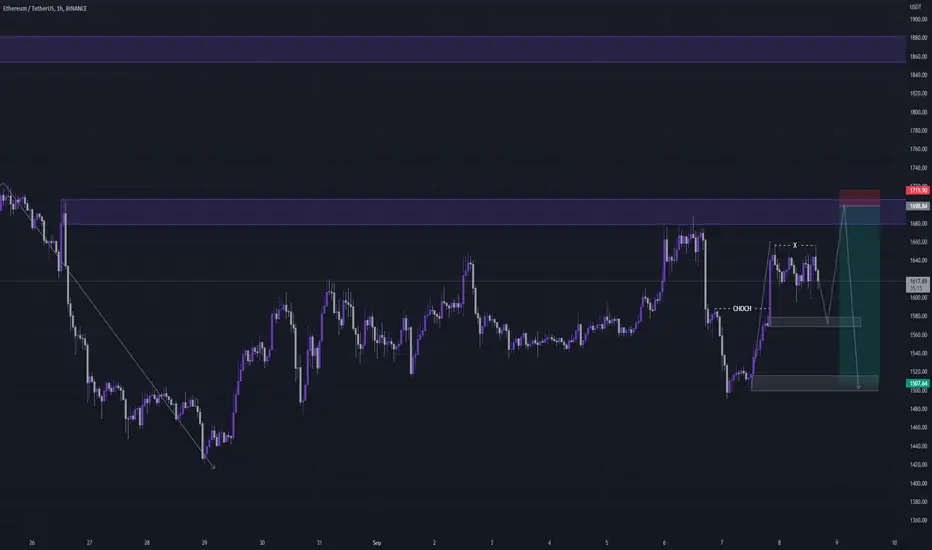
ShortPrice is still on a critical weekly and monthly supply zones. Last week's candle did not manage to break previous weekly highs signifying probability of reversal. What we need to see is clear BMS on H3/H2, then RTO or retest of BMS for short positions. The breaking candle needs to have momentum.
All the best.
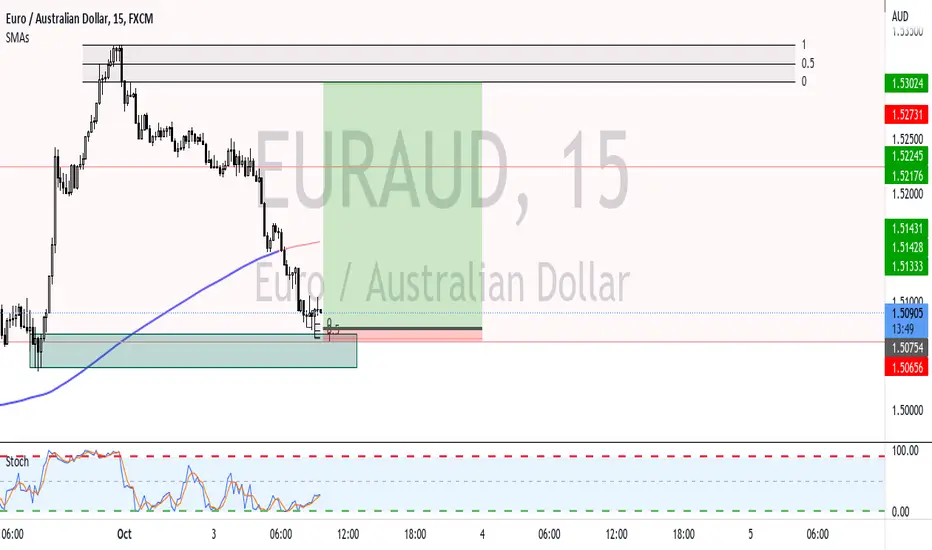
Possible Long play on Eur/Aud this seems like a possible play based on supply and demand tied in with market structure. Its a counter-trend trade because I believe the higher time-frame bias is bearish. So ill try and buy from demand into the extreme supply zone and look for a possible sell opportunity from the if possible.
LONG GU into HTF POI for Shorting long termThis breakdown shows why I think we should continue this week retracing back to the last extreme which took out structure before continuing to short.
Let me know what you guys think

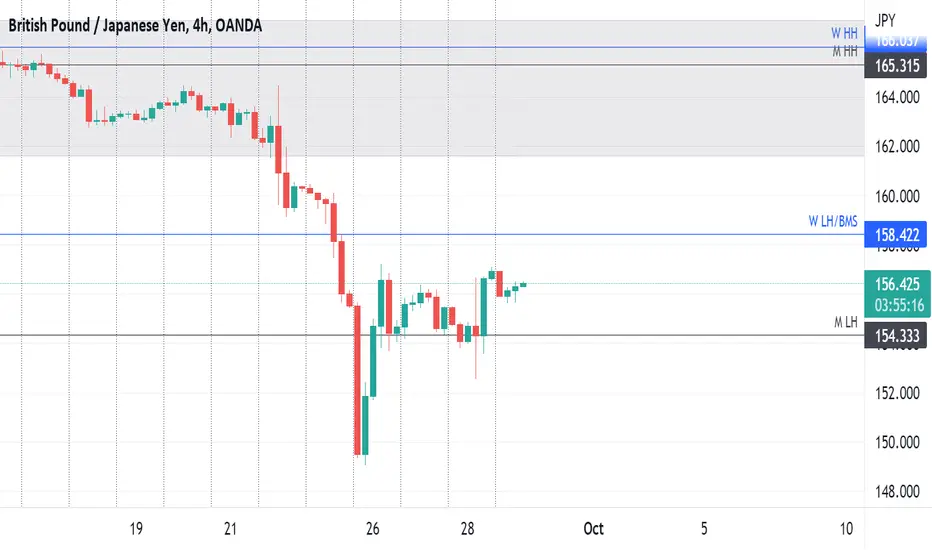
BUYPrice appears to have obeyed the major demand zone, indicating long opportunities. The only challenge is that it hasn't done a clear Break of market structure on H4 or lower timeframes. It's more of ranging at the moment. However a clear BMS with momentum will push price up to 158.42 and 162 area.
To enter long positions, wait for clear BMS, enter with RTO or BMS retest. All the best
USDJPY EURUSD AUDUSD GBPUSD Markup No trade for me todayIt's FOMC Day today. Im in Asia. I wont be getting into any trades until tomorrow asia time after the FOMC result.
Just a few thoughts. 75bps is pretty much priced in the market, so i think if its only 75bps plus a dovish message along with it I think market well have a breather and see DXY correcting. Anything higher than 75bps is gonna be wild..
Goodluck trading out there.
here are some markups
USDJPY
eurusd
audusd
tradingview.sweetlogin.com
gbpusd
1w trading below quarterly level looks over extended very bearish
4h no sign of reversal. Prev candlw was a bullish one but current seems bearish . Stay away
NAS Intraday/Scalp ShortNasdaq, potential setup to go short, targeting the zones below where price could reverse and go long

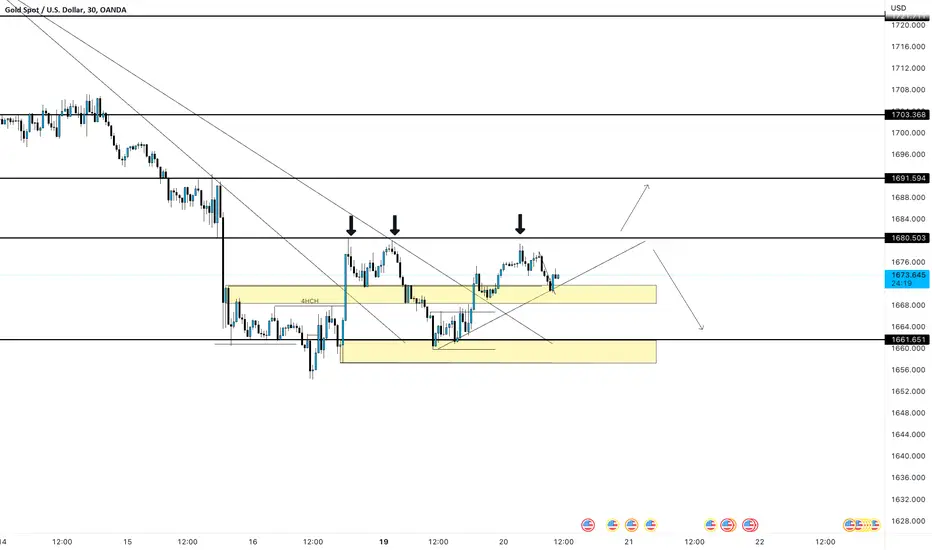
If 1680.500 continues to reject i'll be looking for shorts!Gold - Price sitting in a 4H range, If 1680.500 continues to reject i'll be looking for shorts, the Daily has failed 3 times to break this resistance level, maybe we see a Liquidity hunt of the highs today and a continuation down but lets see, price currently rejecting from 1671.000 zone, if price continues to fail to break this level i’ll look for short term buys towards the highs with confirmation.
Let me know your gold thoughts!
4R ETH Long trade ideaLooking to long ETH from the area shown
Same as my previous BTC setup in terms of structure.
Bullish 4hr inside of a 1D bearish strcuture.
Inducement created on the 15m, looking for a sweep of that into my refined entry limit.
Risk entry.
4R trade.
Follow me for more trades.
Eurjpy ready to big drop enter with beginning trendEurjpy ready to big drop enter withthe beginning trend we expect market ready to drop we will enter from supply zone.

$ETH Short 4R TradeOpened a ETH short here.
4hr protected high supply zone got tapped into... overall structure is bearish so expectation is for this high not to get broken.
Decently strong rejection from the 4hr supply.
I took a risk entry but feel free to wait for CHOCH on 15M on close below on range drawn out and ride down to TPs.
4R trade.
Taking profits aggressively..
Follow me for more trade ideas!
EURUSD sell opportunity at supply zoneEURUSD sell opportunity at supply zone, it is not for huge move. This analysis for day trading only. You need to lower time frame confirmation to take a sell. Must follow proper money management, thank you.
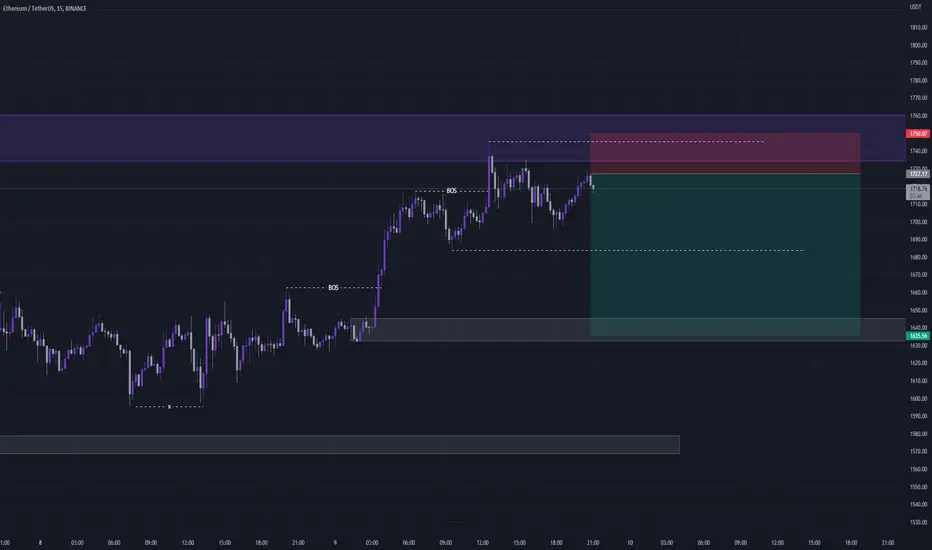
9R ETH Long scalpLooking for long ETH from this level, price has created 15m bullish structure but we have to bare in mind out high time frame supply zones so looking to take profits aggresively.
Longing up until my short limit i just posted about.
Risk entry.
9R Trade
Follow me for more trades.
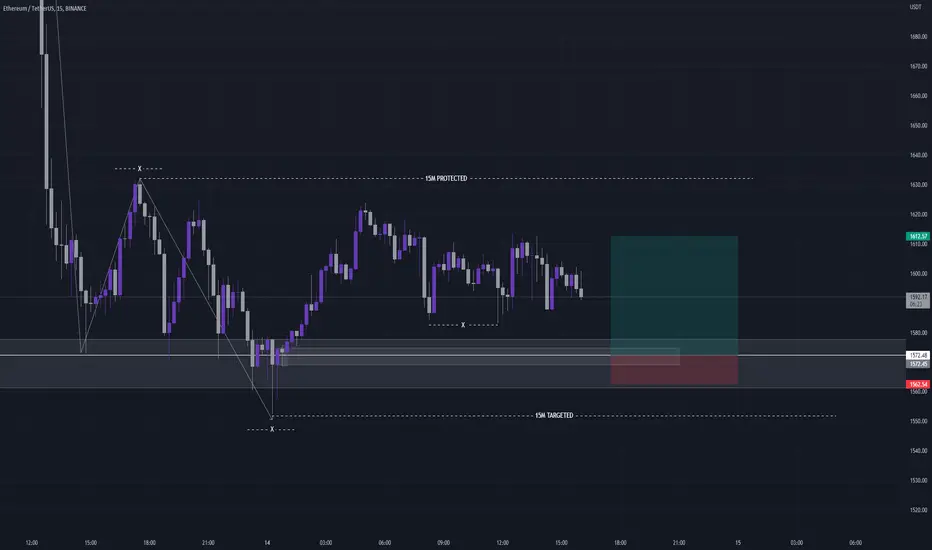
$ETH Short idea 11R$ETH Short idea...
11R trade with tight stops, im looking for ETH to follow my plan shown.
4hr is still bearish so looking for a LH to form then to target lows.
Looking for a sweep of liquidity into my limit order risk entry fill then for a quick bounce to the downside from my supply zone.
Will be taking profits aggrresively.
11R Trade setup.
Follow me for more trade ideas
3R BTC Short ScalpMy entry filled in this BTC short scalp to perfection. Sweep of liquidity into my limit fill.
Scalping the 15m structure high, into the low.
3R Trade
Follow me for more trades.
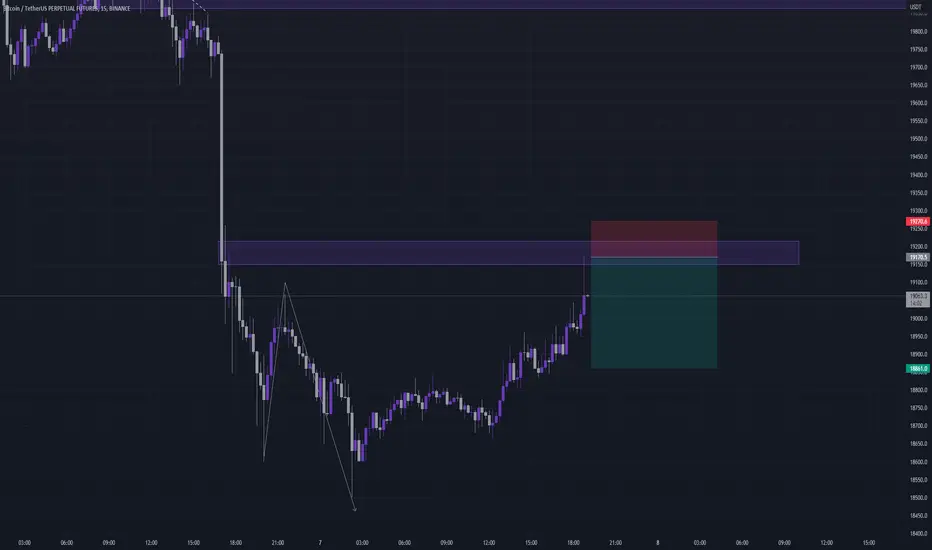
$BTC 4.5R Short Trade IdeaLooking to short $BTC in the area shown on the chart..
4hr and 1D orderflow is still very bearish, so looking for BTC to form at LH at our point and ride it down into 4HR swing lows creating that BOS.
4hr, 1HR supply zone shown on chart.
4.5R trade...
Will be taking profits aggresively.
Follow me for more ideas.
