XAUUSD 4H AnalysisXauusd breaks the downward trendline and changes its direction toward important resistence levels 3369-3374. This zone is very important based on ichimoku, so we expect good reaction. after the reaction, the chart will be updated.
important support level is 3317.
Support

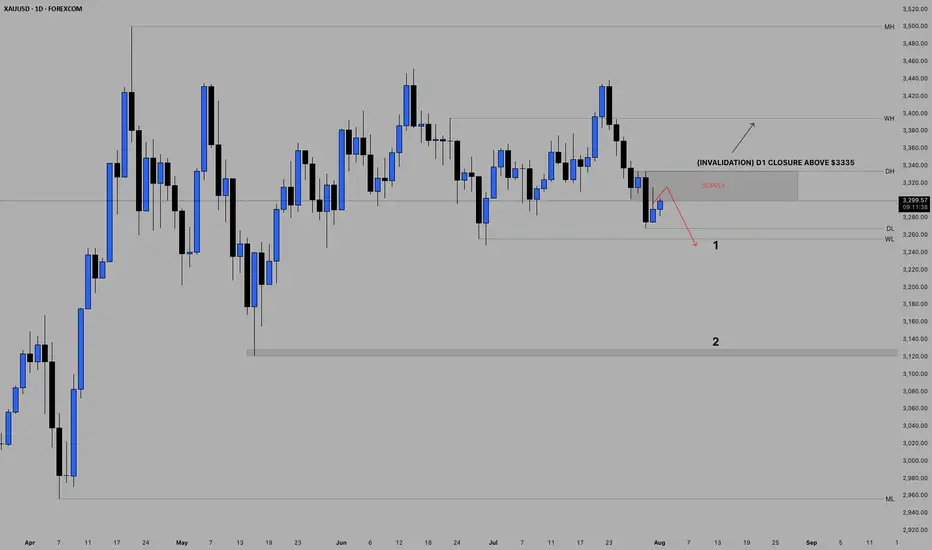
POSSIBLE BEARISH CONTINUATION ON GOLDBased on price action, Gold presents a very bearish sentiment from the daily point of view.
The indicated supply region may be the area of interest for the build up of the sells if indeed Gold is bound for the monthly lows.
Confirmation is needed for an entry.
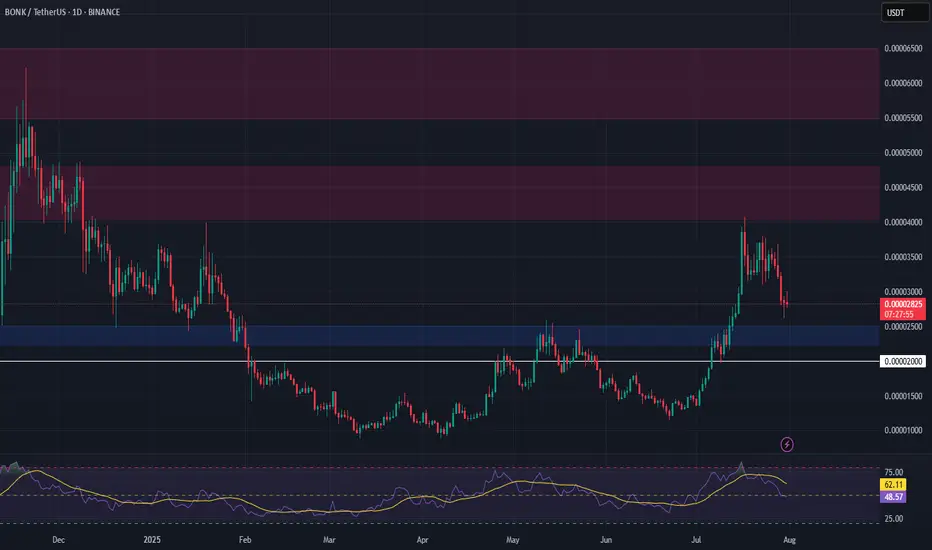
BONK Setup – Watching for Retracement After 200%+ RallyBONK has surged over 200% in recent weeks. We're now eyeing a retracement to a key support zone that could offer a prime entry for the next leg higher.
📌 Trade Setup:
• Entry Zone: $0.00002240 – $0.00002500
• Take Profit Targets:
o 🥇 $0.00004050 – $0.00004800
o 🥈 $0.00005500 – $0.00006500
• Stop Loss: Just below $0.00002000
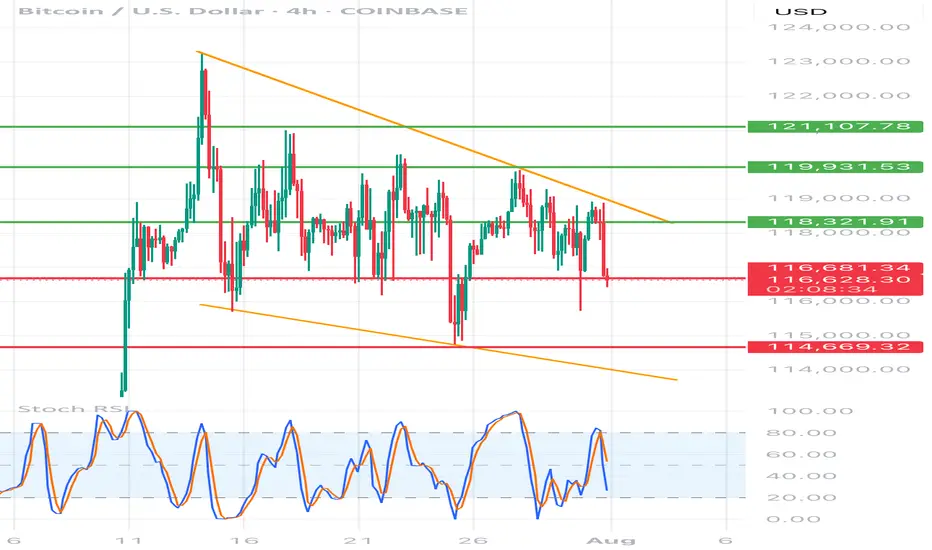
BTC/USD 4h chart🔸 Formation: Triangle descending (descending)
• Upper trend line (orange) - inheritance, connects lower and lower peaks.
• Lower support line (red) - approx. 116,700 USD - key support, tested many times.
🔻 Support
USD 116,700
Tested several times, currently threatened
🔻 Another support
USD 114,669
Target level when struck with a triangle
🔼 Resistance
USD 118,321
The nearest resistance - the former level of support
🔼 Resistance
USD 119,931
Local peak
🔼 Strong resistance
USD 121,107
Upper level of structure
📉 STOCHASTIC RSI (lower indicator)
• Line cutting and a decrease in the purchase area (> 80) towards the center.
• No extreme sales signal, but the trend begins to be negative.
⸻
📌 Applications and possible scenarios:
🔻 Bearish script (more technically likely):
• If BTC breaks below USD 116,700 with a 4H candle closure, possible:
• a decrease around USD 114,669 (lower limit of the triangle)
• Even lower - around 113,500-112,000 USD with an increased volume
🔼 Bullly script (less likely but possible):
• needed quick breaking above USD 118,300 and maintaining above this level
• Then the goal will be USD 119,931, and then possible traffic up to USD 121.107
⸻
📍 Summary:
• We see classic triangle descending-pro-draft formation.
• Support 116,700 USD very close to breaking - if it falls, down movement can be dynamic.
• Stochastic RSI coincides with the deterioration of the moment.
• The inheritance scenario seems dominant, unless there is a strong demand and over 118,300 USD.
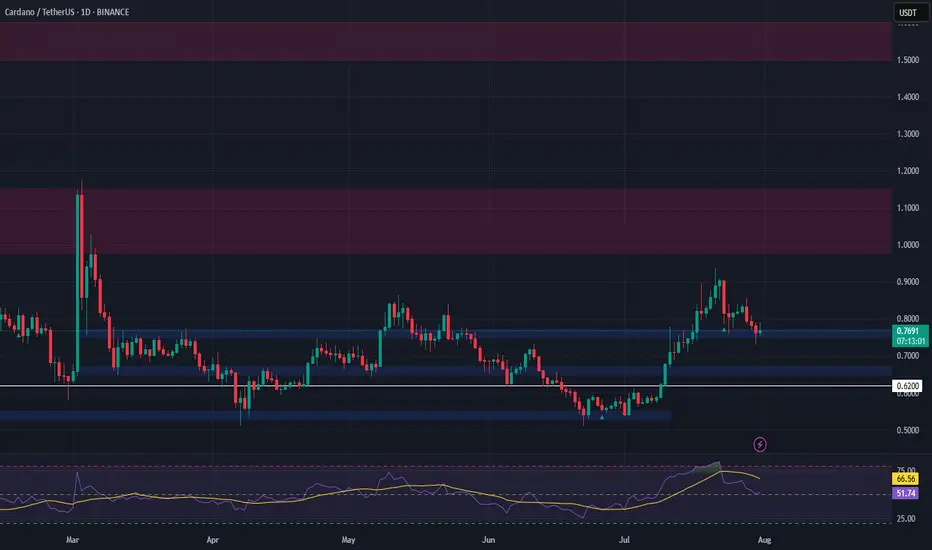
ADA Setup – Eyeing Entry After 70%+ RallyCardano (ADA) has surged over 70% in recent weeks. A healthy pullback is underway, and we’re watching the key support zone for a potential long entry targeting the next leg higher.
📌 Trade Setup:
• Entry Zone: $0.65 – $0.67
• Take Profit Targets:
o 🥇 $0.98 – $1.15
o 🥈 $1.50 – $1.60
• Stop Loss: Just below $0.62
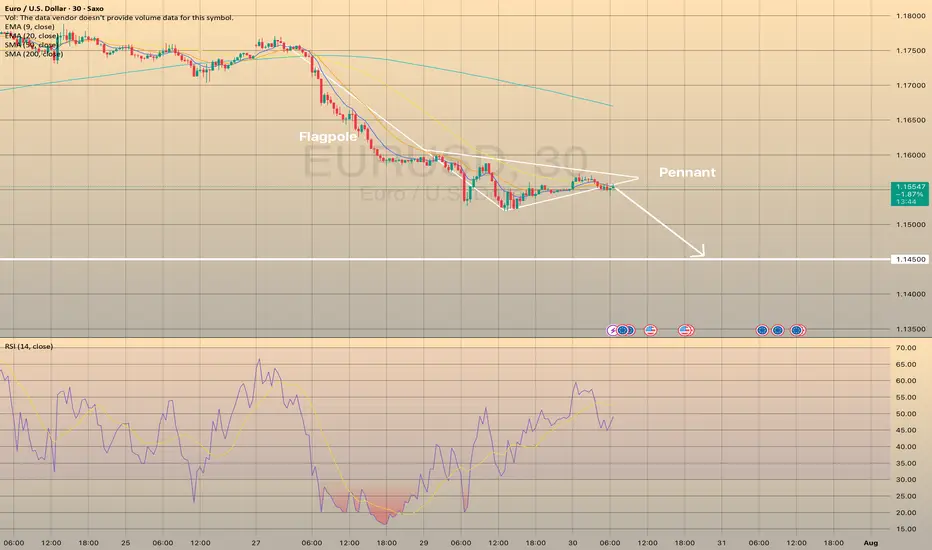
EURUSD FORMED BEARISH PENNANT. THE PRICE IS READY TO DROP.EURUSD FORMED BEARISH PENNANT. THE PRICE IS READY TO DROP.
EURUSD has been trading sideways within the last day, showing lower highs and higher lows. Eventually, the price has formed the pennant chart pattern.
What is a pennant?
A pennant chart pattern is a short-term continuation pattern in technical analysis, resembling a small symmetrical triangle, formed after a strong price movement (flagpole). It consists of converging trendlines, indicating a brief consolidation before the trend resumes. Bullish pennants form after an uptrend, bearish pennants after a downtrend.
The price is expected to decline towards 1.14500 support level
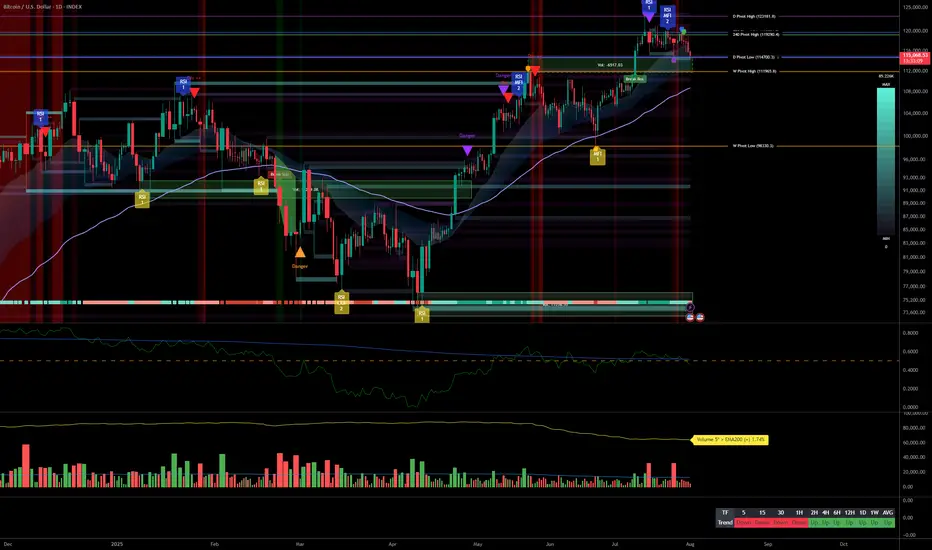
Bitcoin Facing Macro Volatility: Key Supports Hold Firm__________________________________________________________________________________
Technical Overview – Summary Points
__________________________________________________________________________________
Momentum: Dominant bullish bias on higher timeframes (1D to 2H).
Key Supports/Resistances: Key pivot zone at 114.7K–115.8K defended across all timeframes; major resistances at 119.7K, upside extension to 122.3K.
Volume: Peaks on breakout, normal to high volumes depending on TF, no signs of seller capitulation.
Behavioral Indicators: Risk On / Risk Off Indicator remains strong on all strategic TFs; ISPD DIV neutral except for a defensive buy signal on 1H.
Multi-timeframe summary: Broad horizontal consolidation, no panic or euphoria detected. Major supports overlap, confirming structural strength amid macro volatility.
__________________________________________________________________________________
Strategic Summary
__________________________________________________________________________________
Overall bias: Bullish above 114.7K; neutral/slightly bearish below this key level.
Opportunities: Longs via scalping/range trading on reactions at 114.7–115.8K; swing accumulation on daily/4H stabilization above 115K.
Risk: Break below <114.7K, macro volatility around NFP/PMI, false breakouts.
Macro catalysts: Expanded US tariffs (Trump), NFP, PMI, Fed status.
Action plan: Reactivity on pivots, reduce exposure during macro events, hard stops <114.5K H4.
__________________________________________________________________________________
Multi-Timeframe Analysis
__________________________________________________________________________________
1D: Working the 114723 pivot support. Bullish momentum, no excessive selling, Risk On / Risk Off Indicator “STRONG BUY”.
12H-6H: Building a bottom on the daily base; sustained volumes during sell-off, no panic, technical buy signals emerging.
4H-1H: Vigorous support defense, 1H ISPD DIV “buy” signal. Healthy range pattern; volumes up during rebound attempts.
30min-15min: Slow recovery after high-volume drop, no euphoria or capitulation. No “trap” or imminent squeeze, favorable for tactical trades.
Risk On / Risk Off Indicator: Higher TFs (1W/1D/12H/4H) show strong bullish signals, boosting risk confidence. Decorrelation with lower TFs allows flexible management, controlled accumulation, tight stops at 114.7K.
__________________________________________________________________________________
Macro & BTC Context Summary (Twitter)
__________________________________________________________________________________
Macro: US tariff shock, max volatility likely, amplified moves in equities and crypto.
Bitcoin: Sharp correction post-record close, but solid supports remain, no sign of trend end.
Integration: Technical status quo; favor defensive accumulation, caution on NFP/PMI.
__________________________________________________________________________________
Actionable Synthesis: Plan & Risk Management
__________________________________________________________________________________
Strategies: Longs/scalp >114.7K; swing/accumulate post daily/4H confirmation; partial TPs near 119.7K/122.3K.
Risk Zones: Hard stop <114.5K. Tight monitoring around NFP for volatility spikes.
Reward: Risk-to-reward >2 if buying lower range with strict stops.
__________________________________________________________________________________
Key Macro Events to Watch
__________________________________________________________________________________
2025-08-01: US NFP, unemployment, hourly wages – High volatility expected, possible swings
2025-08-01: ISM Manufacturing PMI – Short-term trend confirmation or invalidation
2025-07-30: FED conference – Range-bound / Moderate volatility
US Tariffs (Trump) – Global risk-off, caution BTC & tech
__________________________________________________________________________________
Conclusion
__________________________________________________________________________________
BTC consolidates steadily between 114.7K–122.3K despite macro shocks
Daily/H4 supports robust, Risk On / Risk Off Indicator strong on higher TFs
Accumulation/scalping favored as long as supports defended
Main risk = break of 114.7K, imminent macro volatility
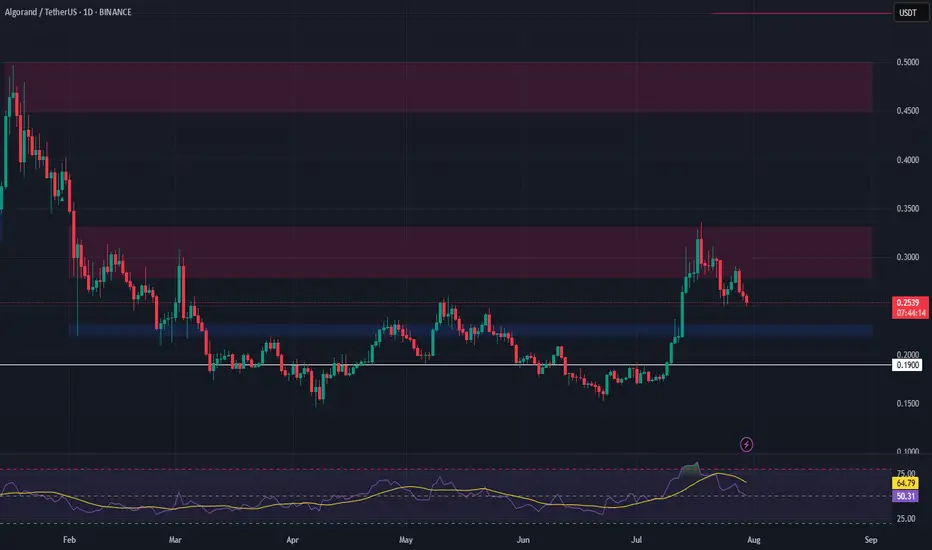
ALGO Swing Trade – Waiting for Pullback to Key SupportAfter a 100%+ surge, ALGO is now retracing and approaching a critical support zone. A dip into this area could offer a strong entry for the next leg higher.
📌 Trade Setup:
• Entry Zone: $0.22 – $0.23
• Take Profit Targets:
o 🥇 $0.28 – $0.33
o 🥈 $0.45 – $0.50
• Stop Loss: Just below $0.19
MKR/USDT 4H Chart📉 Short-term situation:
The price is currently trading around 2028 USDT, after a sharp decline from around 2273 USDT (resistance).
The support level around 2000 USDT is currently being tested (coinciding with the SMA 200 – blue line).
A dynamic uptrend line (orange) is also visible, which could act as a key support level in the event of further declines.
🔍 Support and Resistance Levels:
Resistance:
🔴 2188 USDT – recent local high and convergence with the SMA 21.
🟢 2273 USDT – major resistance; previous rebound and point of significant price reaction.
Support:
🔵 1980 USDT – local support + SMA200.
🟠 Uptrend line (~1940–1960 USDT).
🔴 1832 USDT – stronger horizontal support with multiple confirmations.
🔴 1623 USDT – very strong support, from previous lows.
📊 Technical indicators:
RSI (Relative Strength Index):
Current value: ~42, neutral, but approaching the oversold zone (<30).
The RSI is falling rapidly, suggesting selling pressure, but a reaction is possible near current support.
MACD:
Negative signal: signal line crossing from above + descending histogram.
Indicates a continuation of the correction, but we are approaching the potential exhaustion of the downward momentum.
📈 Moving averages:
EMA/SMA 50 and 200:
The price is currently testing the SMA200 – crucial for the medium-term trend.
SMA21 (red) and SMA50 (green) – have reversed downward, which may suggest a weakening of bullish momentum.
🔮 Scenarios:
🟢 Bullish scenario (confirmation of support):
A rebound from 1980–2000 USDT and further upward movement.
Potential target: first ~2180 USDT, then ~2273 USDT.
The condition is a demand response at the current level + an improvement in the RSI/MACD.
🔴 Bearish scenario (breakout of support):
If the 1980 USDT level is broken and the price falls below the uptrend line, a continued decline to 1832 USDT or even lower is possible.
Confirmation will be a strong bearish candle with high volume and a further decline in the RSI/MACD.

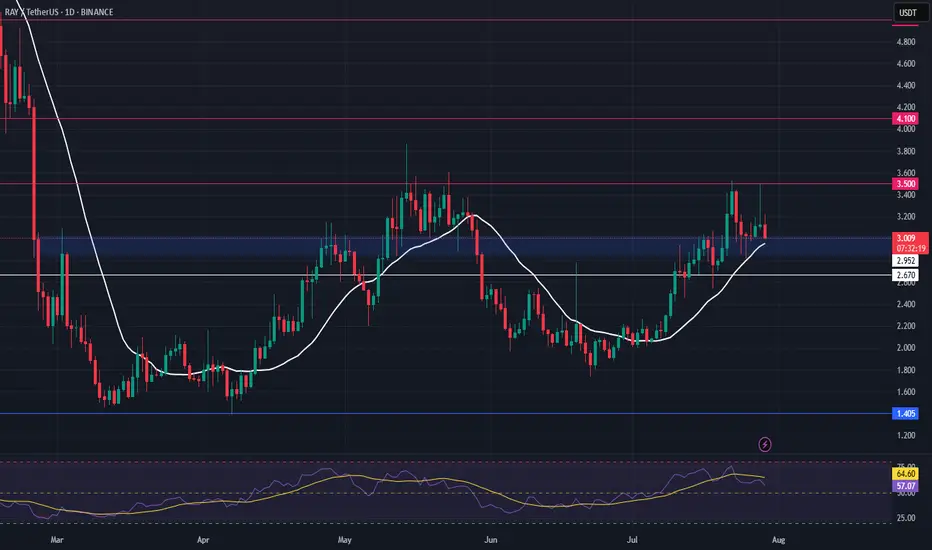
RAY Swing Trade – Key Support Retest in PlayRAY is pulling back toward a major support zone, offering a solid opportunity to position for a bounce as market structure remains constructive.
📌 Trade Setup:
• Entry Zone: $2.85 – $3.02
• Take Profit Targets:
o 🥇 $3.50
o 🥈 $4.10
• Stop Loss: $2.67
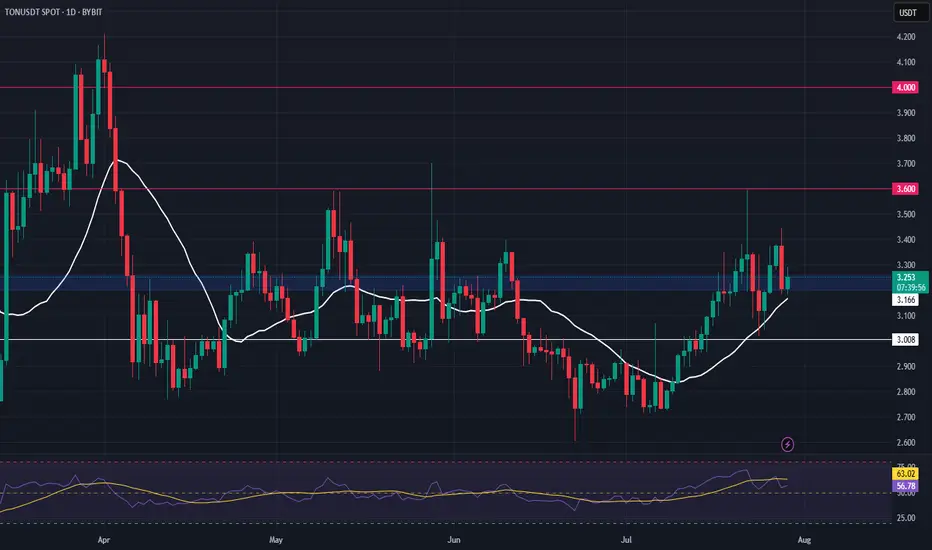
TON Swing Trade – Support Zone in FocusTON is holding a major support level, setting up for a potential bounce. With structure intact, this offers a favorable long entry for swing traders looking to capitalize on the next leg up.
📌 Trade Setup:
• Entry Zone: $3.20 – $3.35
• Take Profit Targets:
o 🥇 $3.60
o 🥈 $4.00
• Stop Loss: $3.088
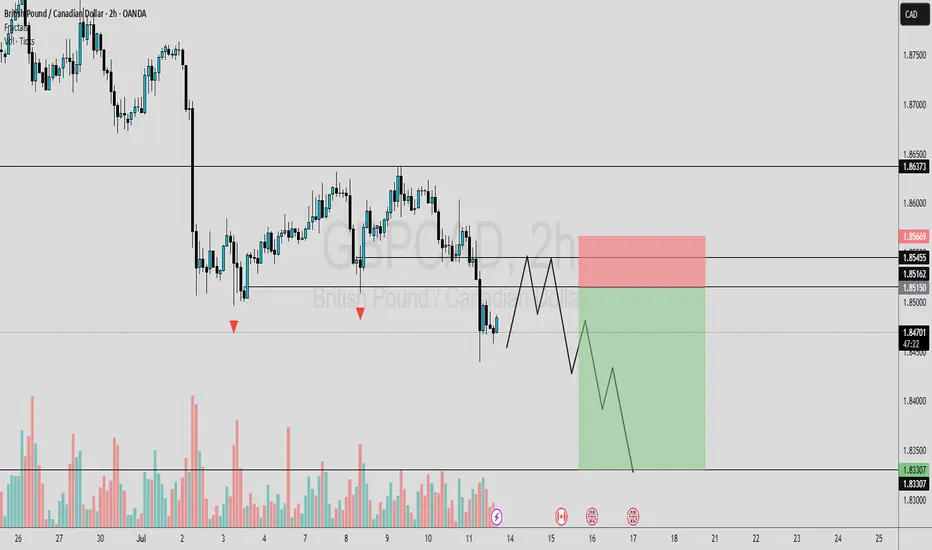
GBPCAD OUTLOOKIn this analysis we're focusing on 2H time frame for finding possible upcoming movement in price. So as per my strategy today I'm looking for a sell trade opportunity. Confirmation is very important, after confirmation we'll execute our trade. Let's see which opportunity market will give us.
Always use stoploss for your trade.
Always use proper money management and proper risk to reward ratio.
This is my prediction.
#GBPCAD 1H Technical Analysis Expected Move.
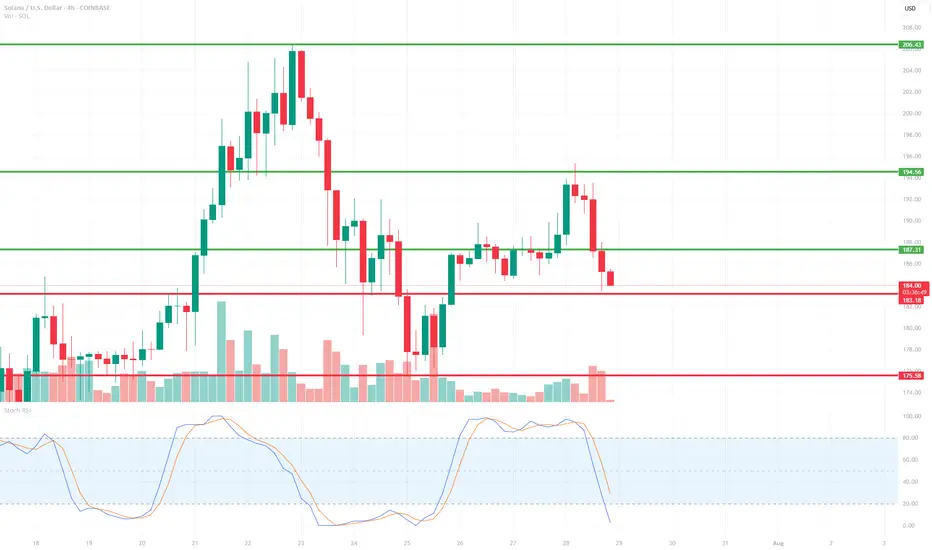
SOL/USD 4H📉 Price
Current price: approximately $183–$184
We see a decline from the resistance zone around $194.56. The price has broken through support at $187.31 and is heading towards lower support at:
🔴 $183.18 – local support (being tested now),
🔴 $175.58 – key support (potential target if current support breaks).
📊 Market structure
Short-term trend: Downtrend (lower highs and lower lows after a rebound from $194.56).
Volume: Increased volume on bearish candles – confirming supply pressure.
Previous trend: Uptrend with strong momentum from July 18th to July 21st.
🔁 Technical Levels
Resistance:
🟢 USD 187.31 – last broken support, now acting as resistance.
🟢 USD 194.56 – strong resistance (tested twice).
🟢 USD 206.43 – local high, strong resistance level from higher timeframes.
Support:
🔴 USD 183.18 – currently being tested.
🔴 USD 175.58 – stronger support from lower swing highs.
📉 Stochastic RSI
Located in the oversold zone (<20) and pointing down.
No upside crossover yet → no buy signal yet.
If a reversal occurs, a technical rebound is possible.
📌 Conclusions and Scenarios
🔻 Downside scenario (more likely currently):
Breakthrough of support at $183.18 ➜ further decline to $175.58.
Potential entry into a correction of the entire upward movement from July 18-21.
🔺 Upside scenario (alternative):
Support at $183.18 held + Stoch RSI signal ➜ rebound to $187.31.
If buying volume increases, a retest of resistance at $194.56 is possible.
BTC/USD Buy Setup (6H Chart)📈 BTC/USD Buy Setup (6H Chart)
Strategy: Trendline Support Bounce
🔹 Entry
Price: $118,674.3
Reason: Price is bouncing off a supportive trendline and holding above the 1st Support zone.
🔻 Stop Loss (SL)
Price: $114,470.6
Reason: Below the 1st Support zone to protect against breakdown.
🎯 Take Profit Targets
TP1: $123,269.6
Reason: Near recent swing high, good for partial profit.
TP2: $127,661.4
Reason: Next resistance zone, ideal for full exit or trailing stop.
#MJTrading
#Bitcoin

ETH/USDT 4H Chart📊 General Context
Ethereum is rising in a strong short-term uptrend, supported by a rising trendline (orange).
Current price: 3831 USDT
We are approaching a significant resistance level around 3842–3850 USDT (green line).
Technical support is located around 3760 USDT (previous consolidation level and 50/200 SMA).
🔍 Technical Levels
Resistance:
3842–3850 USDT – local high, currently being tested.
4006 USDT – key psychological level and the last local high on the chart.
Support:
3762 USDT – previous resistance, currently turned into support (may be tested in a correction).
3650 USDT – strong technical support, confirmed several times in the past.
SMA50 and SMA200 – currently just below the price, also acting as dynamic support.
📈 Technical Indicators
MACD:
The histogram is rising and positive → bullish momentum.
The MACD line crosses the signal line from below → a buy signal.
RSI (14):
Currently: around 64 → not yet overbought, but close to the overbought zone.
Slightly rising trend, but may suggest impending market overheating with further gains.
🧭 Trend
Short-term: strong uptrend (trend line, green candles, breakout from consolidation).
Medium-term: higher lows and higher highs – the uptrend is maintained.
The price is holding above the 50 and 200 SMAs – confirming bullish sentiment.
⚠️ What to watch next?
A 4-hour candle close above 3842 USDT → confirmation of a breakout, a potential attack on 4000–4010 USDT.
A break of the trend line (orange) → a possible correction to 3760 or even 3650 USDT is possible.
An RSI rise above 70 → an overbought signal, a possible pullback or consolidation.

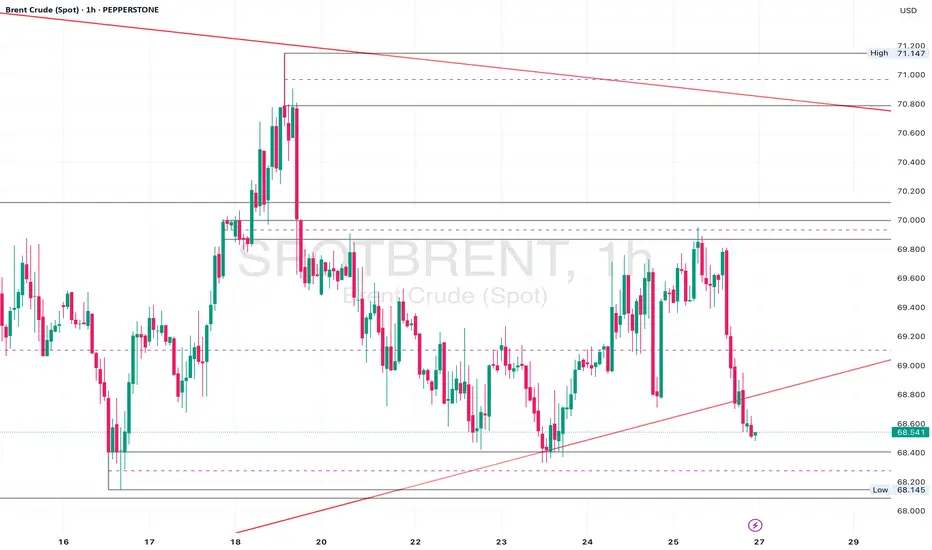
Brent Crude Sitting at Key Support – 69.20 Hold for a Rebound?Daily Analysis:
Price is holding above the ascending trendline and forming higher lows. Multiple rejections from the 68.00 region suggest strong demand. As long as we remain above the trendline, bulls stay in control.
4H Analysis:
Pullback after rejecting 71.00. Now sitting inside the 69.60–69.20 demand area. Bullish channel is still valid unless we break below 68.50.
1H Analysis:
Price broke the rising channel but is now hovering near key support. Bullish re-entry possible if lower timeframe aligns around 69.60.
Confirmation & Entry:
If we see bullish engulfing or pin bar at 69.60–69.20, this could signal a long setup back to 71.00. Invalidated on clean break below 68.50.
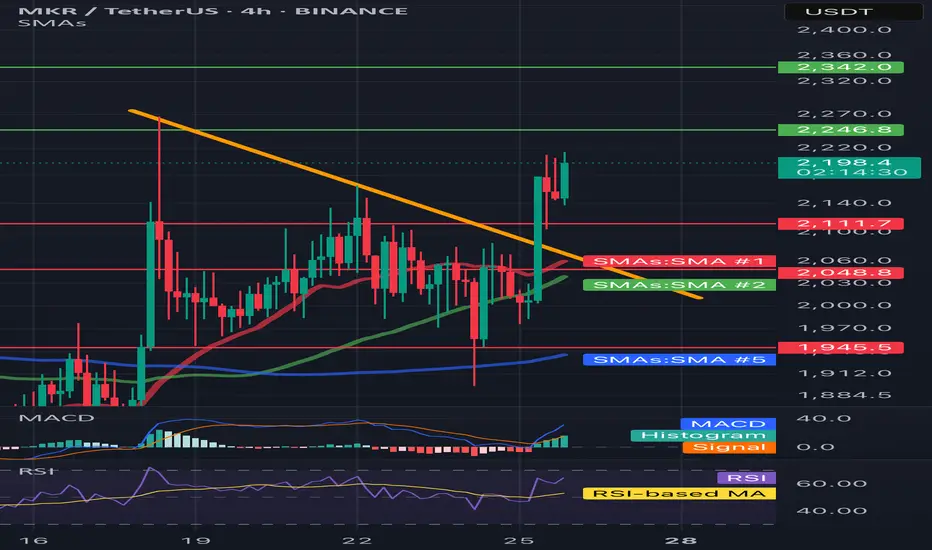
MKR/USDT 4H📈 Trend and price structure
• The price has just been above the downward trend line (yellow line), which suggests the potential reversal of the trend to the upward.
• Breaking was strong - a candle with a large growth volume and an increase +9.13%, which emphasizes the pressure of buyers.
⸻
🔍 levels of support and resistance
• resistance:
• ~ 2342 USDT - a clear level of resistance (green line) - may be the target for the next upward movement.
• 2246.8 USDT - first resistance to overcome.
• Support:
• 2111.7 USDT - level of local support after struggling (earlier resistance).
• 2048.8 USDT - SMA #1 (red medium), can be support at the back.
• 1945.5 USDT - strong support in the form of long -term SMA (blue line, SMA #5).
⸻
📊 Technical indicators
✅ MacD (below)
• The MacD line cut the signal line up - buy signal.
• The histogram is growing, which confirms the growth moment.
✅ RSI
• RSI has bounced from level 40 and is currently above 60 - it suggests upward momentum, but it is not yet purchased, so there may be room for further growth.
⸻
✅ Medium walking (SMAS)
• The price was pierced by SMA #1 (red) and SMA #2 (green) with impetus, which means a change in sentiment.
• If it stays above these medium - a bull signal.
• SMA 50 (green)> SMA 200 (blue) = potentially a golden cross is formed on a longer TF.
⸻
📌 Summary - technical scenario:
🐂 Bycza scenario:
• If the price lasts above 2111.7 USDT, it may continue to increase to USDTt and further up to $ 2,342.
• Confirmation will be the continuation of growth on MacD and RSI over 60-70.
🐻 Bear scenario (threats):
• If the price drops below 2048 USDT, possible correction up to 1945 USDT.
• RSI returning below 50 and Macd Cross down would be a reversal signal.
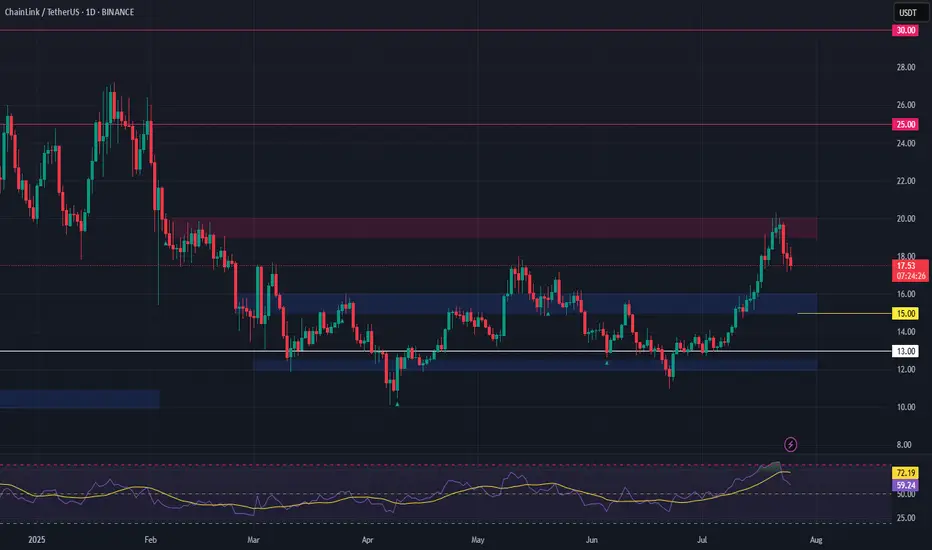
LINK Swing Trade – Watching for a PullbackLINK has rallied 58% since June 24th and is now consolidating after making a higher high. Price action is facing resistance and looks overheated, so a pullback toward support could offer a fresh long entry.
📌 Trade Plan:
• Entry Zone: $15.00 – $16.00 (on pullback)
• Take Profit Levels:
o 🥇 $20
o 🥈 $25
o 🥉 $30
• Stop Loss: Close below $13
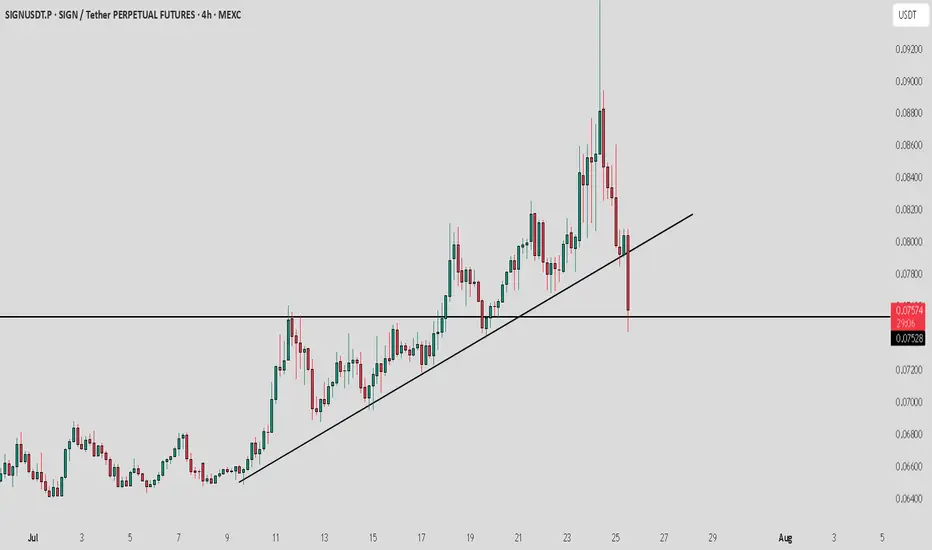
Sign / USDT : Huge breakdown and currently sitting on supportSIGN/USDT Analysis:
SIGN is testing a crucial support level. The price has pulled back from its recent highs and is now sitting on a key Horizontal line. How the market reacts here will determine the next move.
Bullish Scenario:
Horizontal line Support: If the price holds above the Horizontal line and shows signs of buying pressure, a bounce could happen, and we may see the price move back up towards the previous highs.
Confirmation: Look for strong bullish candles or an increase in volume to confirm the bounce.
Bearish Scenario:
Horizontal line Breakdown: If the price breaks below the Horizontal line and fails to recover, further downside could be expected.
Target: Watch for the next support level to gauge the downside potential.
Note:
The market is volatile, and a shakeout could happen at any moment. Manage your risk carefully and only invest what you can afford to lose. Stay cautious and watch for confirmation before entering any positions.
GBPUSD Idea – Demand Zones & Potential Reversal Play🧠 MJTrading:
After a steady downtrend, GBPUSD is now approaching a strong 4H demand zone (Support 1), where we previously saw explosive bullish reactions.
Price is also extended from both EMAs, showing potential for a technical pullback or full reversal.
💡Scenarios to consider:
🔹 If Support 1 holds → we may see a bounce toward 1.3500+
🔹 If broken → Support 2 & 3 offer deeper liquidity and high-probability demand zones
👀 Watch for:
Bullish reversal candles (engulfing / hammer)
Bullish divergence on lower timeframes
Volume spikes on reaction
⚠️ Invalidation:
If Support 3 breaks with strong momentum, we might enter a bearish continuation phase.
#GBPUSD #Forex #ChartDesigner #SmartMoney #PriceAction #MJTrading #ForexSetup #TrendReversal #SupportZones

Bitcoin: Strategic Entry Plan on Pullback – 116k Buy Opportunity__________________________________________________________________________________
Technical Overview – Summary Points
➤ Bullish momentum across all higher timeframes (1H to 1W) supported by Risk On / Risk Off Indicator (Strong Buy).
➤ Major supports: 116,128 and 111,980 (multi-timeframe pivots). Key resistance at 123,218.
➤ Very high intraday volumes, pointing towards probable capitulation zones.
➤ Multi-timeframe behaviors: Technical rebound anticipated on the 116,128–115,600 zone, caution if 111,980 breaks.
__________________________________________________________________________________
Strategic Summary
➤ Global Bias: Bullish confirmed mid/long-term.
➤ Accumulation opportunities on key pullbacks near 116,128 and 111,980.
➤ Risk zone: sustained closes below 111,980 = invalidation of bullish outlook (target 105,100).
➤ Macro catalysts: FOMC meeting (July 29-30), heightened event-risk period.
➤ Action plan: favor entries after FOMC volatility resolution, stop-loss adjusted below 111,980.
__________________________________________________________________________________
Multi-Timeframe Analysis
Daily (1D) : Compression under 123,218 resistance, primary bullish trend, no extreme signals.
12H : Healthy consolidation under resistance, no euphoria or panic, normal volumes.
6H : Price squeezed between major supports (116,128–111,980), uptrend confirmed.
4H : Institutional volumes on supports, favors technical rebound.
2H : Speculative rebound underway, confirmation needed for short-term bottom.
1H : Strong capitulation signal, record volumes, immediate retest of 116,128 support.
30min : Local oversold status, extreme sentiment, high technical reversal probability.
15min : Phase of panic likely ending, short-term rebound anticipated.
Key Indicators:
Risk On / Risk Off Indicator: Strong buy on 1D–4H, neutral on 30min and 15min.
ISPD DIV: Neutral to Buy (capitulation signaled on 1H+30min).
Volumes: Very high at lows = capitulation + potential bottom.
MTFTI: Up momentum above 1H, down on lower timeframes (30–5min).
__________________________________________________________________________________
Cross Timeframe Synthesis
High timeframe alignment confirms bullish bias, supported by buyer volumes.
Key zone 116,128–111,980 = multi-timeframe support, tactical focus.
Main risk: break of 111,980.
__________________________________________________________________________________
Operational synthesis & macro context
Bullish bias validated unless breakdown below 111,980.
Tactical accumulation window on pullbacks, 1H confirmation needed.
Volatility risk increases ahead/during FOMC, dynamic stop management essential.
Altcoins fragile: extra caution if BTC triggers Risk Off.
Calendar to watch: FOMC (July 29–30), Durable Goods (July 25).
__________________________________________________________________________________
On-Chain (Glassnode) :
BTC consolidates, no extreme signs; ETH outperforming but caution on alts (elevated leverage).
__________________________________________________________________________________
⏳ *Decision Recap for July 25, 2025, 10:56 CEST:*
— BUY ZONE tactical at 116,128–115,600 (BTC), 1H confirmation required.
— Stop-loss below 111,980 / Swing target >120,000–123,218.
— Risks : Fed announcements, flushes on supports, altcoins at risk.
__________________________________________________________________________________

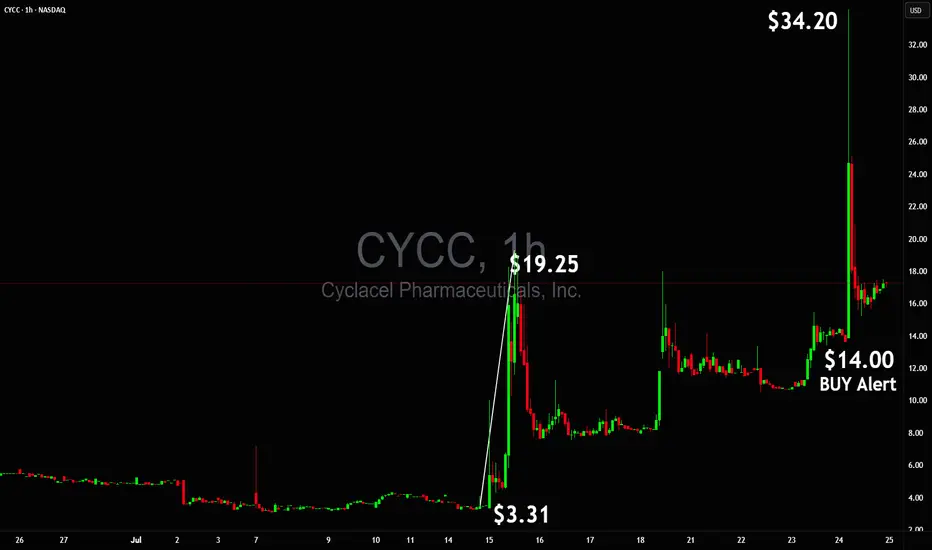
Buy Alert at $14, woke up to $34 $CYCC After missing the previous run because of no safe setup I made sure think time everyone who followed gets paid 🚀 Buy Alert $14, woke up to $34 NASDAQ:CYCC best stock of the day, got paid in a BIG WAY 🙌🏻
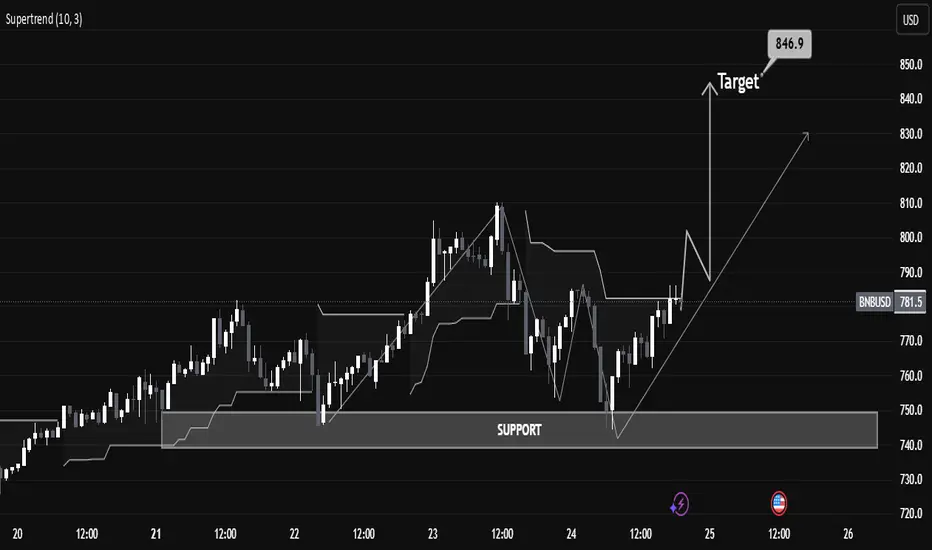
“BNBUSD Educational Breakdown – Support Rejection “BNBUSD Educational Breakdown – Support Rejection with $846 Target in Sight”
Market Structure Overview:
BNBUSD is exhibiting a bullish market structure after forming a textbook higher low at the major demand zone near $740–$750. This zone has been historically significant, offering strong rejections and triggering aggressive bullish rallies.
A new bullish wave appears to be forming after price respected the ascending trendline and reclaimed the supertrend level, now acting as dynamic support around $782.2.
⸻
🔧 Technical Confluences:
• Support Zone: Highlighted between $738–$750, serving as a demand base. Recent price rejection here confirms buyers’ dominance.
• Trendline Support: Price has respected an ascending trendline, signaling short-term trend continuation.
• Supertrend Confirmation: Trend flip has occurred—price is now trading above the Supertrend line, indicating a fresh bullish momentum phase.
• Break of Structure (BoS): Minor resistance around $784–$790 was breached, suggesting bullish continuation.
⸻
🎯 Target Projection:
Using recent swing highs and market symmetry, the next logical resistance lies at $846.9, aligning with the previous supply zone. This target also fits within the measured move from the support base to previous highs.
⸻
📈 Trade Plan (Educational Only):
• Long Bias Zone: Between $770–$780
• Invalidation Level: Below $738 (loss of support structure)
• Target: $846.9
• Risk-Reward: Roughly 1:2.5 – favorable for swing traders
⸻
📚 Educational Note:
This chart is an excellent example of:
• Structure trading (support/resistance)
• Trend confirmation using a dynamic indicator (Supertrend)
• Risk-managed entries with clearly defined stop-loss and take-profit zones.