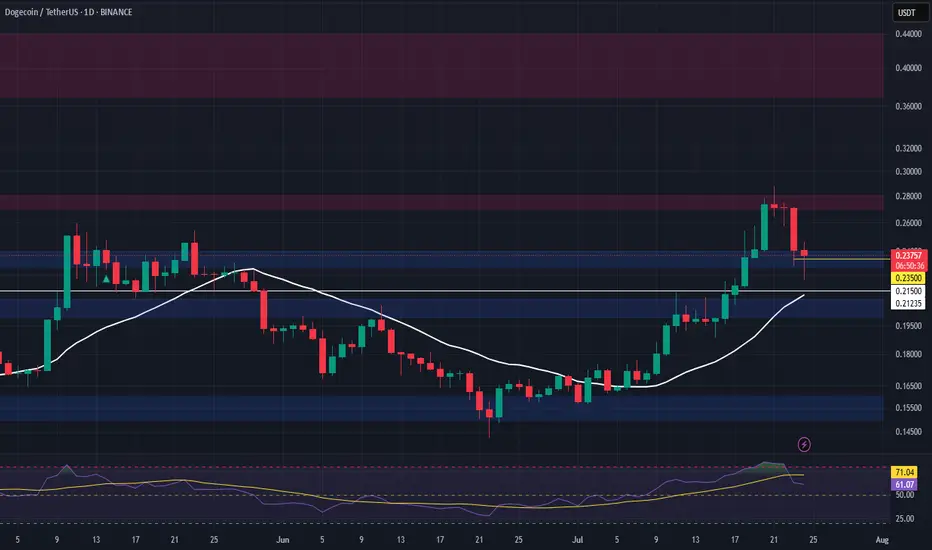
DOGE Swing Trade – Key Support in PlayDOGE is currently holding a major support zone, offering a strong risk-reward opportunity for a long swing position. With bullish sentiment and meme coin narratives returning, this level is worth watching for upside continuation.
📌 Trade Setup:
• Entry Zone: $0.23 – $0.24
• Take Profit Targets:
o 🥇 $0.27 – $0.28
o 🥈 $0.37 – $0.44
• Stop Loss: Just below $0.215
Support
Bitcoin Bullish Structure Holds: Focus on Support Entries & Brea__________________________________________________________________________________
Technical Overview – Summary Points
__________________________________________________________________________________
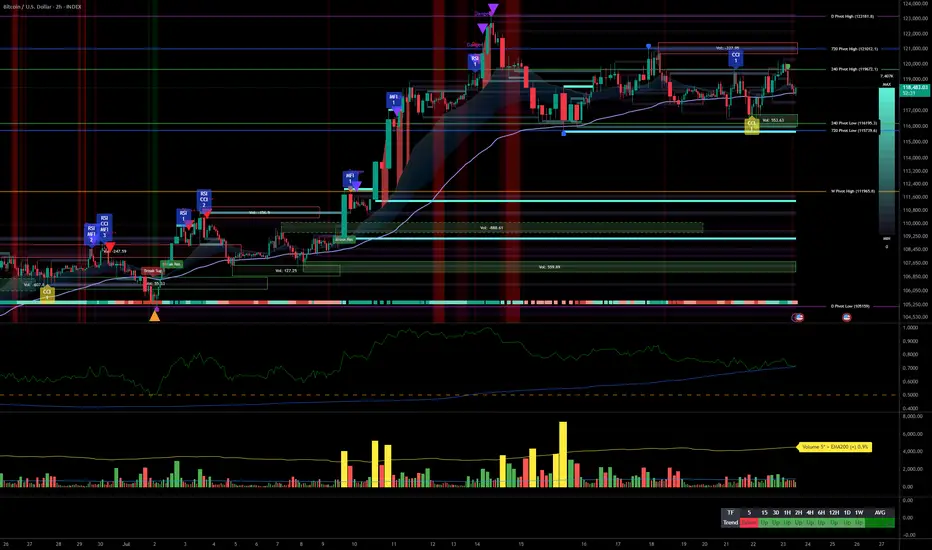
Momentum: Uptrend synchronization on all timeframes (MTFTI Strong Up). Risk On / Risk Off Indicator: strong buy on larger TF, neutral intraday.
Supports/resistances: Main HTF supports well below current price (115,736–117,000, 111,980). Key resistances to break: 120,998.7 and 122,318.
Volumes: Normal to moderate, no climax, no distribution detected.
Multi-TF behaviour: No behavioural excess, no sell signal, intraday phases are consolidative just below resistance, which is normal.
__________________________________________________________________________________
Strategic Summary
__________________________________________________________________________________
Overall bias: Strong bullish, no end-of-trend alert. Buying retracement towards the Pivot Lows is preferred.
Opportunities: Entries on dips to 115,700–117,000 (2H/4H); breakout above 120,250/122,300.
Risk zones: Return below 115,700 or 111,980 = structural alert. Increased vigilance for macro releases (ECB/PMI/Jobless Claims).
Macro drivers: Fed in focus (no move expected), volatility risk around July 29–30 (FOMC).
Action plan: Entry on retracement, dynamic management. Stop-loss under 115,736 then 111,980. Partial exits on excess or confirmed breakout.
__________________________________________________________________________________
Multi-Timeframe Analysis
__________________________________________________________________________________
1D: Resistances 122,318, 120,998.7; supports 115,736.9, 105,100.2. Risk On / Risk Off Indicator: strong buy, all synchronized bullish, no exhaustion. Daily bias: robust uptrend.
12H/6H/4H: Bullish confluence. Strong momentum, stable volume, validated supports. No ISPD excess, sectoral strength intact.
2H/1H: Consolidation below resistance; healthy structure. Supports to be favored for swing/intraday positioning. Minor intraday hesitation, no reversal.
30min/15min: Behavioural neutrality, lateral movement. Volume normal to mildly elevated, no overheating. Structural risk absent.
Additional indicators:
Risk On / Risk Off Indicator: Strong buy up to 2H; neutral on short TF.
ISPD DIV: Neutral, healthy market, no excess detected.
Volume: No climax or distribution, multi-TF structural support.
Cross-timeframe synthesis: Multi-timeframe bullish alignment, no structural weakness. Opportunities on retracement, breakout plays above all-time highs.
__________________________________________________________________________________
Synthesis & Strategic Bias
__________________________________________________________________________________
BTC trend and momentum remain aligned, sector leadership (Risk On / Risk Off Indicator) intact.
Strong HTF support, major resistances must break for extension.
External risk: macroeconomic catalysts (Fed, ECB, US PMI).
Premium opportunities on dips to supports, dynamic management essential around macro events.
Final bias: as long as supports and indicator alignment hold, bull run continues. Partial exit at resistance; stops below validated pivots.

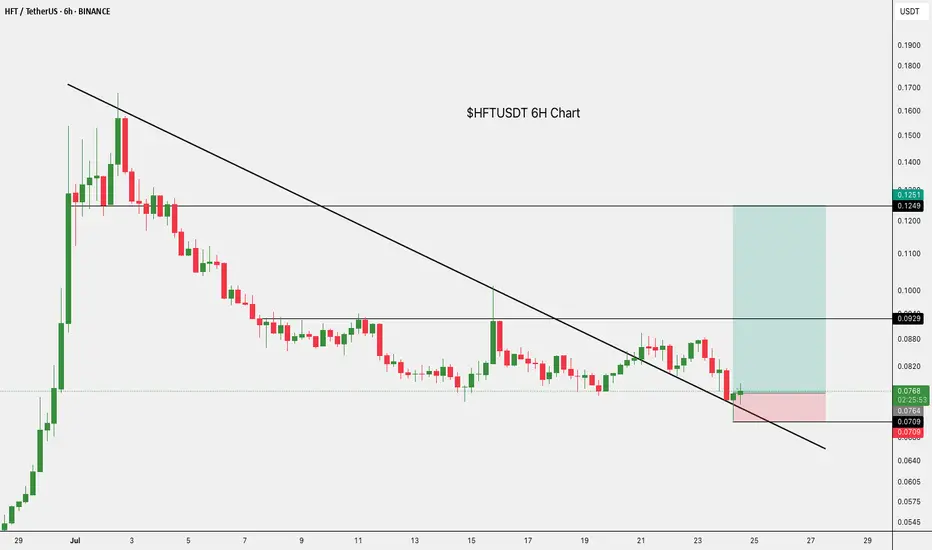
$HFTUSDT Trade Setup 6H.TSX:HFT Trade Setup (6H)
• Entry: CMP
• Stop Loss: $0.0709
• Targets:
T1: $0.0929
T2: $0.1251
Bullish breakout with clean retest.
The setup looks strong if support holds.
DYOR, NFA
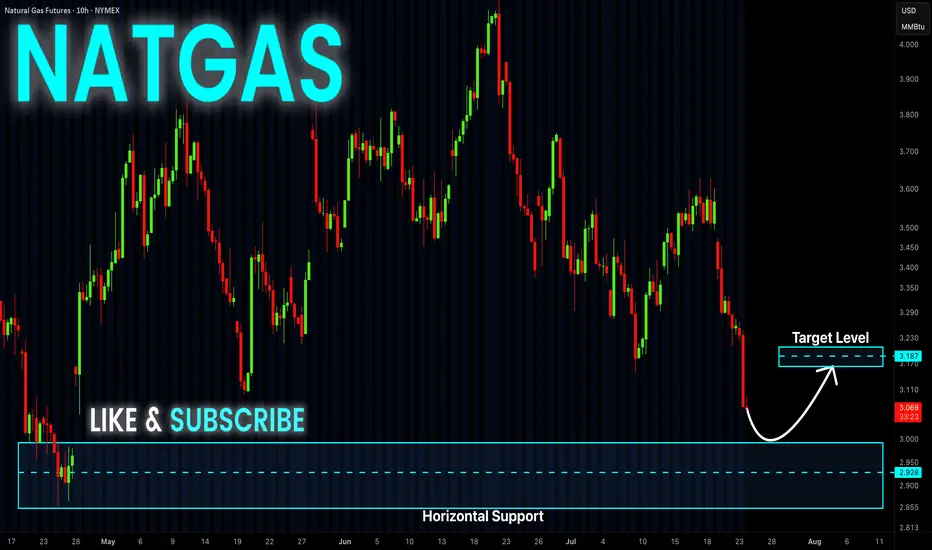
NATGAS Support Ahead! Buy!
Hello,Traders!
NATGAS keeps falling but
A strong horizontal support
Level is ahead at 3.00$ so
After Gas retests the support
We will be expecting a local
Bullish rebound
Buy!
Comment and subscribe to help us grow!
Check out other forecasts below too!
Disclosure: I am part of Trade Nation's Influencer program and receive a monthly fee for using their TradingView charts in my analysis.
Bitcoin Reinforced Bullish Trend, Range Focus & Key Volumes__________________________________________________________________________________
Technical Overview – Summary Points
➤ Strong bullish momentum across all main timeframes
➤ Key supports: 117600–116500 (short term), 115736/114000 (swing pivot)
➤ Major resistances: 119676, 120998, 123218 (potential short-term distribution risk)
➤ Volumes normal, no climax nor flush
➤ Risk On / Risk Off Indicator: "Strong Buy" bias (all TFs except 30min/15min neutral)
➤ ISPD DIV: No significant divergences
➤ Market consolidating in tight range below immediate resistance
__________________________________________________________________________________
Strategic Summary
➤ Dominant bias: strong bullish on all major TFs
➤ Opportunities: buy on pullback to 117600–116500 support, or on confirmed breakout 119676/120998, targets: 123218–130000
➤ Risk zones: clear break below 115736/114000 or extreme bearish volume
➤ Macro catalyst: No major impact expected short term. Watch Powell/Fed news, possible volatility without trend shift.
➤ Action plan: Prioritize long entries with stops (~2% below support pivot), partial profit taking above 123k, strict risk management in case of behavioral reversal or abnormal volume.
__________________________________________________________________________________
Multi-Timeframe Analysis
Daily/12H/6H/4H/2H/1H :
- All trend signals bullish (Risk On / Risk Off Indicator "Strong Buy", MTFTI "Strong Up")
- All major supports below price
- No structural weakness
- Consolidation range just below 119676–120998 resistance
30min/15min :
- Neutral setup, lack of directional momentum
- Normal volumes, no excessive activity
- Flat consolidation, market awaiting catalyst
Risk On / Risk Off Indicator : Fully confirms momentum. Shifts neutral short-term, no sell or reversal signal.
Key summary :
- Bullish trend dominant
- Major supports well below, immediate risk is low unless flash volume spike or sudden news
- Closely monitor the market under major resistance clusters
__________________________________________________________________________________
Cross-Analysis & Strategic Synthesis
Perfect convergence Daily to 1H: "Strong Up" momentum, bullish Risk On / Risk Off Indicator, healthy volumes
Active consolidation on 30min/15min: market awaits catalyst, no notable bearish strength
Structured pivot supports: 117600–116500, 115736/114000
Key resistances: 119676, 120998, 123218 (potential distribution/resistance zone)
Preferred entries: support pullback or confirmed breakout above 120k
Limited macro risk short term. Focus on Powell/Fed news and US calendar events (see table)
On-chain: Short-term holders profit-taking in progress, alert if deterioration accelerates
Plan: Partial profit taking above 123k extension, systematic stops below 115736 on invalidation
__________________________________________________________________________________
Professional Summary
BTC market shows a strong multi-timeframe bullish impulse, underpinned by robust sector and trend signals. Maintain risk discipline: key supports remain solid, but major resistance cluster requires increased vigilance for volume spikes or air pockets. Partial profit-taking recommended above 123–130k. R/R >2:1 for buys on pullback, strict stop loss in case of technical or behavioral invalidation.
__________________________________________________________________________________
A Sleeping Giant in the Energy Sector?While everyone’s chasing the next hot AI stock, a quiet opportunity might be taking shape in the energy sector; and it could be a big one.
🔋 As AI data centers explode in size and number, the demand on our power grid is rising fast. Nuclear is still years away, and renewables are struggling to scale in time. That leaves oil and gas as the most reliable players; and one U.S. company may be perfectly positioned to ride that wave.
📊 Technical Analysis
NASDAQ:PROP PROP has been in a steady downtrend, moving within a falling wedge pattern (marked in green). Right now, it’s retesting the bottom of that wedge, typically where things get oversold.
Even more interesting, PROP bounced off a major monthly demand zone last week, a signal that buyers may be stepping in.
In the short term, if the blue demand zone holds, we could see a push toward the $7 mark, which lines up with the top of the wedge.
But to really confirm a medium-term reversal, we’ll need a clean break above the $8.3 resistance. If that happens, the door could open to a rally toward $15, a key level from early 2024.
🛢️ Why PROP? A Hidden Play With Room to Run
Prairie Operating Co. (NASDAQ: PROP) isn’t your typical small-cap oil stock. They own 65,000 acres in Colorado’s DJ Basin and use modern drilling tech to stay lean and efficient. That means they can still make money even when oil prices dip.
As energy demand continues to climb, PROP could be sitting in the sweet spot , especially with the world so focused on tech stocks. But behind every AI boom is a growing energy need, and companies like PROP are the ones powering it.
One well-known Wall Street firm recently gave PROP a Buy rating with a $21.75 price target; that’s a potential 281% upside from where it stands today. And that’s not even counting the potential boost from energy-friendly policies under the current administration.
📌 One to Watch in 2025
PROP might just be one of the most under-the-radar energy plays going into the new year.
The biggest moves often start quietly; and this one has all the ingredients to surprise.
➡️ As always, speak with your financial advisor and do your own research before making any investment decisions.
📚 Always follow your trading plan => including entry, risk management, and trade execution.
Good luck!
All strategies are good, if managed properly.
~ Richard Nasr

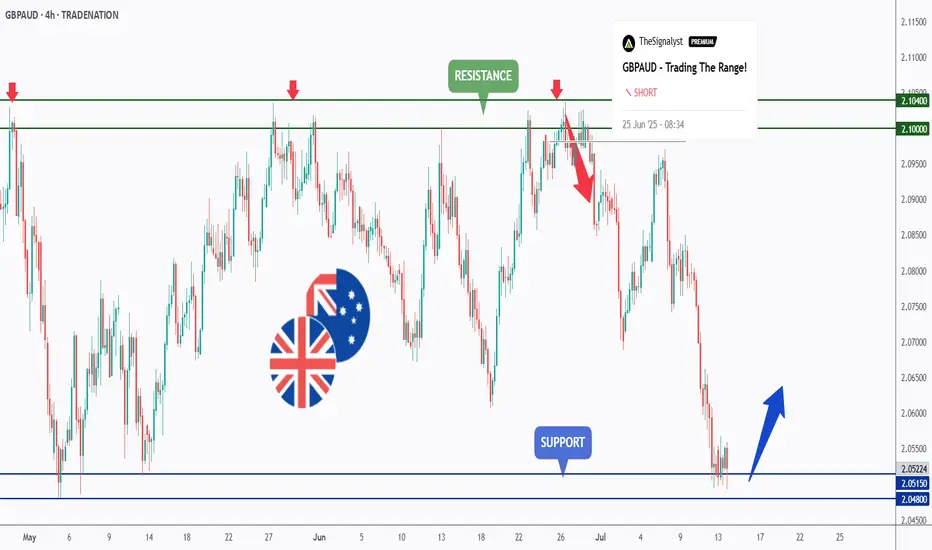
GBPAUD - Trading The Range - AGAIN!Hello TradingView Family / Fellow Traders. This is Richard, also known as theSignalyst.
📈GBPAUD has been hovering within a big range.
Last week, as per our previous analysis, GBPAUD rejected the upper bound of the range and traded lower.
This week, GA is retesting the lower bound of the range acting as a support.
As long as the support holds, we will be looking for longs on lower timeframes, targeting the upper bound of the range.
📚 Always follow your trading plan regarding entry, risk management, and trade management.
Good luck!
All Strategies Are Good; If Managed Properly!
~Rich
Disclosure: I am part of Trade Nation's Influencer program and receive a monthly fee for using their TradingView charts in my analysis.
SOLUSDT 1H Short-Term🔍 Technical Structure:
Short-Term Trend:
SOL is currently in an uptrend, with local higher lows. This is evident from the orange uptrend line, which has been tested multiple times.
Local Resistance:
205.14 USDT – yellow line – a resistance level that the price has touched several times but failed to break (this could be a double-top formation).
Local Support:
198.48 USDT – the price is currently testing this level as support.
194.36 USDT – lower, more crucial support (stronger upon a trend breakout).
187.74 USDT – important support that would be tested in the event of a larger breakout.
📉 Oscillator – Stoch RSI:
The Stoch RSI is currently in oversold territory (below 20), suggesting the possibility of a local rebound.
However, there has been no upward crossover yet, so there is no strong buy signal.
🔊 Volume:
We are observing a decrease in volume during the current correction, suggesting that the declines are relatively weak – there is no strong supply impulse.
🧠 Short-term scenarios:
✅ Bullish scenario:
Price is rebounding from the trend line (orange) and the 198.48 USDT level.
A break of the 205.14 USDT resistance could open the way to:
209.37 USDT
216.02 USDT (next target)
❌ Bearish scenario:
A break of the trend line and the 198.48 USDT level with the 1-hour candle closing below.
Possible decline to:
194.36 USDT (first support)
and further to 187.74 USDT if selling pressure increases.

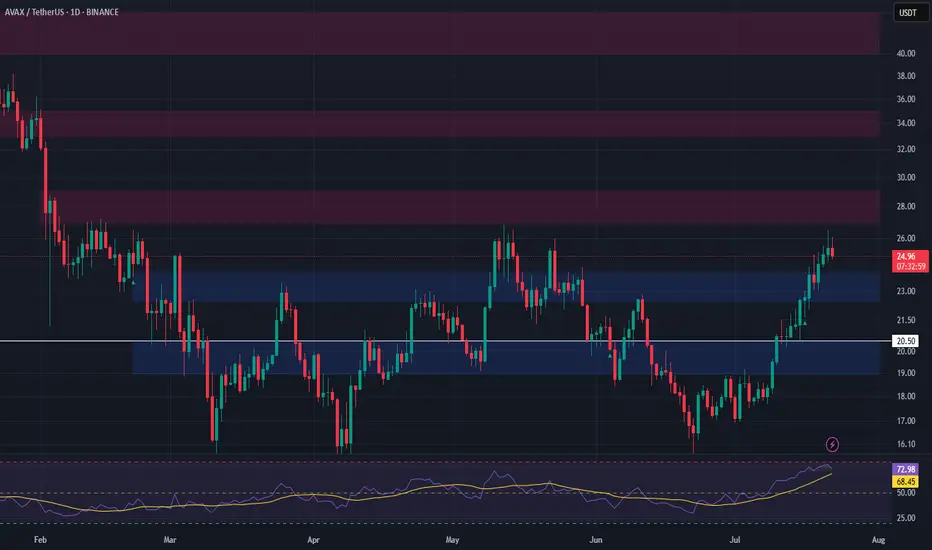
AVAX Long Swing Setup – Waiting for Support RetestAVAX has been rallying for two straight weeks, showing strong momentum. We’re watching for a healthy pullback into the $22.50–$24.00 support zone to position for continuation. If this zone holds, the risk/reward setup favors bulls with clear upside targets.
📌 Trade Setup:
• Entry Zone: $22.50 – $24.00
• Take Profit Targets:
o 🥇 $27 – $29
o 🥈 $33 – $35
o 🥉 $40 – $44
• Stop Loss: Daily close below $20.50
THETA Long Swing Setup – Accumulation Phase Near BreakoutTHETA is still consolidating in a range, but momentum is quietly building. A break above $1.07 followed by a higher low would confirm structural reversal. We’re eyeing the $0.95–$1.00 zone for a clean entry on retest, offering solid risk-reward if support holds.
📌 Trade Setup:
• Entry Zone: $0.95 – $1.00
• Take Profit Targets:
o 🥇 $1.60 – $1.70
o 🥈 $2.10 – $2.20
• Stop Loss: Daily close below $0.90

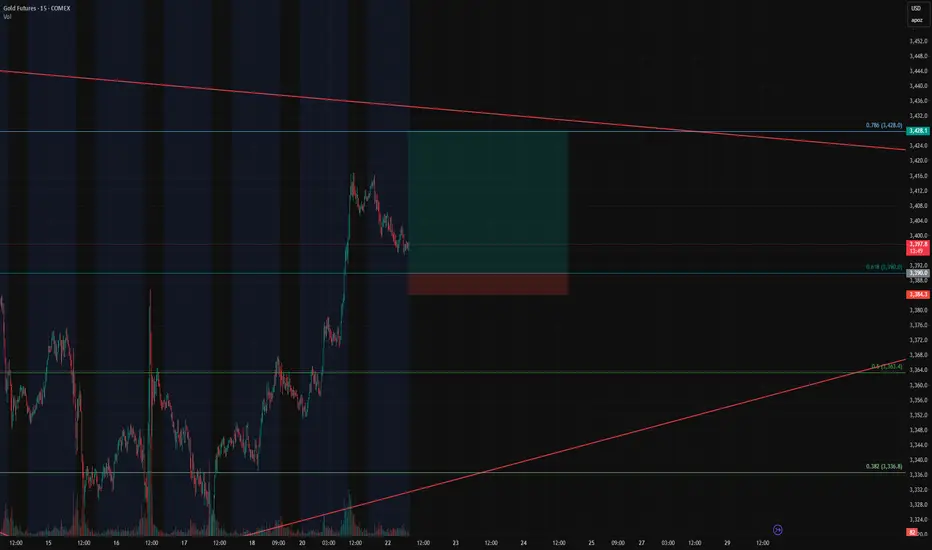
Gold Futures Long Setup – Breakout Continuation off the 0.618 FiGold Futures Long Setup – Breakout Continuation off the 0.618 Fib
Instrument: Gold Futures – COMEX ( COMEX:GC1! )
Timeframe: 15-Minute
Trade Type: Long – Breakout Continuation
Entry Zone: 3390 (0.618 Fibonacci retracement)
Take Profit: 3428 (0.786 Fib)
Stop Loss: 3384
Risk/Reward Ratio: 6.68
Setup: Bullish Flag on Retest
🔍 Trade Thesis
This trade is part of an ongoing breakout continuation strategy we've been trading, and now we're eyeing a pullback entry as price returns to a key retracement level.
Price nearly exploded through the 0.618 Fibonacci level (3390) during the prior breakout.
Now it's pulling back in a textbook bullish flag formation, suggesting healthy consolidation before the next leg.
The 0.618 retracement is aligning with previous intraday structure and trendline support — making this an ideal level to scale in.
This is a high R:R continuation play, with targets set at the 0.786 Fib level (3428) — right before macro resistance kicks in.
🎯 Entry & Exit Strategy
Entry: As price touches 3390 or forms bullish confirmation at the level.
Stop Loss: 3384 – tight and below key fib/flag structure.
Target: 3428 – based on 0.786 Fib extension and breakout continuation projection.
📊 Why This Works
Breakout behavior: Price respected the breakout impulse and retraced cleanly into a bull flag.
Fib confluence: 0.618 pullbacks are a classic entry in trending markets.
R/R of 6.68: Excellent reward profile vs. limited risk.
ETHUSD FORMED A BEARISH WEDGE. READY TO REVERSE?ETHUSD FORMED A BEARISH WEDGE. READY TO REVERSE?📉
ETHUSD has been moving bullish since July 9, forming the bearish wedge, supported by the bearish divergence. Today the price started to breakdown this pattern.
A bearish wedge is a bearish reversal pattern in an uptrend, where the price forms higher highs and higher lows within converging upward trendlines, signaling weakening bullish momentum and a potential downward reversal. To trade, identify the wedge with declining volume and confirm with RSI or divergence. Sell or short on a breakdown below the lower trendline with a volume spike. Set a stop-loss above the recent high or upper trendline. Target the wedge’s height projected downward from the breakdown or the next support level with a 1:2 risk-reward ratio.
The decline towards local support of 3,500.00 is highly expected. If the bearish impulse gets strong enough, we may see the decline towards 3,000.00 support level.

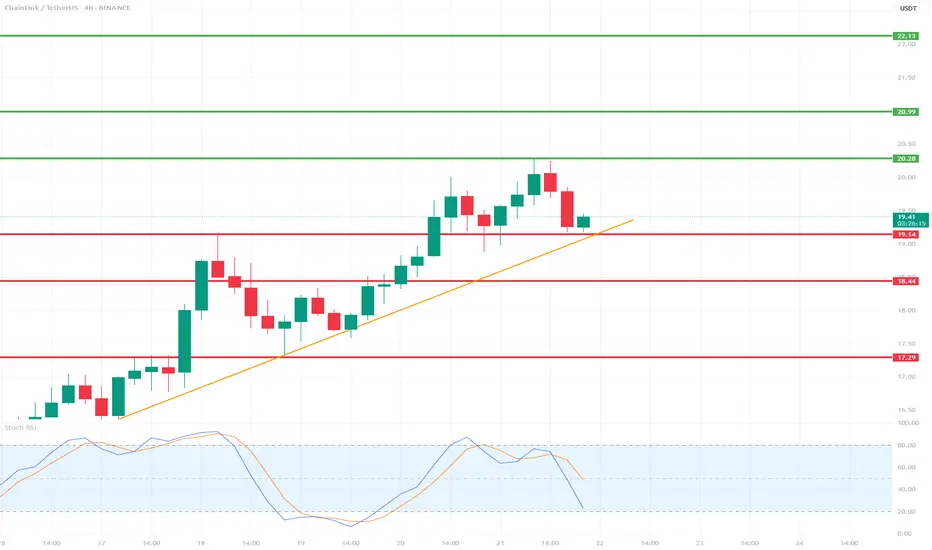
LINK/USDT 4H Chart📉 Indicators and Market Structure:
🔶 Trend:
Current trend: up, as long as it remains above the trend line and the 19.14 USDT level.
Local resistance: 20.28 USDT (recent high).
Next resistances: 20.99 USDT and 22.13 USDT (green lines).
Supports: 19.14 USDT, 18.44 USDT, 17.29 USDT (red lines).
🔷 Stochastic RSI (lower indicator):
Located in the oversold zone (below 20) and starting to reverse upward.
Potential signal of buying pressure if the %K and %D lines cross bullishly.
🧠 Scenarios:
✅ Bullish scenario (trend continuation):
Bounce from the trend line and the 19.14 level → breakout of 20.28 → test of 20.99–22.13.
Confirmation will be a clear bullish candle with high volume and a Stochastic RSI cross up.
❌ Bearish scenario (trend break):
Closing below the trend line and the 19.14 level → correction towards 18.44, and then even to 17.29.
An oversold RSI could support continued declines if a rebound does not occur.
📌 Summary:
Currently, the key level is the trend line and support at 19.14 USDT.
The market is waiting for a reaction – a rebound or a downward breakout.
Stochastic RSI suggests a possible rebound, but candlestick confirmation is needed.
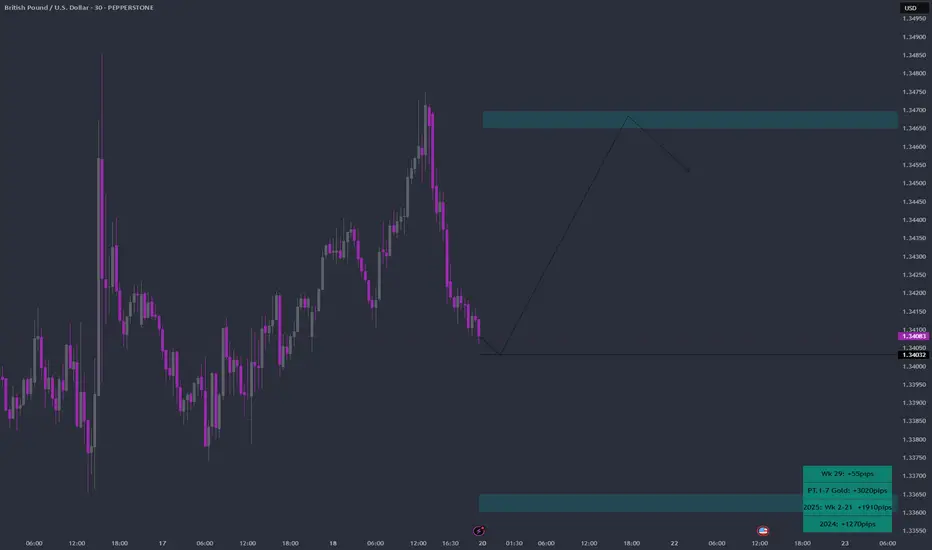
GBPUSD Week 30 Swing Zone/LevelsPEPPERSTONE:GBPUSD is expected to trend upward from the 1.34032 level towards the resistance zone. Whether it breaks through or reverses downward will ultimately depend on market players.
This projection is based on a forward-looking metric analysis, which explains why the zones are not derived from historical price action on the left side of the chart, as is common in traditional technical analysis. However, the daily candles from previous weeks still contribute meaningfully to this outlook.
Reliance Industries — Preparing for the Next Bullish Leg !!There are two charts of Reliance Industries — one on the weekly timeframe and the other on the daily timeframe.
On the weekly timeframe:
Reliance industries is trading near (LOP), with a key support zone in the range of 1385–1400.
On the daily timeframe:
Reliance industries is moving in well defined parallel channel with support zone near at 1400-1410.the stock is also taking support at pivot levels S1 and S2, positioned between 1393 and 1422 levels.
If this level is sustain then we may see higher prices in Reliance industries.
Thank You !!

BTC/USD Short-Term🔷 Pattern: Symmetrical Triangle (Consolidation)
The price is inside the triangle formation (orange lines) and is approaching its completion.
An impending breakout (up or down) is highly probable within the next few hours.
📉 Support Levels (red lines):
117.210 – local horizontal support.
116.324 – 115.050 – strong demand zone (potential target in the event of a downward breakout).
📈 Resistance Levels (green lines):
118.900 – 119.700 – local resistance zone.
121.011 – 121.813 – higher target in the event of an upward breakout from the triangle.
📊 Technical indicators:
✅ RSI (Relative Strength Index):
Currently: 69.05 – close to overbought levels, but not yet at an extreme.
Potential for a short-term pullback unless a strong breakout occurs.
✅ MACD:
Signal lines are tightly intertwined, histogram flat → no dominant momentum.
Waiting for a breakout signal (bullish or bearish crossover).
✅ SMA:
Price currently below the 50 and 200 SMA for 1 hour → slight downward momentum.
The 50-SMA (red) is turning down, which may signal a continuation of the sideways or downward trend.
📌 Short-term conclusions (1–6 hours):
Scenario 1: Bullish breakout:
Confirmation: H1 candle close above 118,900.
Targets: 119,700 and potentially 121,000–121,800.
Scenario 2: Bearish breakout:
Confirmation: H1 candle close below 117,200.
Targets: 116,300, then 115,000–115,300.
📍 Watch for:
Breakout of the triangle boundaries with volume.
RSI behavior relative to the 70 level.
MACD crossover and histogram.

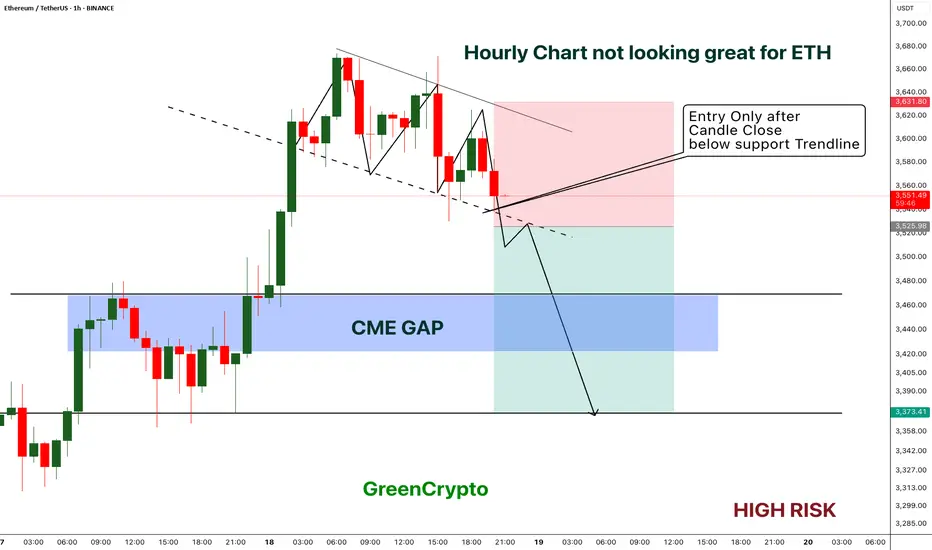
ETH - Short Trade with HIGH RISK- ETH got reject from resistance multiple times on 1H timeframe and now the price is playing near the support.
- I'm expecting overall market to cooldown this weekend, this could push the ETH to break the support
- ETH has CME gap around 3422 - 3467 range, im expecting this CME gap to be filled soon.
Entry Price: Below 3525
Stop Loss: 3631
TP1: 3471.15
TP2: 3381.76
Move SL to breakeven on TP1 hit.
Don't forget to keep stoploss.
Cheers
GreenCrypto
ETH/USDT 4H Chart✅ Market Trend and Structure:
Uptrend: The highlighted orange trend line shows continuous growth since mid-April. The price is trading above the 50- and 200-period moving averages (EMA and SMA), confirming bullish sentiment.
Current price: around 3556 USDT – very close to local highs.
Resistance break in the 3200–3300 USDT area, which now acts as support.
📈 Technical Levels:
Resistance (red horizontal lines):
3600–3650 USDT – local resistance resulting from market reaction.
3888 USDT – next historical resistance level.
4133 USDT – established long-term target (green dashed line at the top).
Support:
3300 USDT – strong support after a previous breakout.
3080 USDT – previous high, now the next support level.
3070 / 2900 USDT – key technical support levels in the event of a larger correction.
📊 Indicators:
MACD:
The MACD is in a strongly bullish zone, but:
The histogram is flattening.
A bearish crossover pattern is possible in the following candles – a signal of weakening momentum.
RSI:
RSI ~74 – is in the overbought zone, which often heralds a correction or at least consolidation.
A value above 70 confirms the bullish trend but may suggest that momentum is overheated.
📌 Conclusions and Scenarios:
🔼 Upside Scenario (trend continuation):
If the price remains above 3300–3350 USDT, it could move towards 3888, and then 4133 USDT.
A break above 3650 USDT on heavy volume will be a strong continuation signal.
🔽 Corrective scenario (short-term pullback):
The RSI and MACD suggest a possible correction.
Potential pullback to:
3300 USDT (retest of previous resistance as support).
SMA 200 (~2600 USDT) with a deeper downward move.

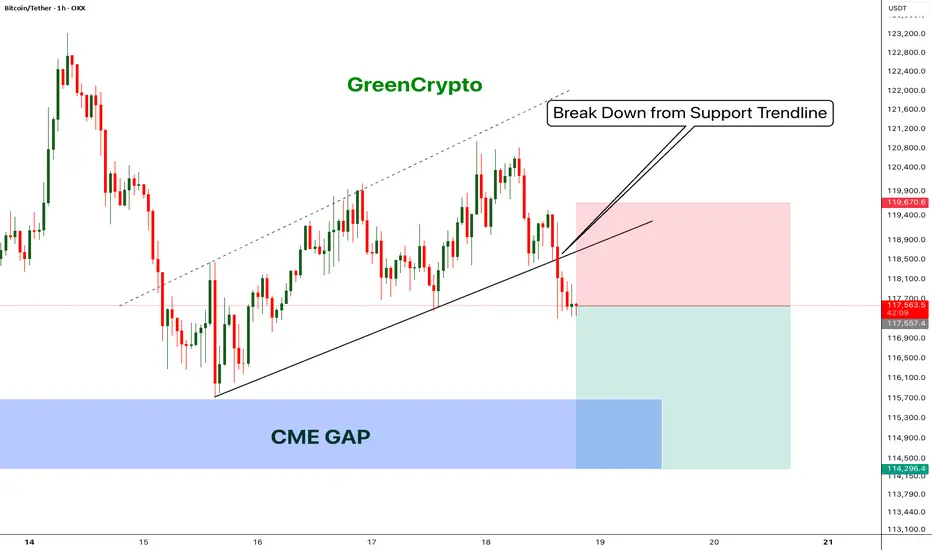
Bitcoin - Bears will push the price fill CME Gap- Bitcoin has broken down from the trending support,
- Price has been going down without any retracement on 1H candle.
- Looks like bitcoin will CME gap before going up further.
- A high risk Short Trade opportunity is here
Entry: 117,431
Stop Loss: 119,670
TP1: 116152.8
TP2: 114403.6
Move SL to Breakeven on TP1 hit
Don't forget to like and follow
Cheers
GreenCrypto
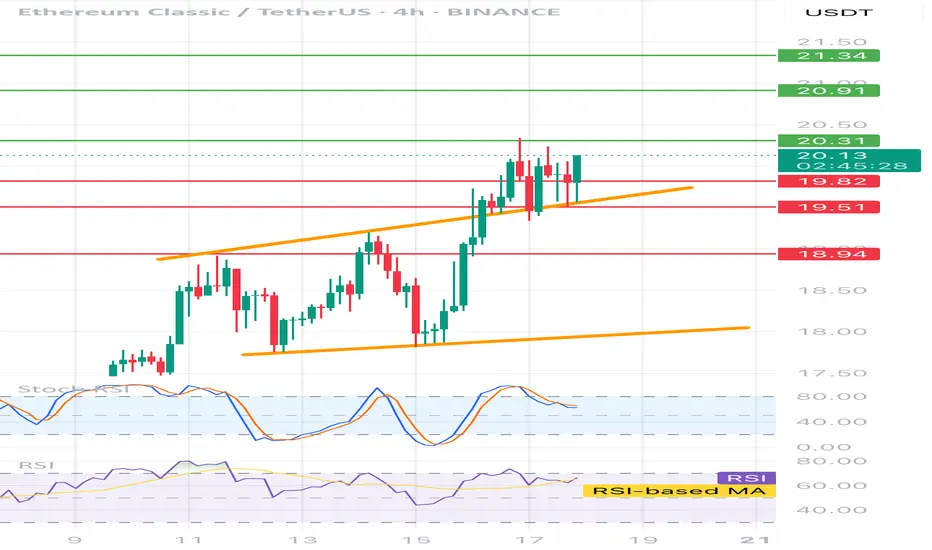
ETCUSDT 4H📊 Price:
Currently around 20.05 USDT
⸻
🔶 Technical formation:
• Ascending channel - clearly marked with two orange trend lines.
• The price is currently testing the upper edge of the channel - it is possible to break or correction.
⸻
📉 Support and resistance:
• ✅ Support:
• 19.73 (local, on the closure of the candles)
• 19.51 (technical, tested several times)
• 18.94 (stronger, historical)
• 🚫 resistance:
• 20.31 - the closest local resistance
• 20.91 - key level
• 21.34 - strong resistance from higher intervals
⸻
🔄 oscillators:
• STOCHASTIC RSI - in the inheritance phase (descent from buying), possible local decline / correction.
• RSI (14) - approx. 60, slightly positive trend, but without exaggeration - no purchase, place for further increases.
📌 Fast strategy:
• 🟢 Long: After breaking and Retescia 20.31 → TP 20.91 / 21.34
• 🔴 Short: after rejection 20.31 or the upper line of the channel → TP 19.73 / 19.51
• 📉 SL: In both cases, it is best 0.3–0.4% above the last high/low
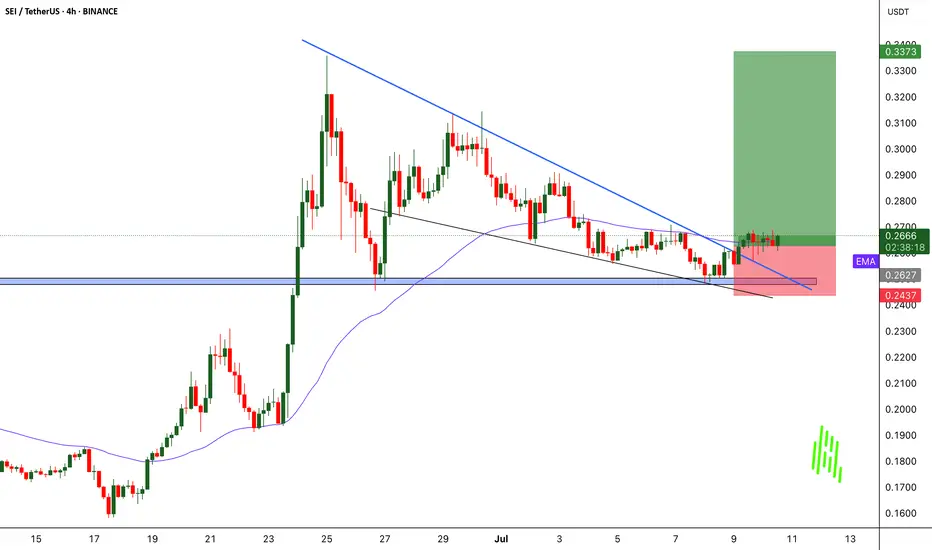
SEIUSDT Rebounds from Key Support - Pump Loading?BINANCE:SEIUSDT Rebounds from Key Support - Pump Loading?
BINANCE:SEIUSDT just touched a major support level on the 4H chart and is now showing signs of a bullish reversal after breaking above the descending trendline. This setup looks similar to previous price actions where NYSE:SEI delivered sudden explosive moves post-breakout. If history repeats, we could be looking at another strong rally ahead.
Entry looks promising, but as always, manage your risk wisely and set a proper stop loss to protect your capital.
BINANCE:SEIUSDT Currently trading at 0.265
Buy level : Above $0.263
Stop loss : Below $0.243
Target : $0.337
Max leverage 5x
Always keep stop loss
Follow Our Tradingview Account for More Technical Analysis Updates, | Like, Share and Comment Your thoughts
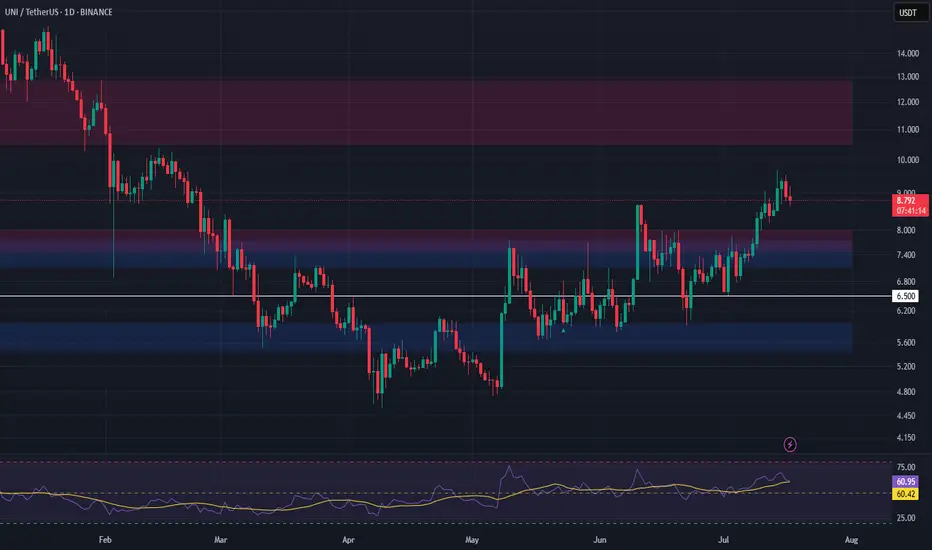
UNI Long Setup – Breakout Retest into High-Confluence SupportUniswap (UNI) has broken out of resistance and is now pulling back into a high-confluence zone, forming a strong bullish structure. The $7.13–$7.73 area presents a favorable entry on the retest.
📌 Trade Setup:
• Entry Zone Around: $7.13 – $7.73
• Take Profit Targets:
o 🥇 $10.50 – $12.85
• Stop Loss: Daily close below $6.50
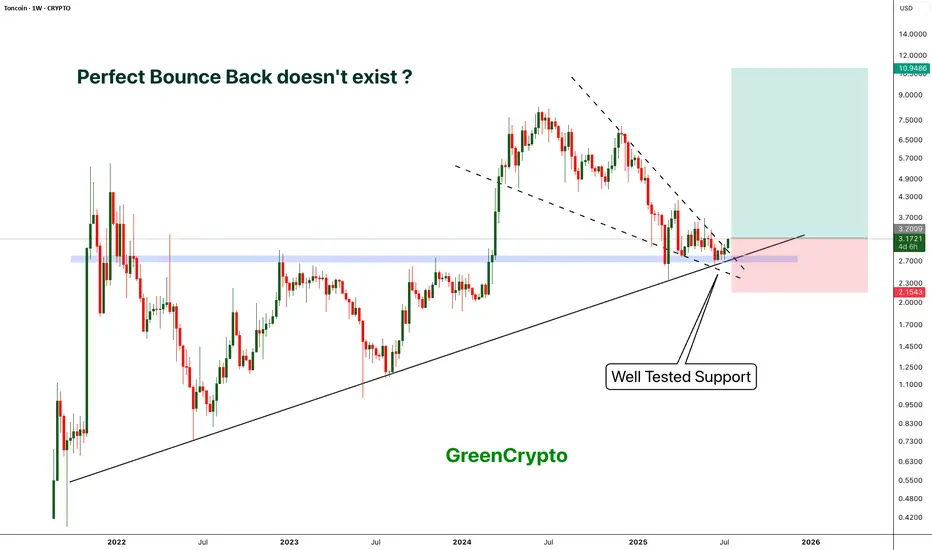
TON - Locked and Loaded for a perfect Reversal- TON is reversing perfectly from its long tested support
- On weekly chart we have clear bounce back and perfect candle.
- This is an excellent opportunity to enter
Entry Price: 3.17
Stop Loss: 2.15
TP1: 4.0796
TP2: 5.2629
TP3: 6.8383
TP4: 8.3298
TP5: 11.0191
Stay tuned for more updates.
Cheers
GreenCrypto