Bitcoin - The ultimate breakdown for 2025/2026Welcome to my channel and this analysis. In this analysis I will dive deep in the current Bitcoin’s bullmarket. I will examine charts from the monthly, weekly, daily and 4H charts, and also on chain data. This will be a complete insight in Bitcoin’s price.
------------------------
Monthly timeframe
Logarithmic BTC chart
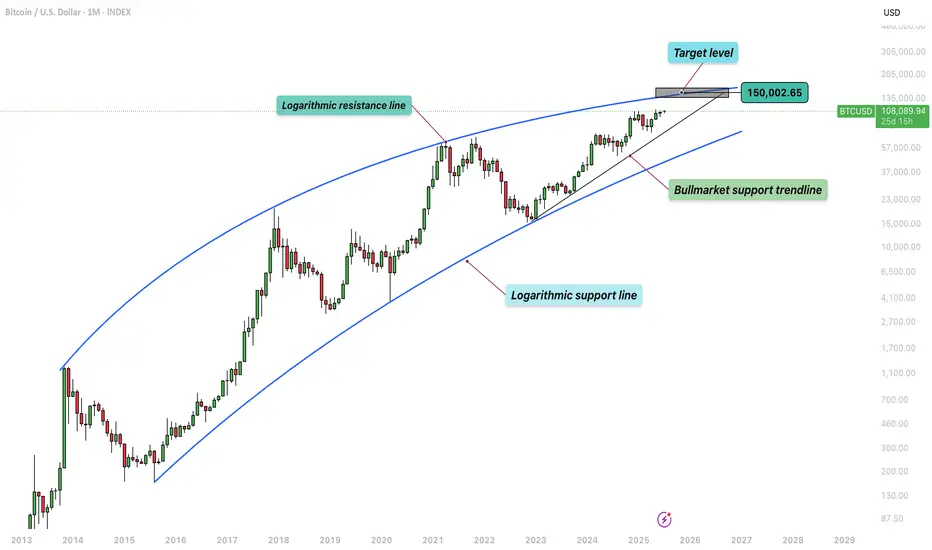
This chart presents a long-term logarithmic analysis of Bitcoin using monthly candles, covering the period from around 2013 to mid-2025. The structure is defined by two major curved lines representing a logarithmic resistance and support channel, which frames Bitcoin's price movement over more than a decade. These lines form a dynamic, upward-sloping price corridor, capturing Bitcoin's historically exponential price behavior and cyclical nature. The vertical axis uses a logarithmic scale to better reflect percentage-based changes, which is critical when analyzing an asset like Bitcoin that has grown from under $100 to over $100,000 in just a few years.
The chart displays clear multi-year cycles. The first notable cycle begins in 2013, followed by a significant correction in 2014–2015. A new bullish phase emerges between 2016 and 2018, peaking near $20,000. This is followed by a crash into 2018. A longer accumulation period precedes the 2020–2021 rally, which reaches a high around $69,000 before another sharp decline. From the bottom in late 2022 or early 2023, Bitcoin begins another uptrend, forming a steep rise along a newly established bullmarket support trendline. This trendline represents a more aggressive, linear support structure within the broader logarithmic curve, showing the strong momentum driving the current bull phase.
By July 2025, Bitcoin is trading around $108,000, advancing steadily toward the upper boundary of the long-term logarithmic resistance. A key element of this chart is the target level marked at approximately $150,000, which aligns closely with the point where the current trajectory intersects the upper logarithmic resistance. This zone has been highlighted as a likely area of interest, possibly signaling a market top or at least significant resistance, based on Bitcoin's past behavior. Historically, Bitcoin has tended to reverse sharply or consolidate after reaching this upper boundary, making the target zone an area of potential distribution or heightened volatility.
The bullmarket support trendline serves as a short- to medium-term structure within the larger logarithmic channel. As long as price holds above this line, the current bullish structure remains intact. A breakdown below this trendline could indicate a loss of momentum and trigger a broader correction.
The use of logarithmic trendlines underscores Bitcoin’s tendency to move in exponential growth cycles, shaped by macroeconomic trends, halving events, and adoption waves. The resistance and support boundaries function as dynamic guides for long-term expectations rather than rigid barriers.
The stoch RSI crosses
This chart provides a technical overview of Bitcoin on a monthly timeframe using candlestick analysis and the Stochastic RSI (Stoch RSI) oscillator to distinguish between bull and bear market phases. The Stochastic RSI, shown at the bottom of the chart, is a momentum oscillator derived from the RSI rather than price directly, making it particularly useful for identifying overbought and oversold conditions in trending markets. The key thresholds are the 80 level at the top and the 20 level at the bottom, which respectively indicate overbought and oversold zones.
The chart spans from 2017 to mid-2025, clearly separating bull and bear markets using vertical red lines and labeled annotations. Each major cycle aligns with movements in the Stoch RSI indicator. Notably, crosses above the 80 line (into overbought territory) are often associated with late-stage bull market tops or strong bullish continuations. Crosses below the 20 line (into oversold territory) typically align with bear market bottoms or the start of new accumulation phases.
Starting with the December 2017 peak, the Stoch RSI crossed above the 80 level, reaching extreme overbought territory. This cross occurred at the height of that bull cycle, signaling a likely exhaustion of momentum. Not long after this peak, the market entered a bear phase, confirmed by the downward cross of the Stoch RSI below the 80 level, and eventually below 20, leading into the 2018–2019 bear market.
By August 2019, the Stoch RSI crossed below the 20 level, signaling oversold conditions. Although this did not immediately launch a new bull market, it did suggest the market was bottoming out. This was followed by a gradual recovery and another decisive upward cross above 80 around April 2021, right in the midst of the strong 2020–2021 bull run. That cross confirmed the continuation of upward momentum and coincided with Bitcoin reaching new all-time highs.
As the price peaked in late 2021 and early 2022, the Stoch RSI again turned downward and dropped below the 20 threshold, marking another prolonged bear market. This downtrend was confirmed as the oscillator remained suppressed in the oversold zone for most of 2022.
The Stoch RSI is now moving again towards the overbought territory. This means that bulls have the control in the market and likely to push higher.
RSI with the consolidation and resistance trendline
This chart presents a broader monthly view of Bitcoin's price action alongside the Relative Strength Index (RSI), revealing a compelling structural alignment between price momentum and long-term resistance dynamics.
At the top of the chart, the candlestick pattern shows a clear upward trend spanning across multiple market cycles. A long-term resistance trendline has been drawn that connects the major highs from the two previous bull markets, specifically the peaks in late 2017 and late 2021. This resistance line acts as an upper boundary to the macro trend and, so far, the current price action in 2025 has not yet tested this long-term resistance. In fact, while Bitcoin has recently reached above $100,000, it remains below the ascending resistance trendline, suggesting that there could still be room for price to move higher before encountering the next major overhead challenge. The structure implies a potential upward continuation if momentum sustains, and the price may attempt to test this historical trendline in the near future.
Below the price chart, the RSI indicator offers additional insight into the underlying strength of this move. A descending RSI trendline connects the previous overbought peaks from 2017 and 2021, forming a macro resistance trendline in momentum that mirrors the structure seen in price. This declining RSI resistance has not yet been reached in the current cycle, implying that momentum still has space to grow before hitting a potential exhaustion point. The RSI is currently capped within a relatively tight consolidation box, with values fluctuating between the mid-60s and low-70s.
200W SMA crosses above the previous ATH
This chart illustrates the long-term price action of Bitcoin, focusing on the relationship between the 200-week simple moving average (SMA) and previous all-time highs (ATHs). Historically, when the 200-week SMA crosses above the previous cycle’s ATH, it has coincided with periods near the cycle tops. For example, in December 2017 and January 2022, the 200-week SMA moved above the prior ATH, which closely aligned with significant market peaks.
In the current cycle, however, the 200-week SMA has not yet crossed above the previous ATH from 2021, which is around $68,889.04. This is notable because, in past cycles, this crossover has typically marked the later stages of a bull run. The fact that this crossover has not yet occurred suggests that Bitcoin may still have room to move higher before reaching a new cycle top. However, it is important to recognize that this does not guarantee further upward movement. Even if Bitcoin’s price consolidates or moves sideways for an extended period, the 200-week SMA will gradually rise due to its lagging nature and could eventually cross above the previous ATH without a significant price rally.
Lets now move to the weekly charts and analyse where we are.
------------------------
Weekly timeframe
Support and resistance trendlines
This chart shows Bitcoin’s price action on a weekly timeframe, highlighting three key trendlines. Two resistance trendlines are drawn from the peaks of the last two major cycles, forming an upper boundary for price action. These lines act as potential resistance zones, indicating areas where previous rallies have topped out and where the current price could face selling pressure if it approaches these levels again.
Additionally, there is a clearly defined rising trendline that serves as bull market support. This trendline has been respected throughout the current cycle, connecting the higher lows since the market bottomed out in late 2022. As long as Bitcoin’s price continues to hold above this bull market support trendline, the overall bullish structure remains intact. This suggests that the uptrend is still healthy and that corrections or pullbacks, as long as they stay above this line, are part of a normal, sustainable bull market. If the price were to break below this support, it could signal a shift in market sentiment and potentially a deeper correction. For now, maintaining support on this trendline is a positive sign for the ongoing bull market.
Bearish divergence
The chart shows that Bitcoin has formed three consecutive price peaks, with each new high surpassing the previous one. This indicates that, from a price perspective, the market has maintained its upward momentum over this period. However, when looking at the Relative Strength Index (RSI) below the price chart, a different pattern emerges. Each time the price has made a new high, the RSI has registered a lower high, resulting in a clear bearish divergence. This is visually reinforced by the downsloping trendline that can be drawn across the RSI highs, in contrast to the uptrend in price.
Bearish divergence between price and RSI, as seen here, often signals underlying weakness in the buying momentum, even as price continues to rise. It suggests that each successive rally is being driven by less enthusiasm or participation from buyers. Given this setup, it is possible that the RSI could revisit the downsloping trendline in the near future. If this occurs, the price might make a marginally higher high, potentially forming a third peak slightly above the current level. This would maintain the divergence and could act as a warning sign for traders to be cautious about the sustainability of the current uptrend.
Stoch RSI
This chart presents the weekly price action of Bitcoin alongside the Stochastic RSI indicator. What stands out is the clear cyclical pattern in the Stoch RSI, where it tends to reach oversold levels roughly once every half year. These oversold readings have historically aligned with significant local bottoms in the price, signaling favorable buying opportunities for traders and investors. After reaching these low points, the Stoch RSI typically trends upward, eventually entering the overbought zone.
When the Stoch RSI enters overbought territory, as it does several times on this chart, it often coincides with local price peaks. These moments serve as warnings that the market may be overheated in the short term, and traders should be cautious about opening new long positions. The overbought readings suggest that a pullback or period of consolidation could be imminent, as the market works off excess bullish momentum.
Currently, the Stoch RSI is once again in the overbought zone. This suggests that Bitcoin may be vulnerable to a further pullback or at least a pause in its upward movement. While this does not guarantee an immediate reversal, it does mean that risk is elevated.
Failed breakout/liquidity grab
This weekly Bitcoin chart illustrates a strong and consistent uptrend that has been developing since late 2023. Each major move begins with a clear breakout above previous consolidation zones, followed by a retest of the broken resistance, which then acts as support, confirming the trend's strength. These retests tend to hold well, setting up for new bullish impulses.
In the earlier stages, we see BTC breaking out of a range around the $48,851 support level. After a successful retest of that zone, the price surged and entered a new consolidation phase just below $73,643. A second breakout occurred from this level, again followed by a retest that confirmed it as a new support level. This pattern reflects textbook bullish market structure: breakout, retest, and continuation.
However, the current price action shows something different. BTC has returned to its previous high around the $109,301 resistance level. Unlike the previous times, where strong bullish candles closed above resistance, this attempt has only pierced above the level with a wick, indicating potential exhaustion or hesitation. The highlighted label "Failed breakouts / Liquidity grab" suggests that these wick movements may have been attempts to trigger stop orders and gather liquidity before a possible retracement.
Now we will dive deep into the daily timeframe.
------------------------
Daily timeframe
Resistance, bullflag and Stoch RSI
This daily chart of Bitcoin reveals a period of consolidation just below a key resistance zone, which aligns with the previous all-time high area. BTC has been ranging within this red-marked resistance block, showing clear hesitation from buyers to push beyond it with conviction.
During this consolidation, a well-formed bull flag structure appeared, a bullish continuation pattern, signaling potential for further upside. The breakout from this bull flag occurred earlier this week, providing initial bullish confirmation as price pushed briefly above the upper boundary of the flag. However, the breakout lacked follow-through. Instead of sustaining momentum and closing decisively above resistance, BTC appears to have experienced a fake-out, with price now retracing back inside the prior range.
This failed breakout is particularly notable given the context of the Stochastic RSI indicator, which is currently in the overbought zone.
------------------------
4H timeframe
4H FVG and liquidity grab
This 4-hour chart of Bitcoin shows a clear structure where price has recently formed an equal high around the $110,612 level. Equal highs are often seen as zones where liquidity builds up, since many stop-loss orders from short positions typically rest just above them. This makes the area particularly attractive for a potential liquidity grab.
At the moment, BTC appears to be in a short-term retracement phase after rejecting from this equal high region. During this move, price left behind a bullish Fair Value Gap (FVG), which is a zone of inefficiency where price moved too quickly to fill orders. This FVG is now acting as a potential support zone. The chart suggests that BTC may revisit this FVG to rebalance before making another attempt to break through the equal highs.
If BTC can hold the FVG and generate upward momentum, a move above the equal highs becomes more likely. In that case, the resting liquidity just above those highs could be targeted, leading to a quick wick or breakout move before price potentially reverses again.
------------------------
Liquidation heatmap
1 month
This Binance BTC/USDT liquidation heatmap clearly shows that the majority of the liquidity is stacked to the upside. The bright yellow and green bands, which represent areas of high liquidation potential and leverage exposure, are heavily concentrated just above the current price levels, especially around the $111,000 to $114,000 zone. This indicates that many traders have short positions with stop-losses placed above these highs, making them prime targets for potential liquidation events.
As price moves closer to these high-liquidity zones, the probability increases that market participants, particularly larger players or algorithms, may push BTC upwards to trigger those stops and liquidate those positions.
1 week
The current price is hovering around the $108,000 range, with clear liquidity clusters forming both below and above this level. What stands out is the dense liquidation zone just below the current price, this suggests that many traders have placed long positions with stop-losses slightly under this support range. These positions create an opportunity for a liquidity sweep, where price briefly dips down to trigger liquidations, fill larger buy orders, and shake out weaker hands.
After such a sweep, the heatmap shows an even larger cluster of liquidation liquidity sitting just above the highs, especially around the $110,000 to $114,000 region. This is likely composed of stop-losses from short positions and breakout traders who entered too early. The concentration of liquidity here creates a strong incentive for price to target this zone after clearing the downside liquidity.
------------------------
Fear and greed index
Today
The Fear and greed today is at 66, meaning greed. This level suggests that market sentiment is optimistic, but not yet euphoric or irrational. In practice, it often means buyers are confident, and there’s still room for price continuation before we enter extreme greed territory
1 year chart
This chart displays the Crypto Fear & Greed Index over time, offering a visual representation of sentiment cycles in the Bitcoin market.
When examining the past year, you can see how sentiment has recovered significantly from the fear zone (below 30), especially from late 2024 into early 2025. This shift in sentiment aligned with BTC's price climbing back toward previous highs, indicating that sentiment is responding directly to price structure and bullish momentum.
------------------------
BTC exchange reserve
This chart, sourced from CryptoQuant, provides a clear visualization of the relationship between Bitcoin’s exchange reserves (blue line) and BTC price (white line), over a multi-year period. The key insight is the rapid and consistent decline in Bitcoin held on exchanges, especially noticeable from mid-2023 onward.
From around 2022, the amount of BTC on exchanges remained relatively stable. However, beginning in late 2022 and accelerating through 2023 into 2025, we see a shart and uninterrupted drop in exchange reserves.
This ongoing withdrawal trend typically signals accumulation behavior by investors. When BTC is withdrawn from exchanges and moved into cold storage or long-term wallets, it often reflects growing conviction among holders that price will rise and they don’t intend to sell in the short term.
------------------------
Final thoughts
This is a complete Bitcoin analysis for the community with a top-down analysis!
I have worked out a complete insight in the Bitcoin price with different analysis and on-chain data.
I would be excited if you boost, comment and share the analysis with your friends for the work that I have put in this analysis for everyone.
Support
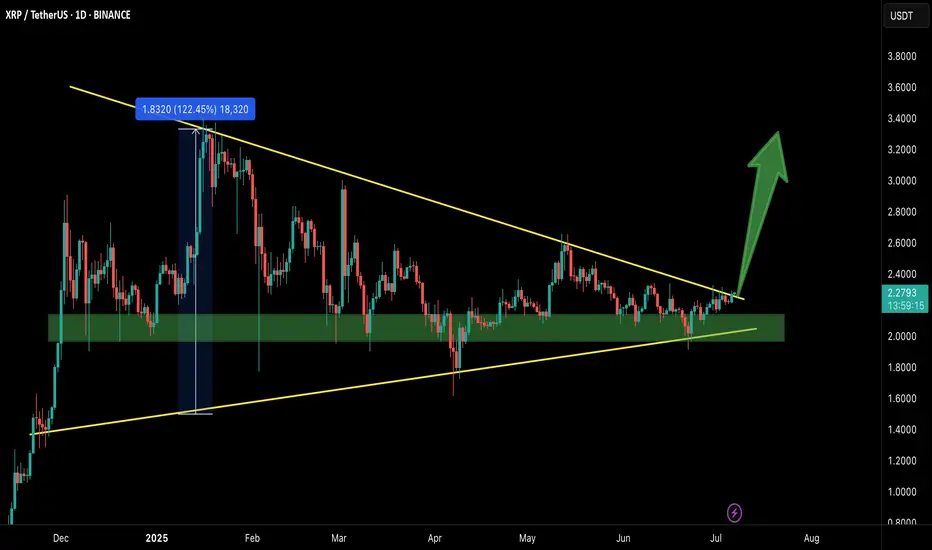
XRP/USDT – Breakout Confirmed!Hey Traders — if you're into high-conviction setups with real momentum, this one’s for you.
XRP has finally broken out from the massive symmetrical triangle on the 1D timeframe after holding the green support zone like a champ.
This structure has been compressing for months, and with this breakout, momentum could be shifting in favor of the bulls.
Entry: Current Market Price (CMP)
Add More: On dips above $2.20
Targets: $2.60 / $2.95 / $3.40 / $3.80
Stop Loss: $2.05
Leverage: 5x–10x
As long as price stays above the breakout zone, this setup holds strong potential. Keep a close eye for volume confirmation and follow-through.
Let’s see how this plays out. Will update as it unfolds.
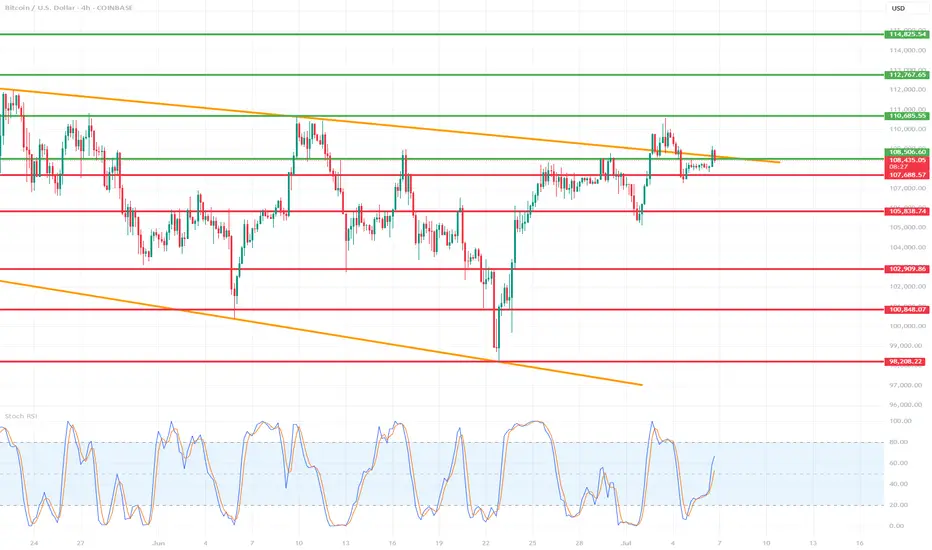
Is BTC getting ready for a new ATH?🔍 1. Key Support and Resistance Levels (Horizontal Lines):
🟢 Resistances (Green Lines):
114,295.54 — strong resistance resulting from previous highs.
112,767.65
111,009.00
110,685.35 — current key level that price may try to retest after a potential breakout.
🔴 Supports (Red Lines):
108,496.55 — current level being tested, also coinciding with local resistance from the past.
107,687.57
105,888.74
102,909.85
100,848.07
98,208.22 — strong long-term support; in the past, this level was reacted with a strong bounce.
🔶 2. Downtrend channel marked with orange lines:
The upper downtrend line acted as resistance.
The lower uptrend line acted as support.
The price recently broke above the upper line, but is now testing it again - this could be a retrospective retest.
➡️ If the close of the H4 candle is above this line - a possible confirmation of the breakout.
📊 3. Stochastic RSI indicator (at the bottom of the chart):
Currently in the uptrend phase after a bounce from the oversold level (<20).
The %K line (blue) is crossed upwards by the %D line (orange) - a bullish signal.
Still below the overbought zone, which suggests that the potential uptrend still has room to develop.
🧠 4. Market structure and price action:
Price broke above the 108.496 level, but is currently struggling to stay above this zone.
A retest of the broken triangle could be a healthy move, provided that support is maintained in the 108k–107.6k area.
A break below and a close below 107.6k could mean a false breakout and a possible decline towards 105.8k or even 102.9k.
🧭 5. Possible scenarios:
✅ Bullish scenario:
Maintaining the 108.496 level and closing the candle above the upper orange line → continued growth.
The nearest targets are:
110.685 (first resistance),
111.009 and 112.767 next.
❌ Bearish scenario:
The price will not stay above 108k and will fall below 107.687.
Possible return to the previous consolidation range with the target:
105.888,
and then 102.909 or 100.848.
🧮 Summary:
Currently, the decisive moment is underway: a test of support after breaking out of the convergent triangle.
The Stoch RSI indicator gives a bullish signal, but the price must confirm the movement by behaving above 108k.
Retest and bounce - this is a bullish scenario.
A breakdown and return under the trend line - means that the breakout was false.
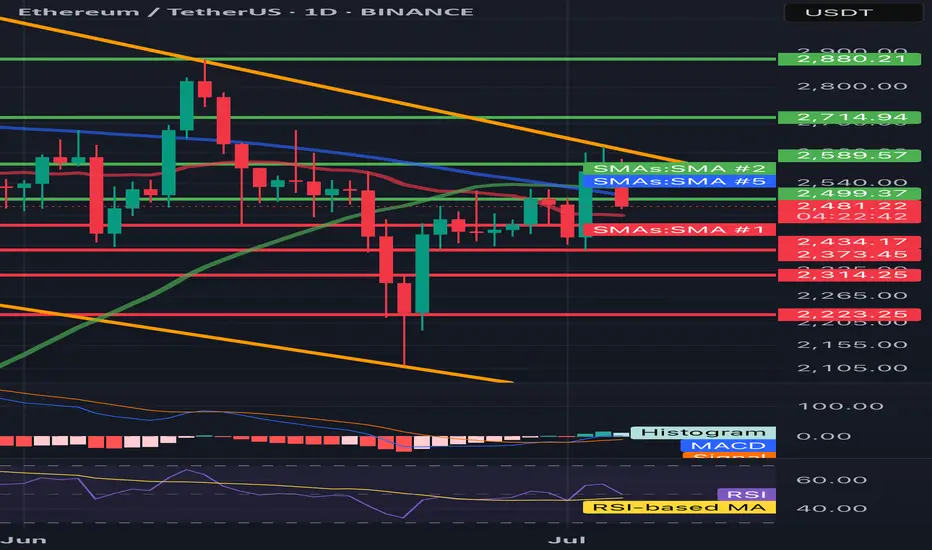
ETH/USDT 1D🔍 ETH/USDT - technical analysis (1D interval):
📉 Price: 2478 USDT (-4.36%)
🔧 Resistance:
• SMA 200 (green): ~ 2589
• Resistance zone: ~ 2715 → 2880 USDT
• SMA 100 (blue): ~ 2500 (just rejected)
🔧 Support:
• SMA 50 (red): ~ 2434 - currently tested
• Strong support: 2373, 2314, 2223 USDT
📊 indicators:
• MacD: freshly intersected, but the momentum is weakening
• RSI: ~ 45 - neutral/weak, under 50 (no bull strength)
• Trend: Still in the downward channel (yellow trend lines)
⸻
⚠️ Conclusions:
• Price rejected from 2500 (SMA 100) and flies down.
• If 2434 falls, a further discount is possible to 2373–2314.
• Lack of bulls with key resistance - the inheritance scenario dominates.
• Watch behavior at 2434 - this is now a key level.
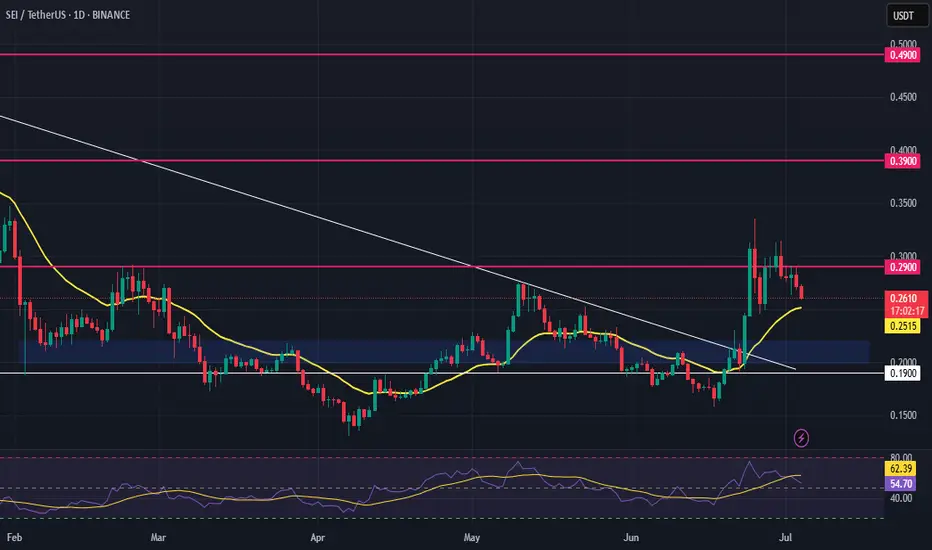
SEI Long – Breakout with Relative Strength & Trend ContinuationSEI is showing strong relative strength and has just broken out of recent structure. We’re watching for a higher low to form above the $0.22 zone, confirming trend continuation and unlocking upside liquidity.
📌 Trade Setup:
• Entry Zone: Around $0.22
• Take Profit Targets:
o 🥇 $0.29
o 🥈 $0.39
o 🥉 $0.49
• Stop Loss: Daily close below $0.19
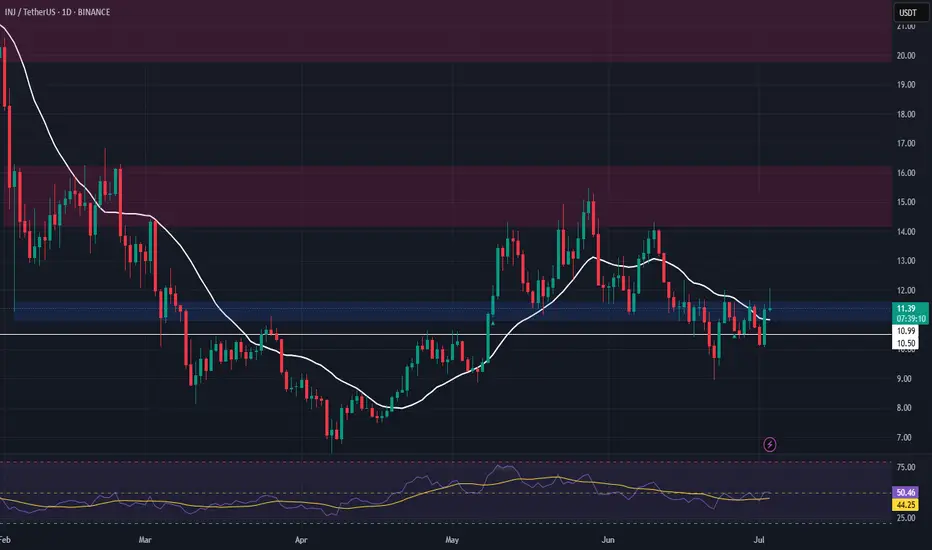
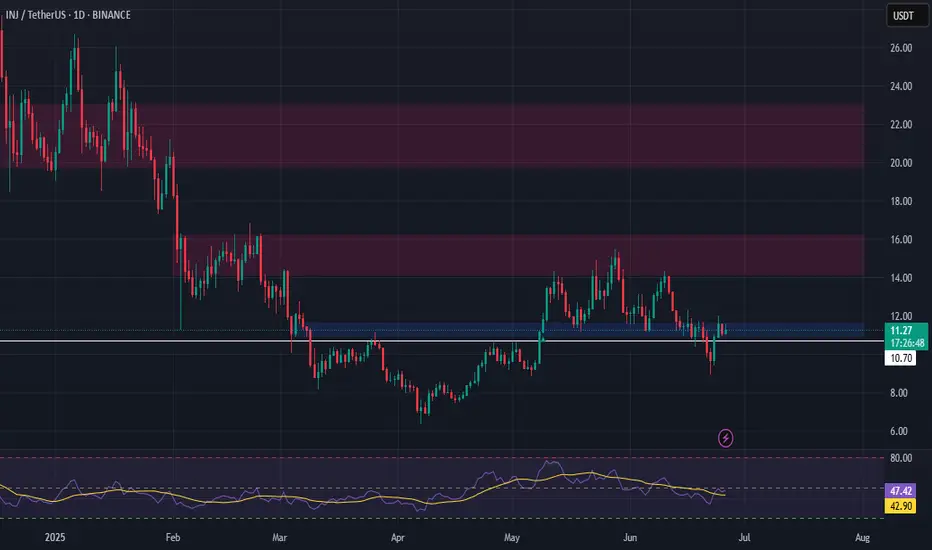
INJ Long Swing Setup – Structural Recovery with SMA ReclaimINJ has retraced to a key support zone and is showing early signs of recovery, reclaiming its 20-day SMA. With structural strength returning, the $11.00–$11.60 range offers a solid swing entry—contingent on BTC holding key levels.
📌 Trade Setup:
• Entry Zone: $11.00 – $11.60
• Take Profit Targets:
o 🥇 $14.00 – $16.00
o 🥈 $19.80 – $23.00
• Stop Loss: Daily close below $9.50 (Exit early if BTC breaks major support)
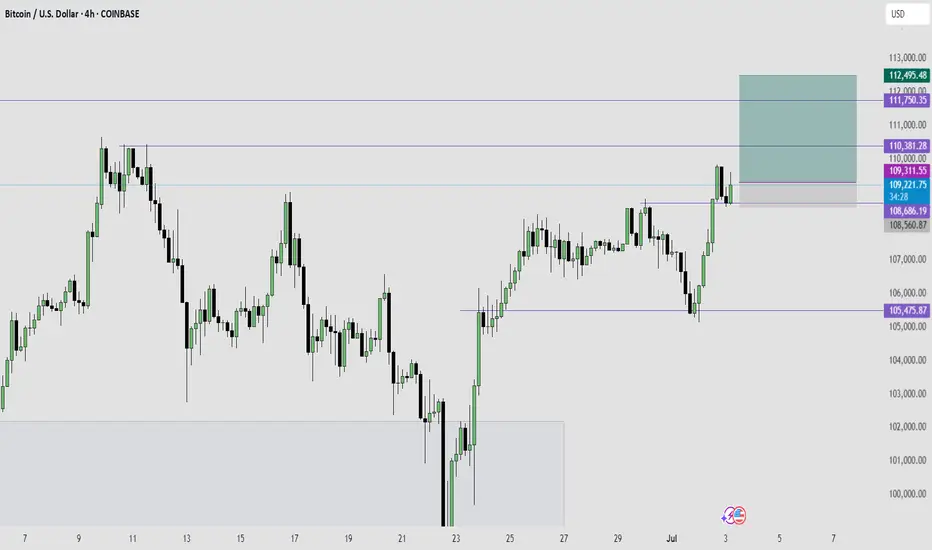
BTC LONG TRADE IDEAThis is a bullish trend continuation trade idea on BTC.
Trend across all higher time frame is bullish.
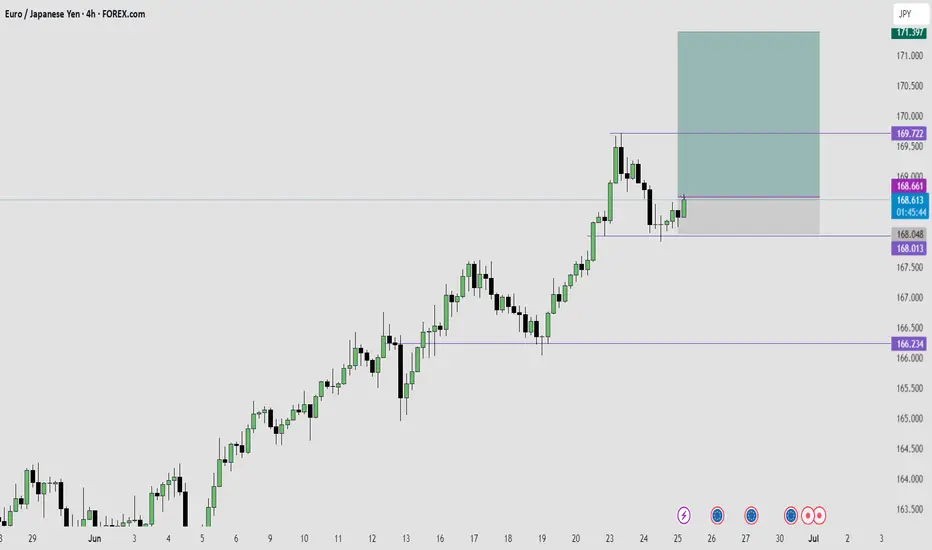
EURJPY LONG IDEAI have been waiting for this EURJPY long setup to form for the past 2 trading sessions.
This morning I saw this beautiful bullish swing low formed and that is my entry signal for to take a long trade on EURJPY.
REASONS:
EURJPY is super bullish right now.
The Daily and 4Hour time frame trend is extremely bullish. So, am only looking to take a long buy to follow the trend direction.
AUDCHF AUDCHF is preparing to break through support and fallWeak market structure. Gradually declining lows and no reaction to support at 0.5211. Buyers are trying to keep the price above 0.5211, but under market pressure their strength is weakening.
Relative to 0.5211, we see the formation of consolidation, which is of a “pre-breakdown” nature.
Accordingly, a break below the 0.5211 support level could trigger the activation of buyers' SL orders, leading to liquidation and a downward price distribution.
Potential targets include 0.518 and 0.5164.

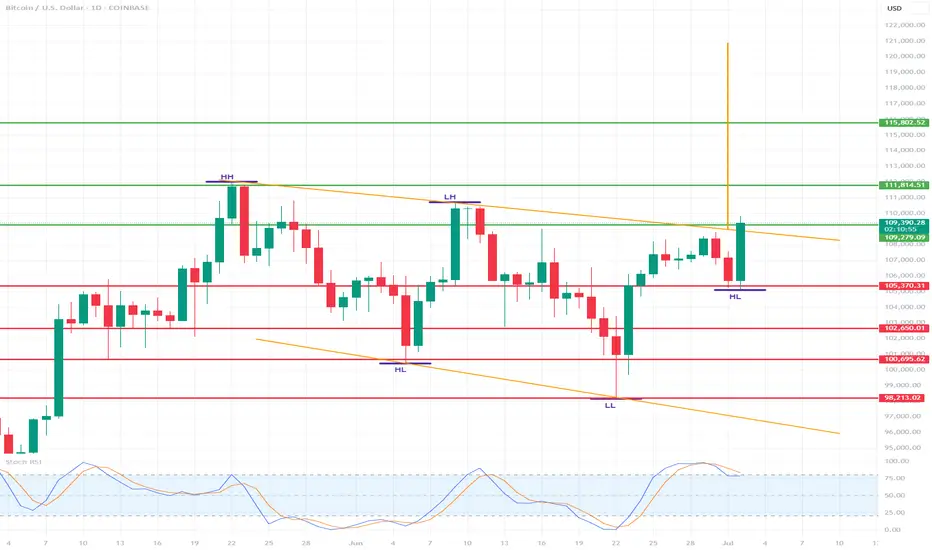
BTC with potential for $115,000/$120,000🔍 Market structure (Price Action)
📈 Trend:
The market previously formed higher highs (HH) and higher lows (HL) – a classic uptrend.
Then there was a correction and a lower high (LH) and lower low (LL) appeared – a potential change in the trend to a downtrend.
The last two lows are again HL (Higher Lows) – suggesting an attempt to return to the uptrend.
🔄 Key support and resistance levels
✅ Resistance (green horizontal lines):
117.469 – local resistance and potential breakout target from the current range.
115.802 – confirmed resistance from previous consolidations.
111.814 – strong local resistance (LH – Lower High formed there).
109.341 – current resistance, the price is currently testing it.
🛑 Support (red horizontal lines):
105.370 – local support, price reacted at this level in recent days.
102.650 – important support, level of previous HL.
100.095 – consolidation level before breaking out upwards.
98.213 – last LL – very important level in the context of defending the structure.
🧭 Structure of peaks and troughs
HH: Higher High – confirmed the previous uptrend.
LH: Lower High – first warning about changing the structure to down.
LL: Lower Low – confirmed a potential change to downside.
HL (x2): two more higher lows – suggest a possible return to growth.
📊 Stochastic RSI (at the bottom of the chart)
The oscillator is currently in the overbought zone (>80), approaching a downward crossover.
It suggests a possible short-term halt in growth or correction.
But in strong trends it may "stick" to the upper range.
📌 Potential scenarios:
🟢 Bullish:
If the price breaks above 109.341, it may test 111.814 and then 115.802.
Continuation of the HL → HH formation will confirm a trend reversal and further growth.
🔴 Bearish:
If the price does not stay above 109k and breaks below 105.370, there is a risk of a test of 102.650 and lower.
A break of 100.095 and especially 98.213 will negate the growth structure.
🧠 Conclusions:
The market is at a key decision point - HL formation vs. resistance zone.
Buyers' strength will be confirmed only after breaking 111-112k.
Stochastic RSI warns of potential pullback or consolidation.
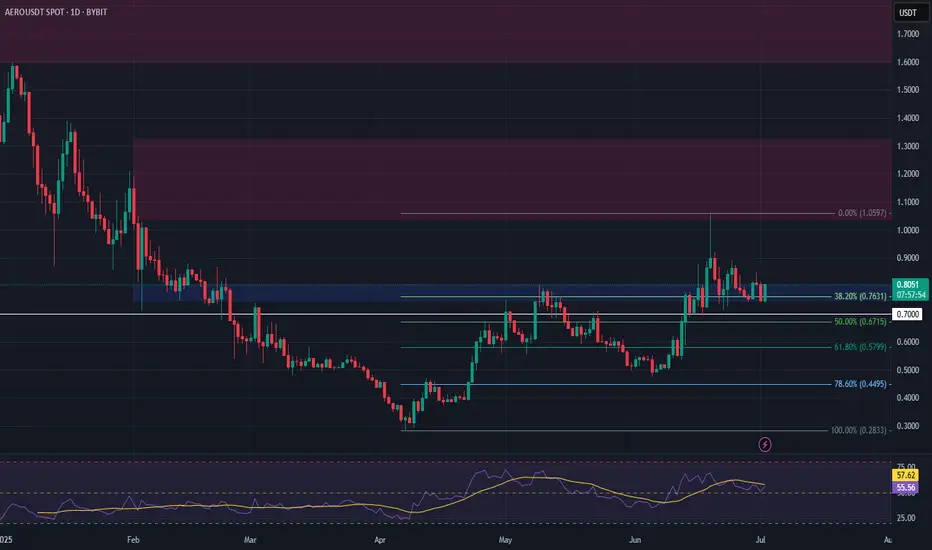
AERO Long Swing Setup – Strong Pullback into Fibonacci SupportAERO has shown notable strength in recent months and is now retracing into a key support zone, aligning with the 38.2% Fibonacci level. The $0.75–$0.80 area offers a solid long swing opportunity.
📌 Trade Setup:
• Entry Zone: $0.75 – $0.80
• Take Profit Targets:
o 🥇 $1.04 – $1.32
o 🥈 $1.60 – $2.05
• Stop Loss: Daily close below $0.70
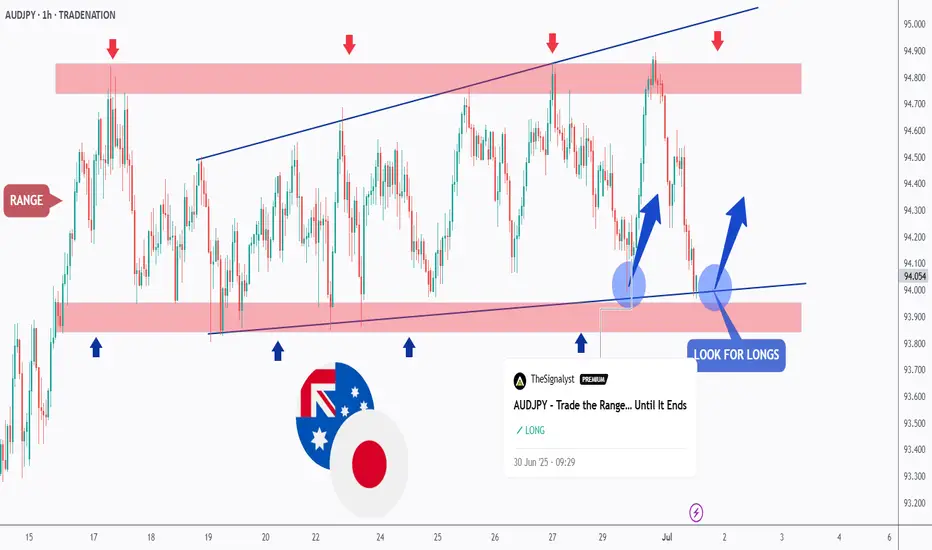
AUDJPY - let's do it again!Hello TradingView Family / Fellow Traders. This is Richard, also known as theSignalyst.
As per our last AUDJPY analysis (attached on the chart), it rejected the first blue circle zone and surged in a parabolic manner.
📈AUDJPY is currently retesting the intersection of the blue trendline and red support.
📚 As per my trading style:
As #AUDJPY is around the latest blue circle zone, I will be looking for bullish reversal setups (like a double bottom pattern, trendline break , and so on...)
📚 Always follow your trading plan regarding entry, risk management, and trade management.
Good luck!
All Strategies Are Good; If Managed Properly!
~Rich
Disclosure: I am part of Trade Nation's Influencer program and receive a monthly fee for using their TradingView charts in my analysis.
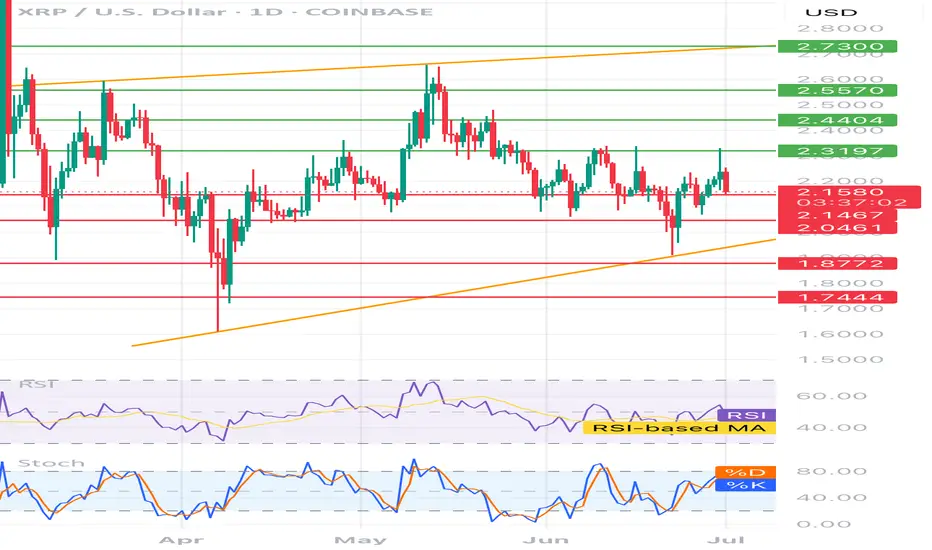
XRP/USD – Technical Analysis (1D)📊 XRP/USD – Technical Analysis (1D)
Current Price:
• Buy: 2.1554 USD
• Sell: 2.1553 USD
⸻
🧭 Trend & Structure
• Price is moving within a rising channel (orange lines).
• It’s currently trading closer to the lower trendline, suggesting potential support.
Resistance Levels (green lines):
• 2.3197
• 2.4404
• 2.5570
• 2.7300 (channel top)
Support Levels (red lines):
• 2.1467
• 2.0461
• 1.8772
• 1.7444 (key support)
⸻
📈 Indicators
RSI (Relative Strength Index)
• Hovering around the 50 level → neutral momentum.
• No strong divergence observed – RSI is moving with price.
Stochastic Oscillator
• %K has crossed %D upward → short-term bullish signal.
• Nearing the overbought zone (above 80) → a pullback could occur soon.
⸻
📌 Interpretation
• Price is testing the 2.15–2.16 zone, which has acted as both support and resistance in the past.
• A break above 2.32 could open the door toward 2.44 and 2.55 USD.
• A drop below 2.04 USD could lead to retesting 1.87 or even 1.74 USD.
• Overall trend: neutral to bullish, supported by the rising channel.
🎯 Trading Ideas
• Long Entry: Break and close above 2.32 USD with volume → targets: 2.44 / 2.55
• Short Entry: Breakdown below 2.04 USD → targets: 1.87 / 1.74
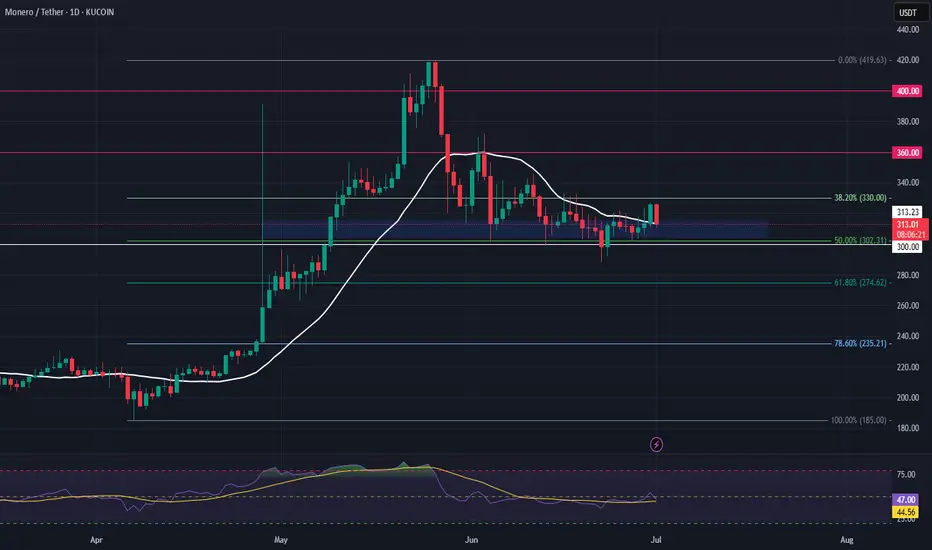
XMR Long Swing Setup – 50% Retrace with Structure ShiftXMR rallied from $200 to $400 and has now pulled back 50% of that move. With price reclaiming the 20-day SMA and a recent structure shift, there’s a solid setup forming with ~60% probability of continuation.
📌 Trade Setup:
• Entry Zone: $305 – $315
• Take Profit Targets:
o 🥇 $360
o 🥈 $400
• Stop Loss: Daily close below $300
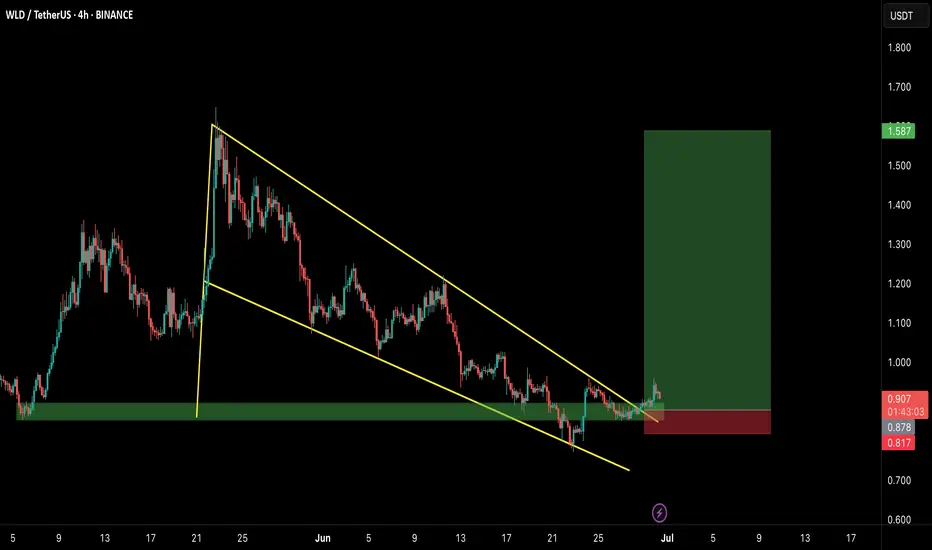
WLDUSDT – Bullish Setup Unfolding!Hey Traders — if you're into high-conviction setups with real momentum, this one’s for you.
WLD is breaking out from a well-defined falling wedge pattern on the 4H chart — a classic bullish structure. Currently retesting the breakout zone while holding the green demand box like a champ. 📈
💥 Entry Zone:
$0.87 – $0.91 (accumulate inside the green box)
🎯 Targets:
• $1.08
• $1.28
• $1.45
• $1.58
🛑 Stop Loss:
$0.81 (below the wedge + demand zone)
Looks poised for a strong move. As always, use proper risk management and watch for volume confirmation.
Let’s see how this plays out — bullish structure, solid risk-reward!
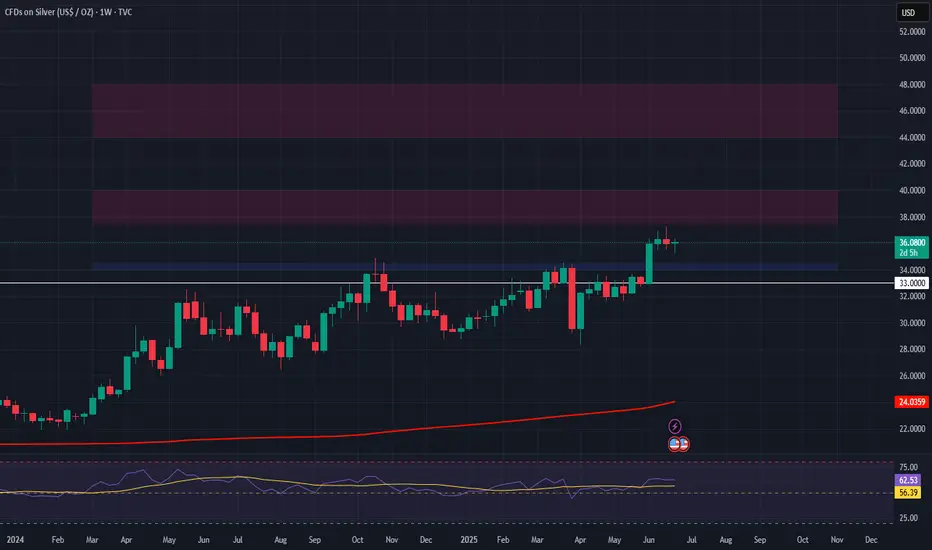
silver head and shoulder pattern price breakout in first week of june then sideways entire month
during same time gold was selling off below $3430 resistance and fed was very hawkish on stagflation
if buyers stopped buying and seller come in then price can breakdown then neckline of pattern

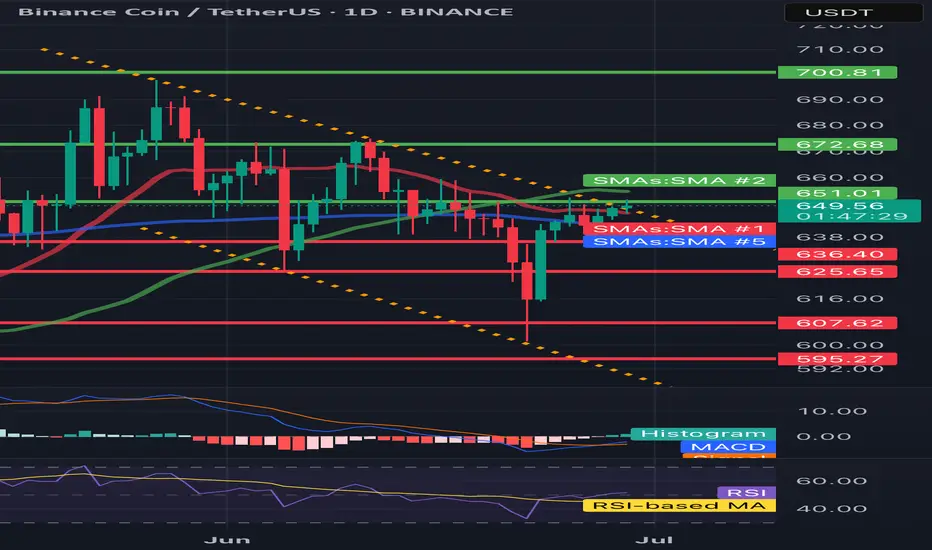
BNB/USDT 1D🕵️♂️ General context
• Steam: BNB/USDT
• Price: 649.52 USDT
• Time: 1D (daily interval)
• Currently, the reflection is underway after the inheritance, but the technical situation remains uncertain.
⸻
📈 Trend and market structure
• You can see a previous strong drop (visible long red candles).
• Currently, reflection is underway to the level of technical resistance (approx. 650–672 USDT).
• A medium -term inheritance trend is still in force - marked with an orange interrupted line of decreasing (inheritance) trend.
⸻
📊 Technical levels
🔹 Opora (green levels):
1. 651.01 USDT - the first tested resistance (current price right next to it).
2. 672.68 USDT - another resistance, above SMA (2), historically strong level of sales.
3. 700.81 USDT - strong psychological and technical level, tested in the past.
🔻 Support (red levels):
1. 636.40 USDT - short -term support (price maintaining just above this level).
2. 625.65 USDT - key support - if it is broken, a possible test of lower levels.
3. 607.62 and 595.27 USDT - subsequent support, where purchases appeared earlier (Long Knoty).
⸻
📉 Technical indicators
🔵 MacD
• Histogram comes out of red - a potential signal of Momentum change to upward.
• The MacD line begins to turn up to the signal line - possible Bullly Crossover soon (buy signal).
🟣 RSI
• RSI oscillates around line 40-50-it is a neutral zone with a slight tilt down, but RSI-Based has a possible reflection.
• Lack of purchase or sale - suggests that traffic can go both ways.
⸻
🔃 Medium walking (SMAS)
• The price is tested by several medium (green, red, blue line):
• SMA (1) and SMA (5) are similar and flat - no clear short -term trend.
• SMA (2) acts as a strong resistance at 672 USDT.
• Need to break out over 672.68 to recognize that the trend can turn around.
⸻
✅ Applications - technical scenarios
🔼 Bullish (upward) scenario:
• Crossing the level 651–672 USDT and closing the daily candle above.
• Confirmation by RSI> 50 and MacD crossover.
• Target: 700–710 USDT.
🔽 Bearish (inheritance) scenario:
• Price rejection with current resistance and descent below 636 → 625 USDT.
• If 625 falls, a possible drop in around 607/595 USDT.
• RSI may then fall into the sale zone.
⸻
🧠 Neutral / swing strategy
• Currently, the market in potential consolidation between 625 and 672 USDT.
• You can consider:
• Buying at the lower consolidation limit (625–636) with a stop-loss below 620.
• Short or Take Profit at the upper limit (670+) until it breaks out.
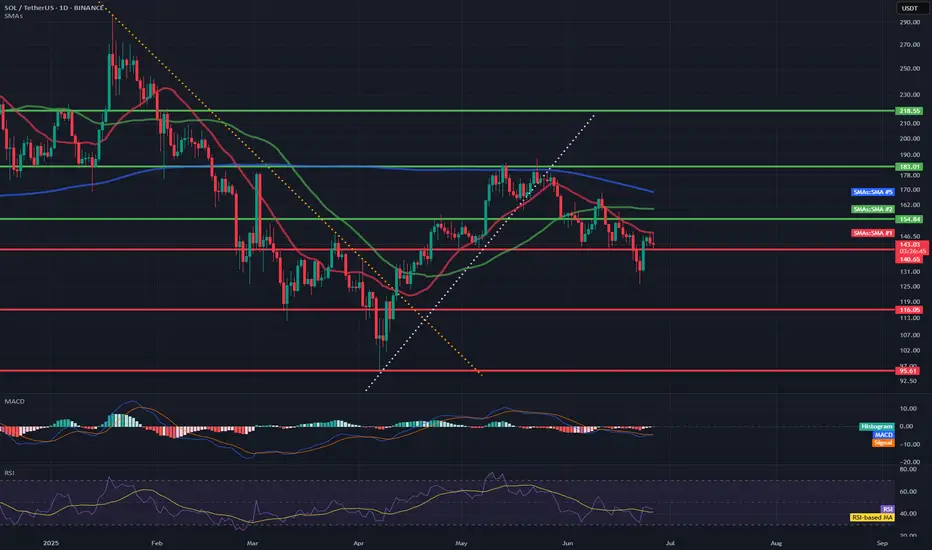
SOL/USD🔹 Trend direction
Current short-term trend: down
Price below key moving averages:
SMA50 (green) ≈ 154.84
SMA200 (blue) ≈ 168.79
Price ≈ 142.49 – below both, confirming weakness.
🔹 Supports and resistances (key levels)
✅ Supports:
142.00–143.50 – current level where price is struggling (multiple price reactions).
131.00 – strong support, last low (June 18).
119.00 / 116.00 / 113.00 – next supports from previous consolidations.
95.61 – deep support if market breaks down.
❌ Resistances:
148.00–150.00 – local resistance, coinciding with the red SMA (short-term resistance).
154.84 – resistance (SMA50).
162.00 – resistance (SMA200).
183.00 – main resistance from the May peak.
218.55 – very strong resistance from March.
🔹 Technical indicators
📉 MACD:
MACD line < signal, negative histogram → bearish signal.
No signs of bullish strength.
📉 RSI:
RSI ≈ 41.31 – close to the oversold zone, but not there yet (below 30).
RSI trend also downward.
🔹 Formations and trend lines
Broken support line after the April-May bullish structure (white trend line).
The previous bearish trend line (yellow) was broken in April, but the momentum did not hold.
A lower high and lower low may be forming now – a classic bearish structure.
🔹 Potential scenarios
🔻 Bearish:
Breakout of 142 → test of 131 → possible drop to 119/116.
Staying below SMA50 and MACD still negative = high chance of continuing declines.
🔼 Bullish:
Recovery of 148–150 needed → only then a chance to test 154 and SMA50.
RSI close to oversold = possible local technical bounce, but not reversing the trend.
📌 Conclusions / Summary
General trend: Bearish (down).
Sentiment: Negative, no confirmed signals of strength.
If level 142 breaks - next test will be at 131.
A strong breakout above 150-154 is needed to talk about a change in structure.
INJ Long Swing Setup – Breakout Retest Opportunity at Key LevelIf the crypto market pushes higher and INJ flips current resistance into support, we’ll be looking to enter on a retest of the $11.60 zone. This level could act as a launchpad for the next leg up.
📌 Trade Setup:
• Entry Zone: $11.60 – $11.60 (Breakout Retest)
• Take Profit Targets:
o 🥇 $14.20 – $16.25
o 🥈 $19.80 – $23.00
• Stop Loss: Daily close below $10.70
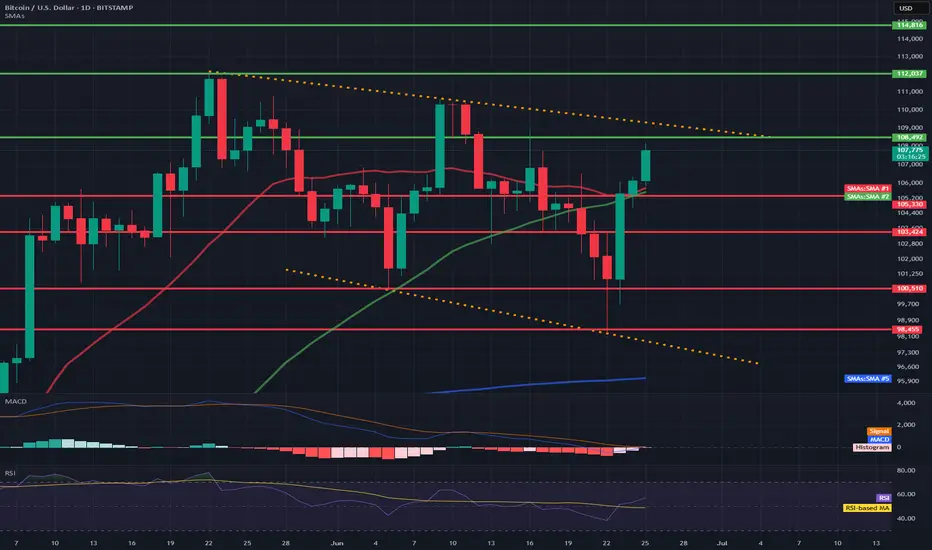
BTC/USD 1D Chart📊 1. Technical formation: Downtrend channel marked with orange lines
Upper trend line (resistance): ~108,200 – 110,000 USD
Lower trend line (support): ~98,455 – 97,000 USD
➡️ Such a formation usually ends with a breakout. The direction of the breakout will be key – currently, the price is testing the upper resistance line.
💵 2. Support and resistance levels
📈 Resistance:
108.202 – currently tested
112.037 – psychological level
114.816 – local top
📉 Support:
105.300 – SMA 50 + local support
103.424 – local lows
100.510 – key psychological support
98.455 – lower edge of the triangle
📉 3. Moving averages (SMA)
SMA 50 (green): currently as dynamic support (~105.300)
SMA 200 (blue): far below the price (~96.000), inactive in the short term
SMA 20 (red): price broke through it upwards – a signal of bullish strength
➡️ A bullish crossover took place between SMA 20 and SMA 50 → bullish signal.
📉 4. MACD (Momentum)
MACD line is approaching the intersection with the signal line from below.
The histogram is becoming less and less red → a potential intersection and a bullish crossover signal may occur any day now.
📉 5. RSI (Relative Strength Index)
Currently: 57.19
RSI is rising and approaching the overbought zone (70), but it is not overheated yet.
Exceeding 60 would be a signal of further bullish strength.
🔍 6. Volume and context
There is no volume marking on the candles, but:
The current bullish candle is strong and breaks through the key averages (SMA 20, 50).
This indicates buyer activity with technical support.
🟢 Bullish scenario (if a breakout occurs up)
A breakout above 108.200 with a close of the daily candle could open the way to:
112.037 (next resistance)
then even 114.816
🔴 Bearish scenario (false breakout)
A rejection from 108.200 and a drop below 105.300 → a possible return to:
103.424 or even 98.455 (lower triangle line)
Silver Long Setup–Breakout Retest After Clearing Key ResistanceSilver TVC:SILVER has broken above the $34.50 resistance level, as it looks to catch up to the gold/silver ratio. We’re now watching for a retest of this breakout zone at $34.00–$34.50 for a potential long spot entry.
📌 Trade Setup:
• Entry Zone: $34.00 – $34.50
• Take Profit Targets:
o 🥇 $37.50 – $40.00
o 🥈 $44.00 – $48.00
• Stop Loss: Daily close below $33.00
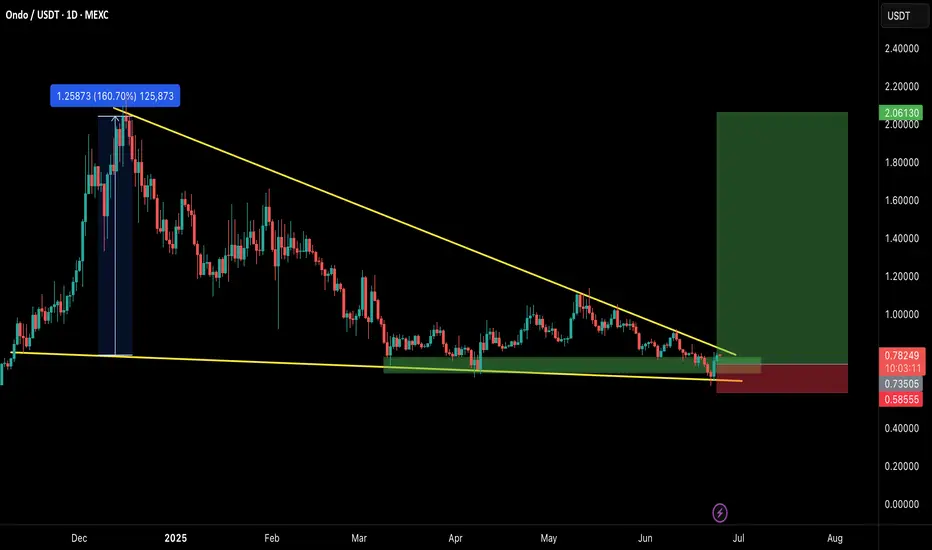
ONDOUSDT – POTENTIAL BREAKOUT TRADE SETUP!Hey Traders — if you're into high-conviction setups with real momentum, this one’s for you.
ONDO is trading inside a falling wedge on the daily chart — a classic bullish structure that often leads to explosive breakouts. 📈
Accumulation Zone: Price is currently sitting inside the green support box, which has held strong multiple times. This makes it a good area to start accumulating before a potential breakout.
🚀 Breakout not confirmed yet, but structure looks promising. A breakout above the wedge will be the confirmation trigger.
📌 Trade Setup:
✅ Entry (Spot Accumulation): $0.73–$0.78
🎯 Targets after breakout: $1.10 / $1.45 / $2.05
🛑 Stop-loss: $0.58
📈 Bias: Bullish on breakout
🔸 Monitor for a clean breakout candle + volume above the wedge.
🔸 Manage position sizing while accumulating in the zone.
Let’s see if history repeats and ONDO gives us a strong breakout move.
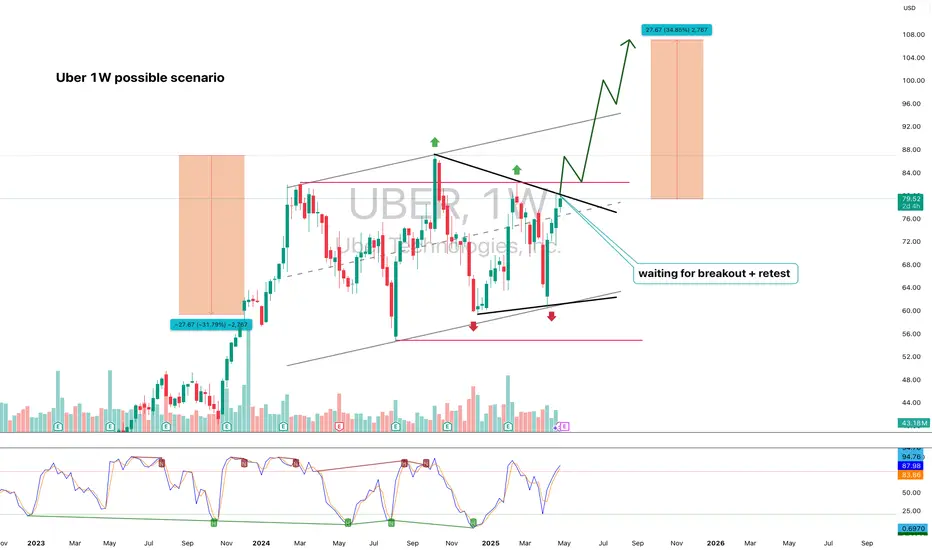
Uber (UBER, 1W) Tightening Structure Ready for BreakoutOn the weekly chart, UBER has formed a strong ascending wedge / tightening channel, showing clear higher lows and repeated rejections near upper resistance. The price is now approaching the apex of the pattern, with a possible breakout setup above $82.42.
If confirmed, the projected measured move (H = $27.67) aligns with Fibonacci extension targets at:
– $89.86 (1.272)
– $93.74 (1.414)
– $99.32 (1.618)
Technical structure:
– Price held support twice, confirming bullish intent
– Structure tightening — breakout likely on sustained volume
– Bullish divergence forming on the weekly stochastic oscillator
– A breakout above $82.42 activates the next impulse wave
– Volume is stable, with no signs of heavy distribution
Fundamentals:
Uber has reached a major financial milestone: consistent profitability and positive EBITDA growth. The company continues to expand across mobility and delivery, with a focus on cost efficiency, platform monetization, and retention. Increased user activity and growing institutional interest support a bullish mid-term thesis. Uber is increasingly seen as a core holding in next-gen tech and services portfolios.
The technical structure is approaching resolution. A confirmed breakout above $82.42 opens the door for a move to $89.86 → $93.74 → $99.32. With bullish structure and improving fundamentals, Uber is positioned for the next leg higher. This is a setup worth watching.