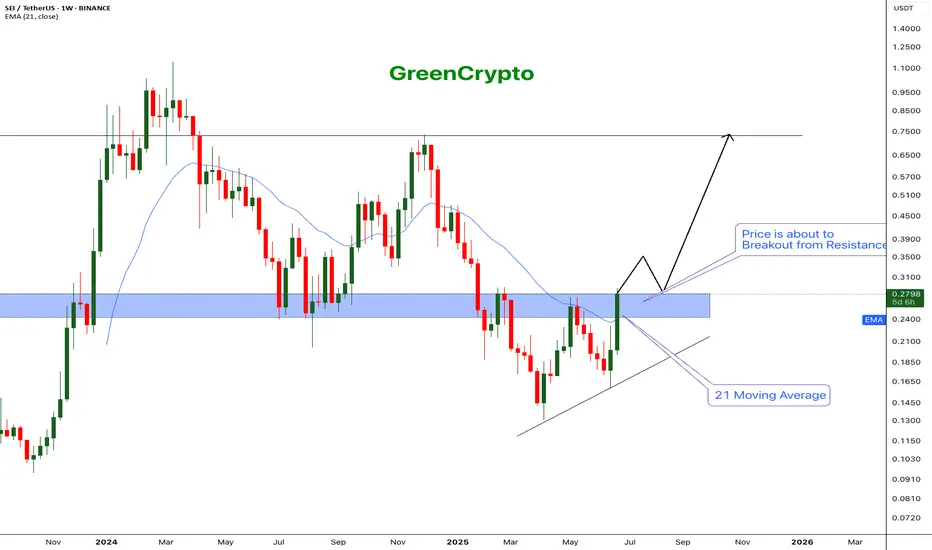
SEI - The next big runner$BINANCE:SEI/USDT (1W CHART) Technical Analysis Update
SEI is currently trading at $0.2785 and showing overall bullish sentiment
Price successfully breached the 21 EMA and now price is trading near one of the major resistance zone.
If the weekly candles closes above the resistance then we can expect further bullish momentum.
I'm expecting the price to easily break the resistance and hit the next major resistanc e around 0.75
Entry: After close above resistance (0.285)
StopLoss: 0.18
TakeProfit 1: 0.3506
TakeProfit 2: 0.4962
TakeProfit 3: 0.7367
Don't forget to keep stoploss!
Follow our TradingView account for more technical analysis updates. | Like, share, and comment your thoughts.
Cheers
GreenCrypto
Support
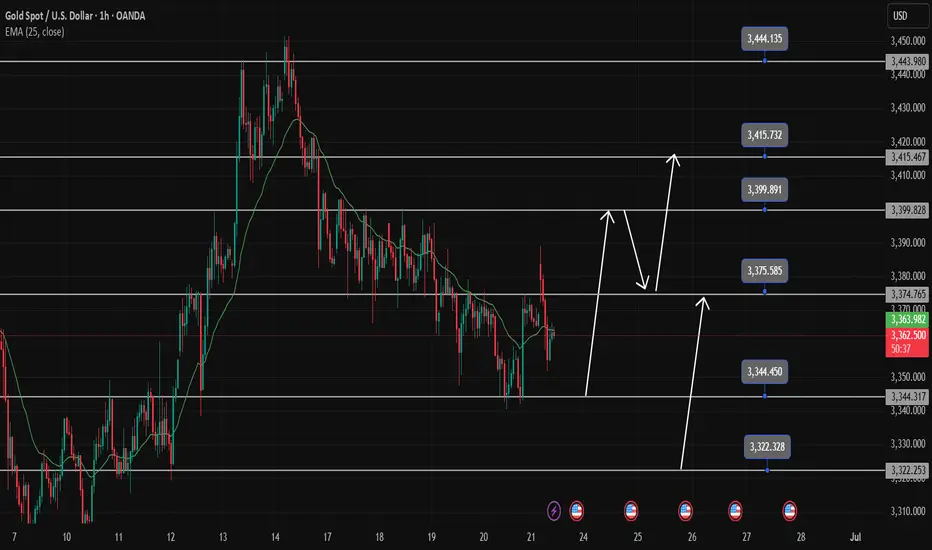
Gold Trading Strategy June 23The last two D1 candles have continuously drawn out the wicks. The Sellers may no longer be interested in dominating the market.
Currently, Gold is moving sideways in a wide range. 3345 and 3375 are the two Breakout zones of the gold price in today's trading day. When breaking out of the breakout zone, the price will continue its strong trend. Limit trading against the trend when the price breaks out.
Trading signals may also appear if there is confirmation from the candle that does not break out of this breakout zone.
Resistance and support zones remain the same as last week.
Resistance 3400-3415-3443
Support 3322-3296
Break out: 3375-3345
Recommended good trading signals
SELL 3399-3401 Stoploss 3405
BUY 3322-3320 Stoploss 3306
MKR/USDT (MakerDAO) on the 4H time frame🔷 1. Trend and market structure
🔸 Upward channel:
The price is moving in a wide, ascending channel (orange lines).
The lower line of the channel was last tested on June 22, 2025, which ended with a dynamic upward bounce.
The upper limit of the channel reaches around 2,450 USDT.
🕸️ Market phase:
In the short term, the market was in a downward correction phase within the uptrend.
Currently, we see a strong rebound from support - a new uptrend is possible.
🔷 2. Key horizontal levels (support/resistance)
🟥 Support:
1,637 USDT - local support (the lowest level of the red zone), almost tested at the bottom.
1,717 USDT - very technical support, tested several times.
1,800 USDT – psychological level and local consolidation.
1,901 USDT – last support peak, currently broken upwards.
🟩 Resistances:
2,003 USDT – current price level, currently tested as new resistance.
2,129 USDT – strong resistance from previous peaks.
2,264 USDT – previous swing high.
2,433 USDT – upper boundary of the channel and technical level from historical peaks.
🔷 3. Price and candle behavior
Strong demand reaction at the lower boundary of the channel: long pin bar/bull's embrace at the lower boundary.
The upward movement was dynamic and uniform, which indicates high buyer activity.
If the price stays above 1,901 USDT – further increases are possible.
🔷 4. Technical indicators
🔁 Stochastic RSI (4H):
Currently in the overbought zone, just below the level of 100 - a temporary correction or consolidation may occur.
However, with a strong upward trend, Stoch RSI may "stick" to the upper band - it does not yet give a clear S/S signal.
🔷 5. Technical scenarios
🟢 Bullish scenario (continuation of growth):
Condition: maintaining the level above 1,901 USDT.
Targets:
TP1: 2,129 USDT
TP2: 2,264 USDT
TP3: 2,433 USDT (upper limit of the channel)
Stop-loss: below 1,800 USDT
🔴 Bearish scenario (rejection of resistance):
Condition: strong rejection of 2,003 USDT and return below 1,901
Targets:
TP1: 1,800 USDT
TP2: 1,717 USDT
TP3: 1,637 USDT
SL: return above 2,003 USDT
🔷 6. Final remarks
The current upward movement looks like a "V-shape reversal" reaction - a sharp turnaround with dynamic volume suggests strong buyer interest.
The key will be the reaction to 2,003 USDT - a breakout and retest can give a very good long entry.
Short positions are risky as long as the price is in the lower half of the ascending channel.

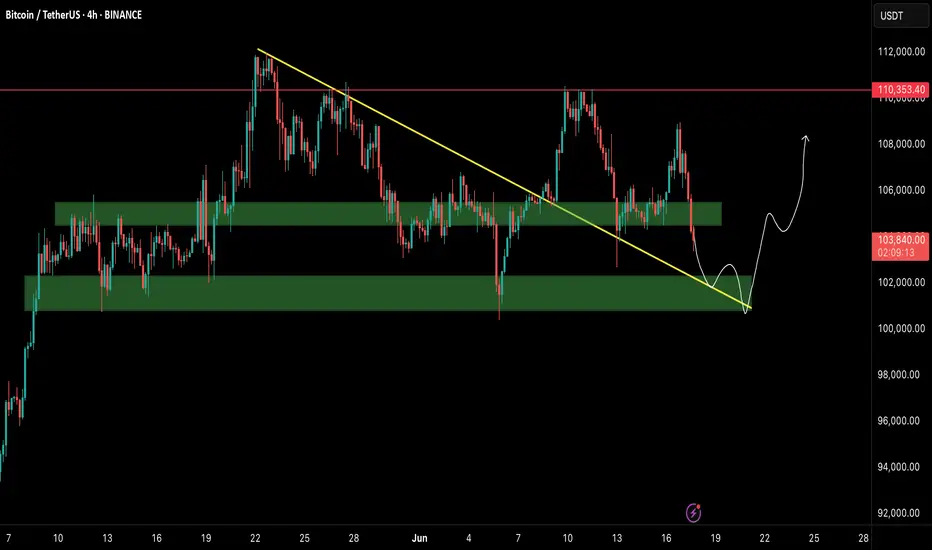
BTCUSDT Update — Big Macro Forces In Play!!Hey Traders!
If you’re finding value in this analysis, smash that 👍 and hit Follow for high-accuracy trade setups that actually deliver!
Bitcoin once again testing key support levels as global tensions continue to fuel uncertainty in the markets.
Chart Overview:
BTC broke down from short-term resistance and is now retesting the major support zone between $102K–$103K. The structure still remains within a broader consolidation range, but this support zone is absolutely critical for bulls to defend.
Immediate Resistance: $106K → $110K
Immediate Support: $102K → $100K
A breakdown below $100K could trigger deeper liquidations towards $95K–$98K, while a successful defense here could push BTC back toward previous highs.
Geopolitical Impact:
Global headlines are heavily influencing risk assets right now:
🇮🇱 Israel-Iran tensions are escalating.
🇺🇸 The US is signaling stronger involvement diplomatically, adding more fear to markets.
📉 Traditional markets have already started to show signs of caution.
Bitcoin, as a risk asset, remains vulnerable to these global macro shocks in the short term.
The Game Plan Right Now:
If we see sustained support at $102K–$103K, there’s still room for a relief bounce towards $106K–$110K in the near term.
However, if global tensions escalate further, expect increased volatility with downside liquidity grabs.
Stay cautious with tight risk management. Macro headlines are still driving sudden sentiment shifts.
📊 My Bias:
Watching for potential sweep of $102K with possible reversal structure forming. Any clear reclaim of $105K may signal a local bottom.
📝 Key Takeaway:
Global narratives are bigger than technicals right now. The next few days could dictate whether BTC holds or faces another sharp liquidation event.
Stay patient. Stay disciplined. And most importantly: manage your risk.
👉 Follow for more real-time updates as we track both price action and macro headlines impacting crypto.
Major Support Confluence, Tactical Rebound or Looming Flush?__________________________________________________________________________________
Technical Overview – Summary Points
__________________________________________________________________________________
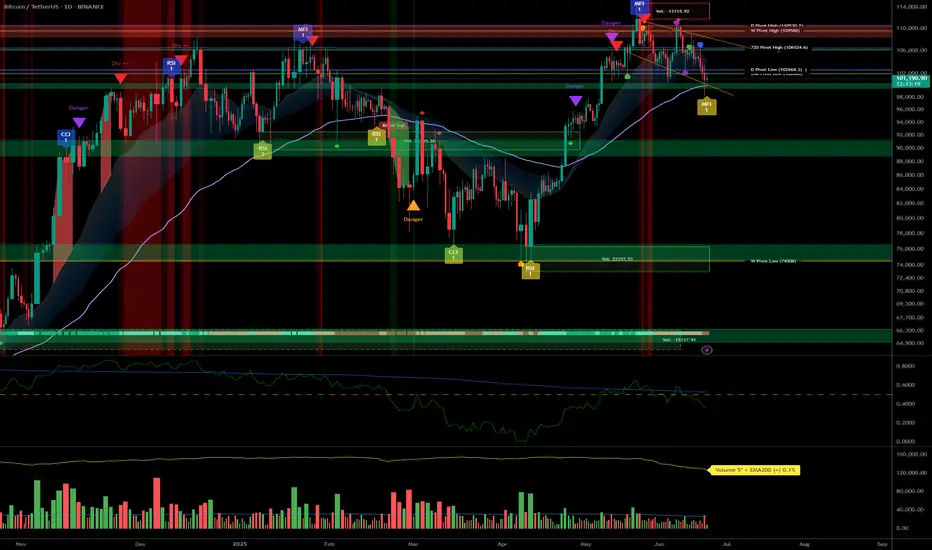
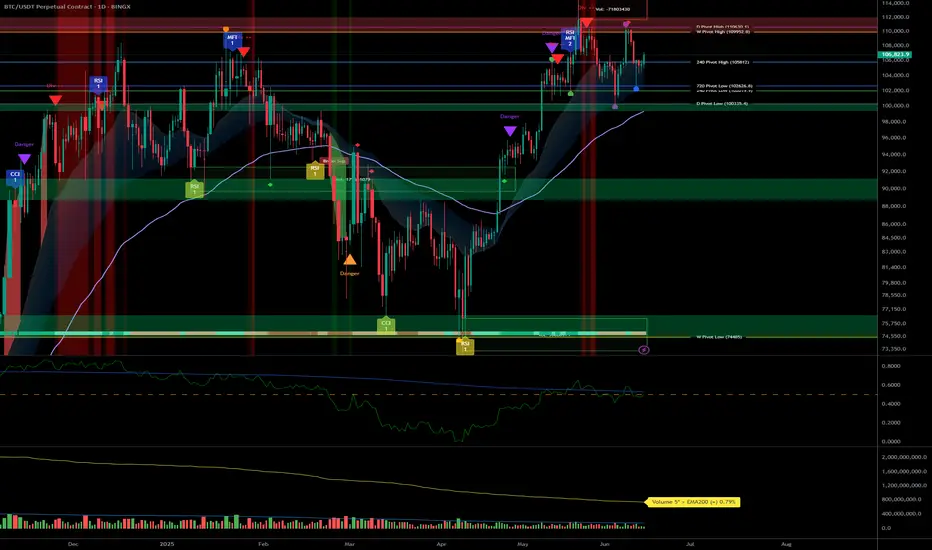
Momentum: BTC is working a major daily support zone (102.6–103k USDT) with strong confluence across 1D, 12H, and 2H pivots. Technical rebound in play, but still no strong behavioral catalyst.
Supports / Resistances: Key support clusters at 102.3–103.3k (2H, 720min, daily pivots). Main resistances: 106.4k–110k.
Volume: Very high on 2H/1H near supports, hinting at possible washout/profit-taking. No buy climax identified.
Risk On / Risk Off Indicator: Strong bullish signal from 1D to 30min (neutral on 15min), while lower TFs remain under selling pressure.
Multi-TF Behavior (ISPD DIV): No excess or euphoria: market is waiting/compressed, caution is necessary in the short term.
__________________________________________________________________________________
Strategic Summary
__________________________________________________________________________________
Global Bias: Tactical bullish but cautious — confirmation on clean rebound needed to strengthen conviction.
Opportunities: Technical entries in the 102.6–103.3k zone with stops below 102k (aggressive) or 97.5k (defensive). Profit-taking zones at 106.4k/109.9k/110k.
Risk Areas: Invalidated below 97.5k (swing), potential flush down to 94k/88–89k. Heightened vigilance around macro releases.
Macro Catalysts: PMI prints (June 23), Fed on pause, increased geopolitical risks (latent volatility and cross-asset caution).
Action Plan: Prioritize active management: reduced position sizing, mechanical stops, and real-time bias adjustment based on volume and behavioral response.
__________________________________________________________________________________
Multi-Timeframe Analysis
__________________________________________________________________________________
1D–12H: Major supports (D Pivot Low 102626.8), structural uptrend, strong Risk On signal, but no behavioral/volume extremes.
6H–4H: Ongoing technical rebound, moderately high volume, support confluence, BUT short-term TF pressure remains.
2H–1H: Very high volume at support, possible local flush, but still no bullish behavioral confirmation—monitor for rapid volatility.
30min–15min: Tentative stabilization post-support absorption, no clear psychological excess, risk of further downside if rebound not confirmed; Risk On / Risk Off Indicator is neutral at 15min.
Summary: Bullish structural setup, but fragile micro dynamics—discipline and speed are key.
__________________________________________________________________________________
Fundamental & On-chain Overview
__________________________________________________________________________________
External factors: Fed on hold, US inflation slightly higher, robust economy, increased geopolitical risks (hot spots Israel–Iran, Ukraine–Russia). Latent risk-off sentiment but not yet materialized.
Calendar to watch: June 23, 09:45–10:00 UTC (US PMI & home sales).
On-chain: Low user activity, high institutional volumes, off-chain flow dominance, leverage high (mostly in stablecoins, limiting crypto-margined liquidation spirals), no euphoria or panic detected.
Risk/reward synthesis: Key technical buy zone 102.6–103.3k (stop < 102k/97.5k), targets 106.4k/109.9–110k. Below 97.5k: bearish bias, defensive risk management needed.
__________________________________________________________________________________
Final strategic synthesis
__________________________________________________________________________________
BTC remains "structurally strong but tactically fragile": major support confluence and bullish sectoral signal, but persistent micro selling pressure and macro/cross-asset uncertainty. Only entries on clear technical signals, mechanical stops and active risk management offer rational short-term setups in this volatile and compressed environment.
__________________________________________________________________________________
LTC/USDT chart technical analysis (1D)🔷 1. Trend and market structure
🔺 Main channels:
The chart is moving in an ascending channel (orange lines), the lower and upper limits of which have been respected since mid-2022.
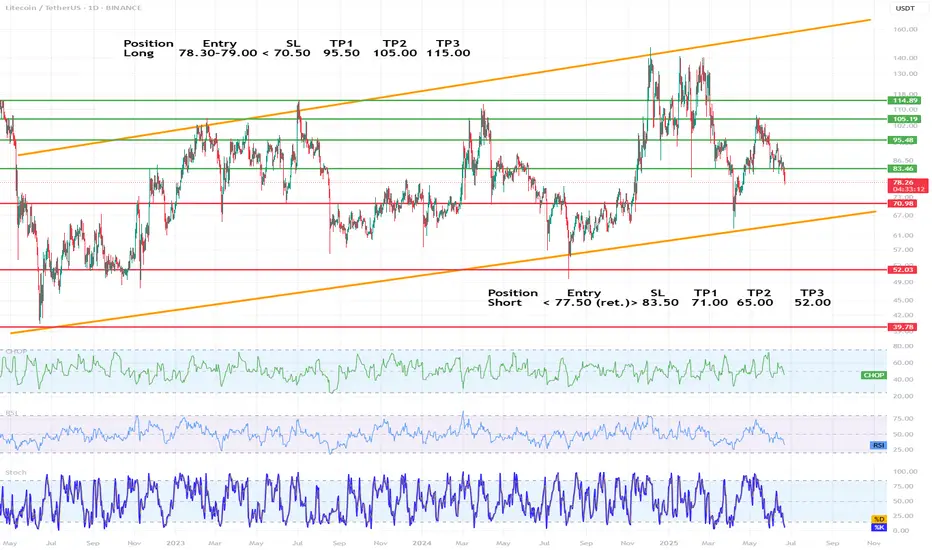
The current price (around 78.3 USDT) is in the middle range of the channel, with a downward trend in recent weeks.
🔁 Market phase:
The price is in consolidation in a broader uptrend.
The last upward swing did not break through the previous peak (~135 USDT), which may indicate weakening momentum.
🔷 2. Key horizontal levels (support/resistance)
✅ Resistance levels (green lines):
83.46 USDT – the nearest resistance, currently being tested from below.
95.48 USDT – strong resistance from March-April 2024.
105.19 USDT – a level tested many times in the past.
110.00 USDT – a psychological level.
115.83 USDT – a local high from December 2023.
🛑 Support levels (red lines):
78.30 USDT – currently tested support level.
70.98 USDT – a key defensive level for bulls.
52.03 USDT – strong historical support.
39.78 USDT – the last line of defense, consistent with the lows from 2022.
📐 Dynamic support (orange line):
The lower boundary of the ascending channel – currently falls around 65 USDT and increases over time.
🔷 3. Technical indicators
📊 CHOP (Choppiness Index)
Oscillates near the lower values → the market is starting to leave the consolidation phase.
Potential directional movement soon, most likely downward (due to momentum).
📉 RSI (Relative Strength Index)
RSI below 50, currently around 40–45 → supply advantage.
Not oversold yet, but momentum is downward.
🔄 Stochastic
Well below 20, i.e. in the oversold zone.
Potential for a short-term bounce, but it can also go lower with a stronger sell-off wave.
🔷 4. Technical scenarios
🟢 Growth scenario (long):
Condition: Defending the level of 78.3 USDT and a quick return above 83.46.
Targets:
TP1: 95.48
TP2: 105.19
TP3: 115.83 (upper border of the channel)
SL: below 70.98 USDT
🔴 Bearish scenario (short):
Condition: Break 78.3 and retest as resistance.
Targets:
TP1: 70.98
TP2: 65 (lower channel line)
TP3: 52.03 (large accumulation zone)
SL: return above 83.46
🔷 5. Swing strategy proposal
Long
Entry 78.30–79.00
SL < 70.50
TP1 95.50 TP2 105.00 TP3 115.00
Short
Entry < 77.50 (ret.)
SL > 83.50
TP1 71.00 TP2 65.00 TP3 52.00
🔷 6. Additional comments
It is worth observing the price reaction at 70.98 USDT - this could be a capitulation level or a strong rebound.
The formation on the daily chart resembles a head and shoulders (H&S) - a warning signal for bulls.
Looking deeper in the consolidation zone of $BTC 4hr Wanted to show how I use fibs and how I use them to approach entry and exit points while in consolidation.

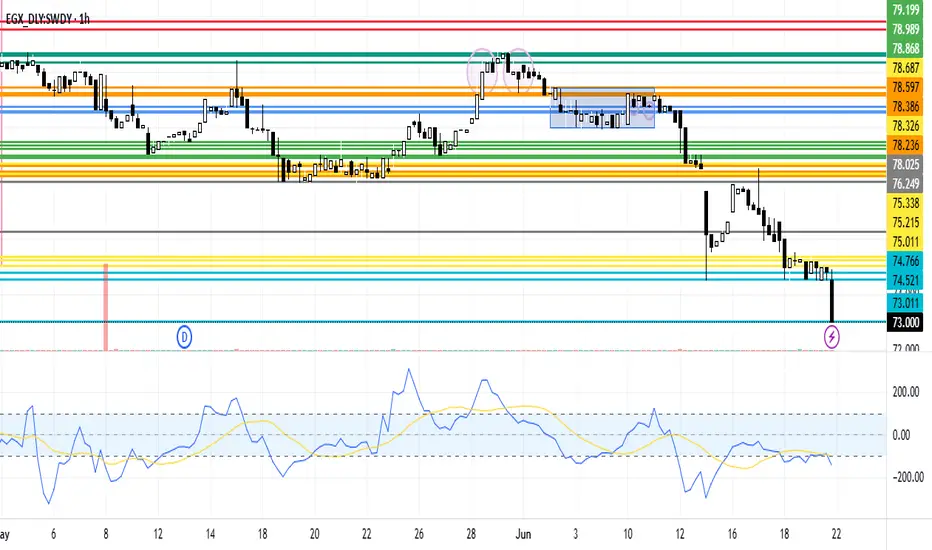
SWDY Decrease AnalysisSWDY stock is in a decreasing zone. It reached the lowest support line at 73.011. In case of rebounding up which is highly expected, it'll reach the resistance line 75.011 to reach the 75.215 then the 3rd at 75.338
ETHUSDT – LAST HOPE FOR BULLS!Hey Traders!
If you’re finding value in this analysis, smash that 👍 and hit Follow for high-accuracy trade setups that actually deliver!
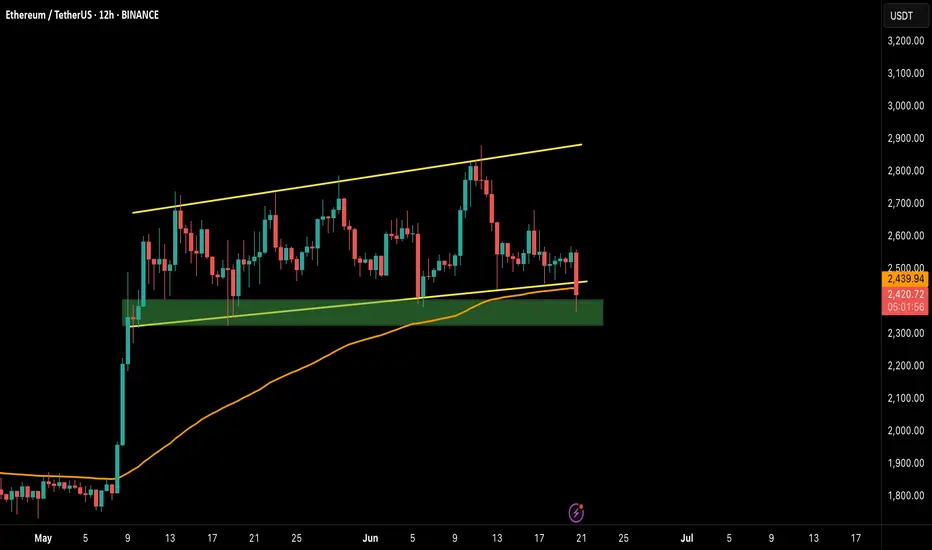
ETH has officially broken below the ascending channel support and is now testing the final demand zone (highlighted in green). This zone also aligns with the 200 EMA on the 12H timeframe — historically a strong dynamic support.
📉 If ETH fails to hold this green box, it could trigger a deeper correction, potentially dragging the price back towards the $2,200–$2,100 range.
✅ Bullish Case: A quick reclaim of the $2,460–$2,500 area followed by strong volume could invalidate this breakdown and bring back momentum toward $2,800.
🚨 Bearish Confirmation: A clean close below $2,400 on the 12H/Daily with rejection wicks would open the floodgates for lower targets.
💡 This is a make-or-break moment. Bulls need to defend this zone with strength — or risk handing over full control to the bears.
📍 Levels to Watch:
Support: $2,360 / $2,280 / $2,120
Resistance: $2,500 / $2,660 / $2,800
📊 Stay cautious, stay prepared. Follow for real-time crypto breakdowns & setups.
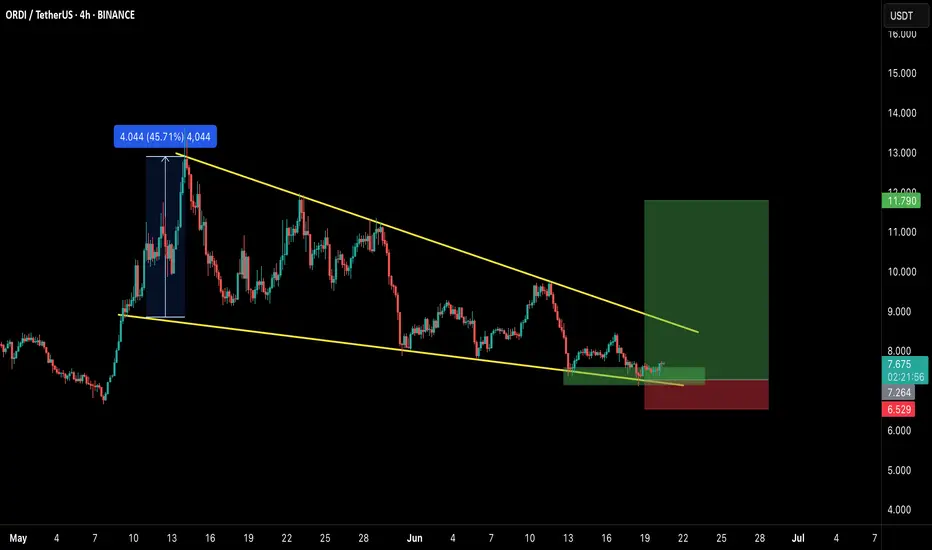
ORDI/USDT – Bullish Falling Wedge Formation!!Hey Traders — if you're into high-conviction setups with real momentum, this one’s for you.
ORDI is forming a bullish falling wedge pattern and is currently consolidating near crucial support. The price is showing initial signs of breakout potential.
Here's the trade plan:
Entry: $7.20–$7.70
Targets: $9.20 / $10.50 / $11.90
Stop Loss: $6.50 (Strict)
Excellent risk-to-reward opportunity here. Keep your stops tight and manage your risk wisely.
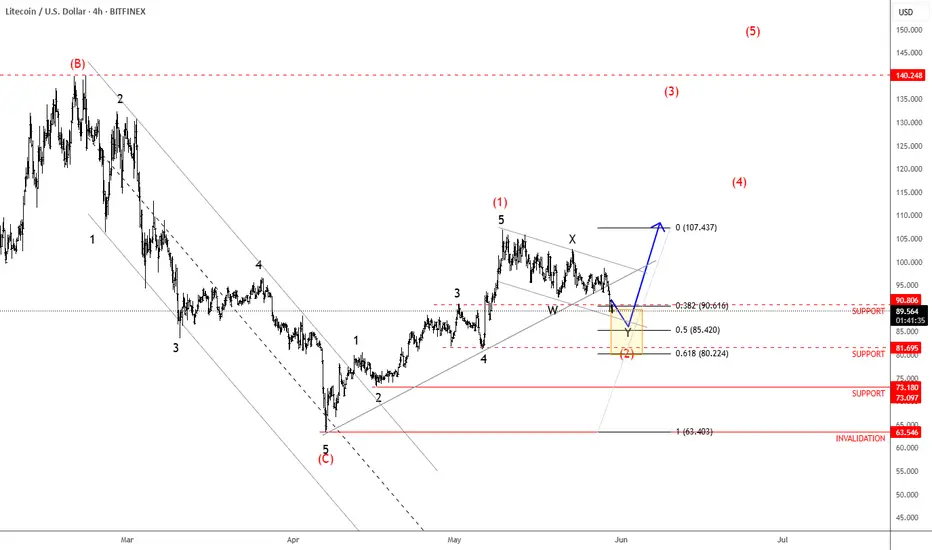
Litecoin Is Forming A Bullish PatternLitecoin with ticker LTCUSD made nice and clean five-wave recovery back to 100 area in the 4-hour chart, which confirms support in place and bullish reversal, so it can be a higher degree wave (1), thus more upside is expected for a higher degree wave (3) after current complex W-X-Y correction in wave (2) that can be in final stages. First support is here around 90-85 area, while second deeper one would be at 80 area.
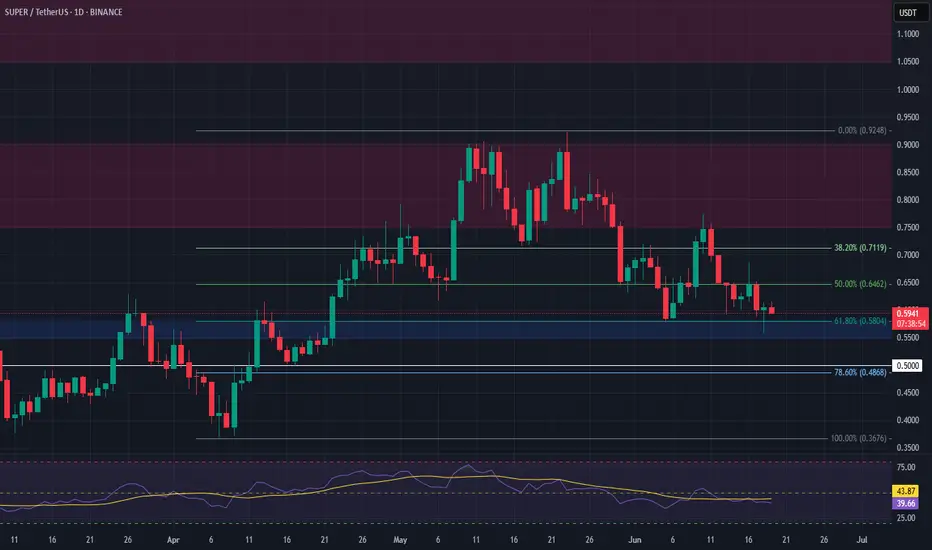
SUPER Long Setup – Confluence of Fibonacci and Major SupportSUPER has retraced into a strong confluence zone, aligning with the 61.8% Fibonacci level and a major support area. The $0.55–$0.58 range offers a solid opportunity to enter a long swing trade.
📌 Trade Setup:
• Entry Zone: $0.55 – $0.58
• Take Profit Targets:
o 🥇 $0.75 – $0.90
o 🥈 $1.05 – $1.20
• Stop Loss: Daily close below $0.50
BTC – Bullish bias under review: 102k/103k supports in focus__________________________________________________________________________________
Technical Overview – Summary Points
__________________________________________________________________________________
Momentum : Dominant on all major timeframes (1D, 12H, 6H, 4H). Risk On / Risk Off Indicator signals STRONG BUY except on 15min (neutral).
Support/Resistance : Structurally key pivot zone 102k–106k; major supports 102k/103k. Potential breakout above 106k (swing target 109k).
Volumes : Normal across all timeframes. No excess signals, no accumulation/capitulation peaks.
Multi-TF Behaviors : Horizontal consolidation with bullish dominance. Short-term bearish divergence on 2H–15min, micro-TF in correction only, no panic.
__________________________________________________________________________________
Strategic Summary
__________________________________________________________________________________
Global Bias : Solid bullish structure as long as 102k/103k hold. “Risk On” maintained by sector outperformance.
Opportunities : Entries on pullback/main base 103k–104k; breakouts to watch above 106k.
Risk Zones : Clear invalidation <102k, potential rapid flush to 97k–88k; keep strict stop-loss below 102.5k.
Macro Catalysts : FOMC, Fed projections, Middle East geopolitics keep volatility high, but no shock. Price action leads near-term strategy.
Action Plan : Swing buy on confirmed support, dynamic hedge post-news, monitor volumes/closures on key pivots.
__________________________________________________________________________________
Multi-Timeframe Analysis
__________________________________________________________________________________
1D : Bullish momentum, major supports intact (102k/105k). Risk On / Risk Off Indicator = STRONG BUY, stable volume, no excess. Healthy structure for long swings.
12H : Positive bias, range 102.6k–106k. Risk On / Risk Off Indicator = STRONG BUY.
6H : Presumed accumulation 103k–106k, momentum still strong. No volume weakness.
4H : Range oscillation, structural support test at 103k. Sector outperformance, neutral volume.
2H : First sign of short-term weakness. Divergent with higher TFs but no panic.
1H : Technical rebound towards 104.8k possible as long as 103k support holds.
30min : Short-term trend remains bearish (trend 30min = down). Correction/purge ongoing.
15min : Neutral momentum, supports being tested. No panic or melt-down observed.
Summary : Strong bullish confluence on higher TFs, temporary divergence on micro-TFs. “Range with bullish bias” scenario as long as 102k/103k holds the structure.
__________________________________________________________________________________
Macro and Fundamental Analysis
__________________________________________________________________________________
FED/FOMC (June 18) : Rates unchanged, “data dependent” guidance. Raised volatility but no risk-off shift.
Market Sentiment : BTC technical structure holds, moderate post-FOMC volatility.
S&P500 : Above all key moving averages. Sector momentum (software, uranium, semis) remains dominant.
Energy Level : Weak oil = little macro pressure against BTC.
Geopolitics : Israel–Iran escalation / US posture reinforced. High FX/oil volatility but BTC resilient (>102k), no panic on record.
Economic Calendar : Closely watching BoE & SNB, but low BTC impact odds.
Implications : Post-news phase = ideal for range trading, no rupture event expected within 48h.
__________________________________________________________________________________
Strategic synthesis & R/R guidance
__________________________________________________________________________________
Long on pullback 103–104k, swing targets 106/109k. Optimal R/R (>2.5) if stop 102.5k (D Pivot Low).
Invalidation area : Clean close <102k or heavy downside volume (capitulation via ISPD/volumes).
Risk Management : Dynamic stops, partial hedge post-FOMC during macro volatility.
Conclusion : Bullish structure preserved. Range trading scenario dominant, no extreme signals or panic. Actions: support watch, technical buy on confirmed pullback.
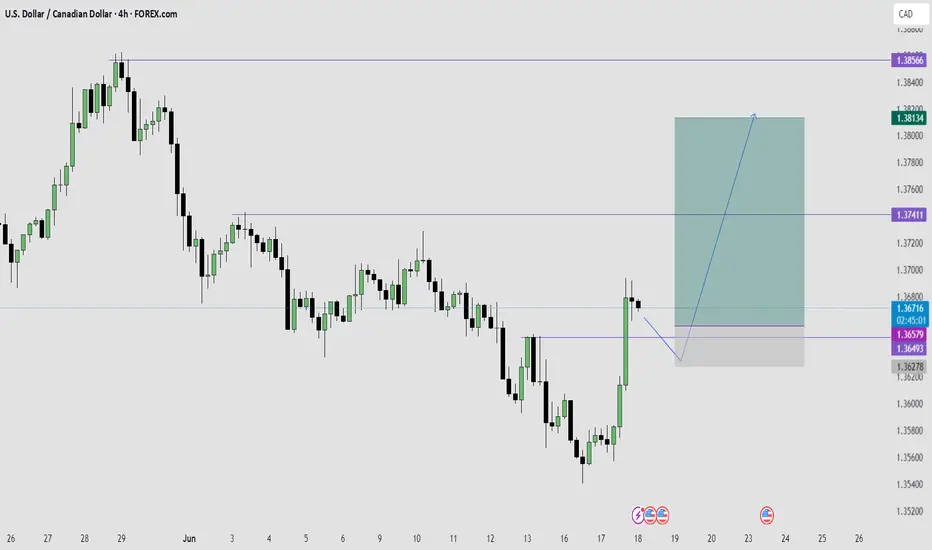
USDCAD SWING TRADE LONG IDEA - MASSIVE BULLISH MOVE COMING?OANDA:USDCAD USDCAD has given a massive bullish break of structure on 4 Hour time frame after tapping to a strong key level on weekly time frame that is serving as support.
Now am bullish on USDCAD for a weekly income swing trading moves.
All I need right now to enter for a long to ride the move is a pull back to key level of support like old highs or imbalance levels.
That is when I will take a bullish long trade on USDCAD.
This is my A+ Trading Setup.
What do you see on your chart?
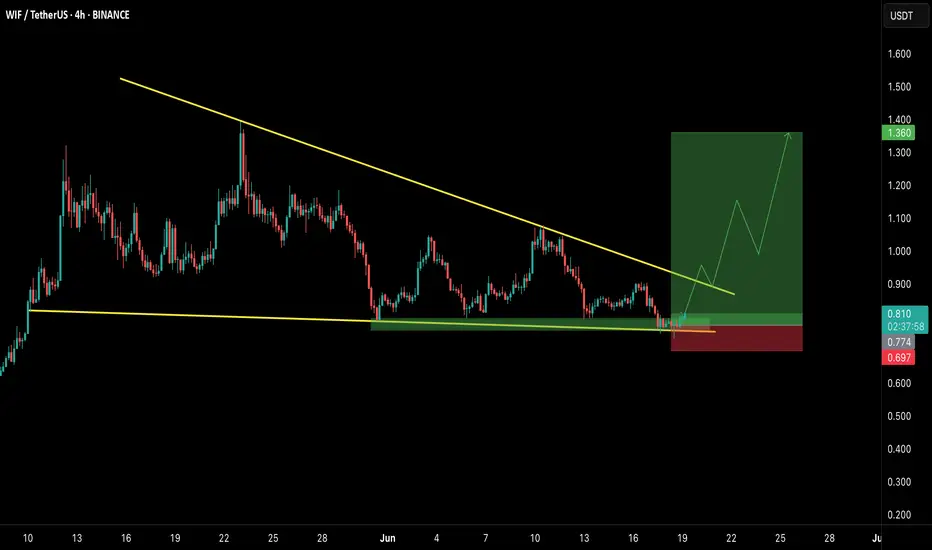
WIFUSDT Long Setup – Falling Wedge Breakout Incoming?Hey Traders — if you're into high-conviction setups with real momentum, this one’s for you.
WIF has been consolidating inside a falling wedge structure and is now showing signs of strength from the major horizontal support zone around $0.77. The structure is tightening, and the recent bounce from support could be the early signal of a breakout.
Here’s the trade idea:
Entry Zone: $0.77 – $0.81
Breakout Confirmation: 4H close above the wedge trendline (~$0.87)
Targets:
Target 1: $0.95
Target 2: $1.10
Target 3: $1.35
Invalidation / SL: Below $0.74
Risk-Reward: High (3R+ depending on entry)
Strategy:
Wait for a confirmed breakout with volume. Early entries around current support with tight SLs offer favorable setups if you’re comfortable with added risk.
Keep an eye on Bitcoin’s volatility and global macros, as they may influence alt momentum.
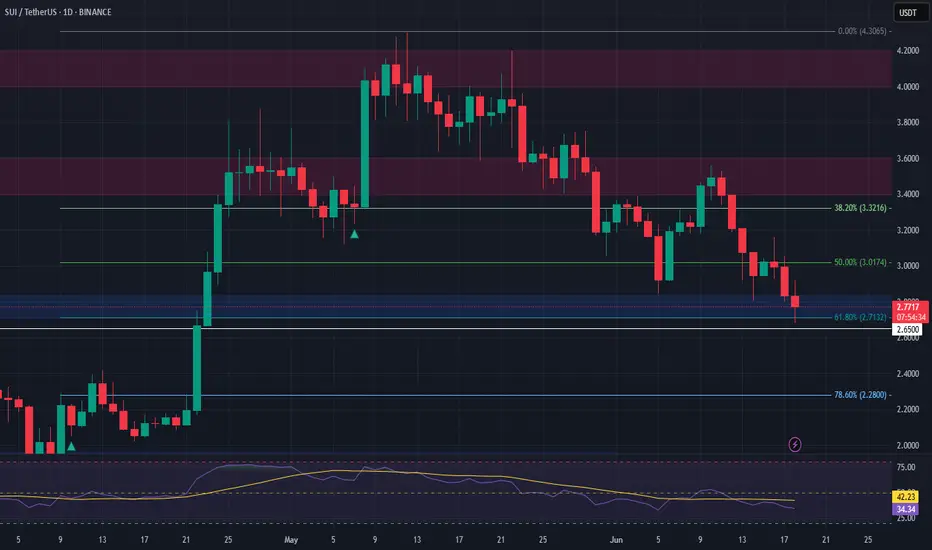
SUI Long Swing Setup – Confluence of Support and Fibonacci LevelSUI has pulled back into a key confluence zone, aligning with both the 61.8% Fibonacci retracement and horizontal support. We’re now eyeing the $2.70–$2.80 area for a potential long entry.
📌 Trade Setup:
• Entry Zone: $2.70 – $2.80
• Take Profit Targets:
o 🥇 $3.40 – $3.60
o 🥈 $4.00 – $4.20
• Stop Loss: Daily close below $2.65
DeFi Index Completes Irregular Flat Correction; Bulls Back?DeFi Index may have a completed irregular flat correction within an uptrend, which may cause another rally this year, according to Elliott wave theory.
Cryptocurrencies are recovering and DeFi Index is now bouncing back above EW channel, so a five-wave impulse into wave (C) of an irregular (A)(B)(C) flat correction in blue wave B can be finished. It means that a higher degree blue wave C can now be in play, which can rally this year all the way back to March 2024 highs. Is this the beginning of an ALTseason?
A basic bullish irregular flat correction is a three-wave (A-B-C) pattern where wave B exceeds the start of wave A and wave C dips below wave A before the overall bullish trend resumes.

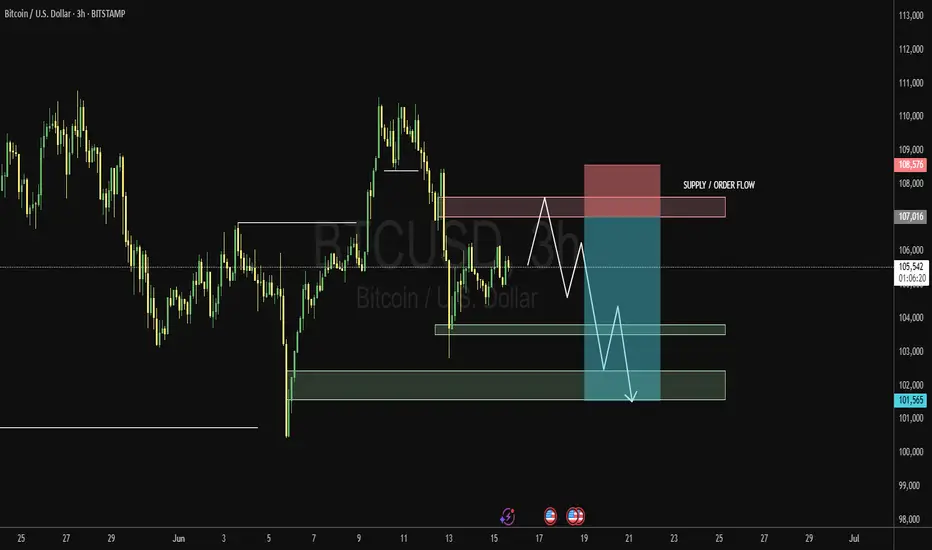
ZONE SNIPER SETUP (BEARISH)BTC/USD Supply Zone Reaction Expected...!
Current price action is retracing toward a well defined supply zone between 107,016 and 108,576, an area of previous institutional selling. The expectation is a potential rejection from this zone, leading to a continuation of the broader downtrend.
If price taps into this supply and fails to break above, short opportunities become favorable targeting:
Intermediate support at 104,000.
Final target at 101,565, aligning with prior liquidity sweep.
Invalidation occurs on a strong close above 108,576.
#BTC/USD, #FOREX, @VeloraFXReal
GBP_CAD RISKY LONG|
✅GBP_CAD is set to retest a
Strong support level below at 1.8380
After trading in a local downtrend for some time
Which makes a bullish rebound a likely scenario
With the target being a local resistance above at 1.8426
LONG🚀
✅Like and subscribe to never miss a new idea!✅
Disclosure: I am part of Trade Nation's Influencer program and receive a monthly fee for using their TradingView charts in my analysis.

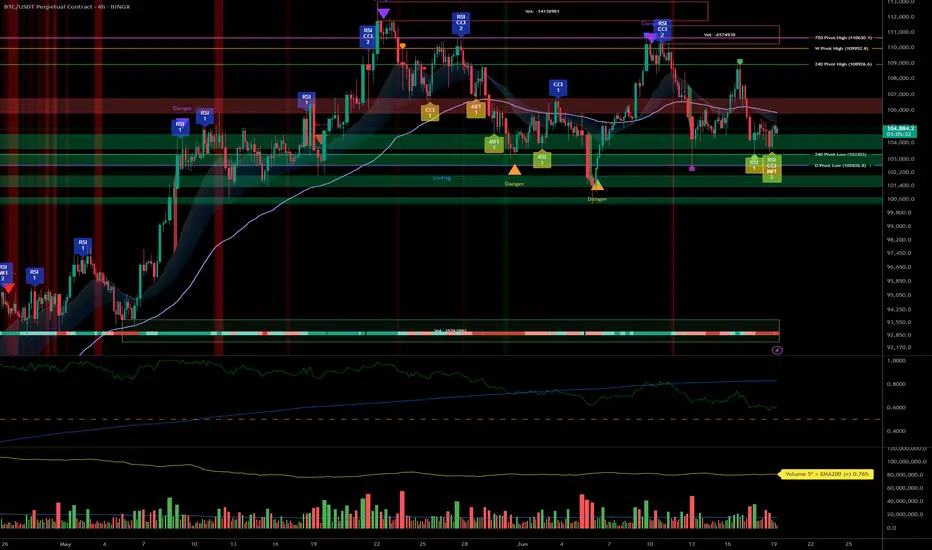
BTC/USDT: Sector Momentum and Decision Zone Ahead of the Fed__________________________________________________________________________________
Technical Overview – Summary Points
➤ Strong multi-timeframe bullish momentum, confirmed by the Risk On / Risk Off Indicator signaling “Strong Buy” across all timeframes (daily, 12H, 6H, 4H down to intraday).
➤ Major supports (102,600–104,250 $) act as the market’s anchor; the 105,800–106,100 $ resistance remains the key level to break for a confirmed further bullish leg.
➤ Volumes are weak to normal, with no recent distribution, climax, or panic/extreme behavior (ISPD DIV neutral); market remains rational.
➤ Short-term TFs (1H, 2H) are more hesitant—favoring consolidation/range, suitable for scalping or risk management rather than directional breakout trades.
__________________________________________________________________________________
Strategic Summary
➤ Dominant bullish technical context, but facing key resistance, with macro and on-chain signaling for active caution.
➤ Opportunity: Buying pullbacks on 104,250–102,600 $, targeting extension if clean breakout above 106,100 $. Partial profit-taking into the 110–111k $ highs.
➤ Risk zone: Invalidation if there is a decisive break <102,000 $ or major red volume climax on failed resistance retest.
➤ Key catalysts this week: Fed/FOMC decision, major geopolitical events.
➤ Plan: Favour methodical accumulation pre-Fed, reinforce/swing post-announcement according to technical resolution.
__________________________________________________________________________________
Multi-Timeframe Analysis
1D : Trading below broad 105,800–111,000 $ resistance, Risk On / Risk Off Indicator strongly positive, normal volumes, no euphoria (ISPD DIV neutral). Healthy structure, upward bias confirmed.
12H/6H : Consolidation at major support; recent rebounds from 102–104k, no exhaustion signals. MTFTI Up but 2H-1H corrective divergence.
4H/2H : Range market, major supports defended, no breakout yet. MTFTI locally Down, indicating mild internal corrective dynamic.
1H/30min/15min : Intraday range, technical micro-bounces, weak directional bias, moderate volumes, no abnormal behavior. Scalping preferred below resistance, rigorous risk management.
Risk On / Risk Off Indicator : Strong aligned buy signal across all TFs, sector environment supportive.
__________________________________________________________________________________
Multi-Timeframe Key Points Summary
Strong bullish market, behavioral and technical stability.
Breakout >106,100 $ = legitimate bullish extension, 110k+ target.
Invalidation below 102k $: go to cash, wait for stabilization.
Volatility expected around (Fed/geopolitical) events: adjust sizing/stops accordingly.
__________________________________________________________________________________
Fundamental, Macro & On-Chain Analysis
Fed (FOMC June 17–18): Major breakout/volatility catalyst.
Geopolitical tensions (Israel/Iran): Risk-off spikes expected, watch liquidity zones.
On-chain: Key support at 100–102k $; no major distribution, long-term holders remain strong, options/futures point to underpriced volatility risk.
Strategy: Prefer gradual accumulation on supports, reduce exposure pre-Fed, confirm new swings post-FOMC.
__________________________________________________________________________________
Action Plan Summary
Accumulate on pullback 104,250–102,600 $, stop below 101,900 $.
Breakout >106,100 $: Target 110k–111k $, partial TP, monitor volume/volatility.
Avoid overtrading pre-FOMC or amid major geopolitical news.
Risk/Reward >2 on pullback – strict management mandatory.
__________________________________________________________________________________
Conclusion & Context Mastery
The market remains structurally bullish and supported by the combination of technical, sector and on-chain factors. However, macro/geopolitical volatility requires increased caution as the FOMC approaches. Focus on support entries, avoid chasing resistance until confirmed, and apply tight stops in this catalyst-rich context.
__________________________________________________________________________________
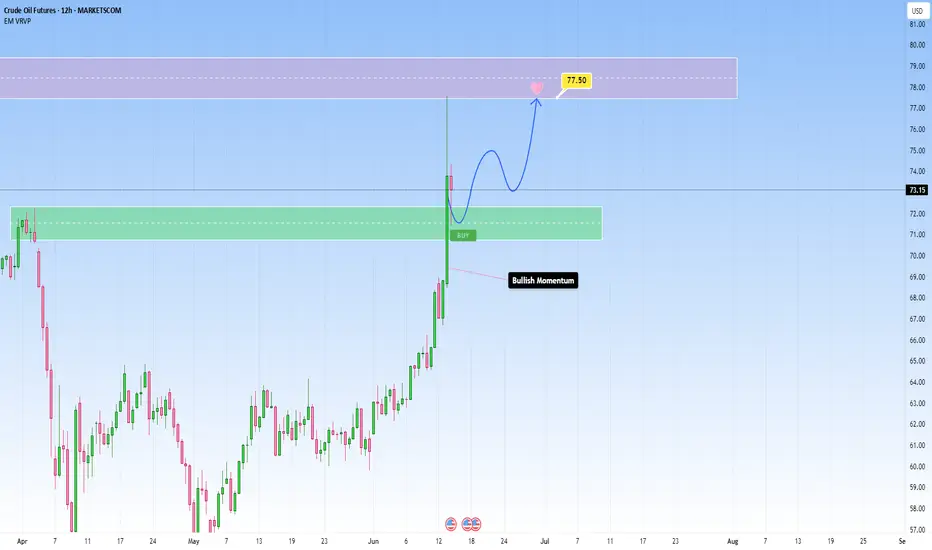
Positive market: OIL rises sharply - Important area to watch forThe recent escalation of tensions in the Middle East has had a strong ripple effect across all commodities market. Just as we observed with Gold, it’s no surprise we’ve seen oil prices climb as well, given this uncertainty.
If you’ve seen my latest Gold analysis, you’ll understand how market sentiment has turned uneasy, and in times like these are what people trust when everything else feels risky. And naturally, with everything going on, Gold is seeing stronger demand again, and I expect the price to steadily climb and reach new highs because the momentum is unmistakable.
On Friday the 13th, oil prices spiked abruptly before pulling back slightly, showing just how sensitive the market is to potential supply disruptions. What’s fueling this rally is obvious, and it’s the fear around supply from such an important oil-producing area. This creates a great opportunity to take a position.
As you can see in my analysis, the price has recently broken above a key resistance zone and may come back for a retest. If this level holds as support, it would really confirm the bullish bias and make the move towards my anticipated target of 77,50 high probability, towards the next resistance zone level at 77,50 and 79,50.
If the price remains over this support zone, my bullish outlook stays the same. But, if it doesn’t hold above this level we could see a slight pullback before another definitve move up.
In such times, it’s important to watch price action closely especially near key technical levels, and let the market show your next move.
USDJPY Long potential setupWhat's going on?
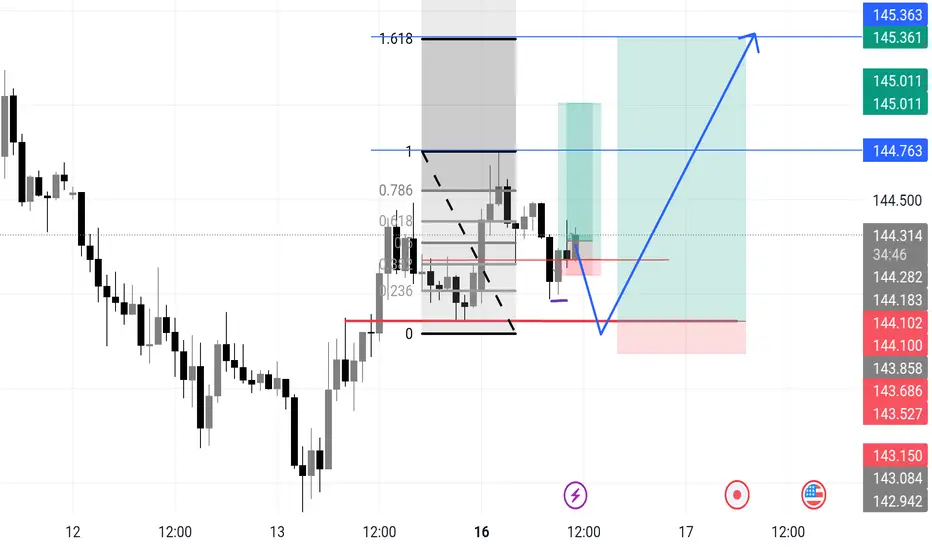
USDJPY – Reload Zone Marked. If They Take Me Out, I’ll Be Waiting Lower.
Discipline means you don’t chase. You wait where the market must return.
Currently in 2 buys, one is an added position, then I moved my stop in from the purple line— but if those get wicked out, I’m hunting the next key demand zone just beneath 144.10. Where we'll have a textbook spring setup!
🧠 What I See:
We're forming a potential micro accumulation structure.
If the current position gets taken out, I’ll reload lower at the spring aligned with the prior reaction low + liquidity sweep zone.
🎯 Next Area of Interest:
Zone: 144.00 – 144.10
📌 Target Remains:
144.76 → 145.36
1.618 extension aligns with supply inefficiencies & range completion
---
> “Stop loss isn’t failure. It’s recon. The second entry — that’s where pros feast.”
I’m not trading emotion. I’m trading plan + precision + execution.
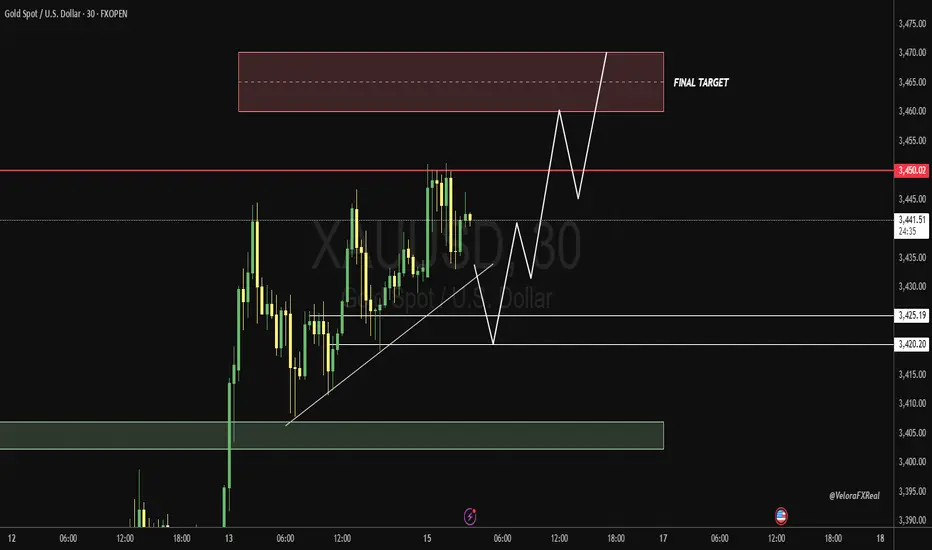
Gold Analysis (Bullish Bias)Gold continues to show strong bullish momentum, supported by key technical levels and favorable market structure. Price action remains constructive above the major support zone, indicating potential for further upside.
I'm closely monitoring the following levels for a high-probability long setup:
Demand Zone / Support Level:
Entry key level: 3426 - 3420
As long as gold holds above this support, the bias remains bullish with potential for a continuation toward higher resistance levels. A break and sustained move above the entry zone would confirm bullish strength and could trigger the next leg up.
Risk management remains key waiting for clear confirmation before entering is advised.
#GOLD, #FOREX , # @VeloraFXReal