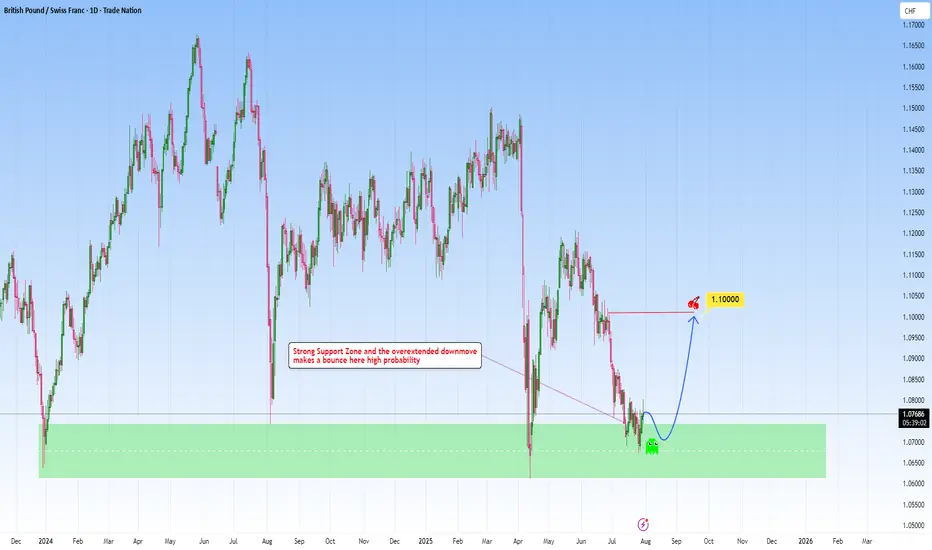
GBPCHF meets strong support: A reversal here is high probabilityLooking at GBPCHF and how it fits within my approach to structure-based trading, this one is really speaking my language.
Price has come down into a key higher-timeframe support zone: a zone that’s proven itself multiple times in the past. Now, price has shown some initial rejection there, making my long position towards 1.1000 a clear, rational target.
What makes this setup different could be the patience behind it. As we let the market complete its downward leg, waited for price to revisit a reliable zone, and now anticipating a bounce back. It’s a move that I’ve captured across my previous charts again and again.
Let me know in the comments what you think
Disclosure: I am part of Trade Nation's Influencer program and receive a monthly fee for using their TradingView charts in my analysis.
Support_and_resistance
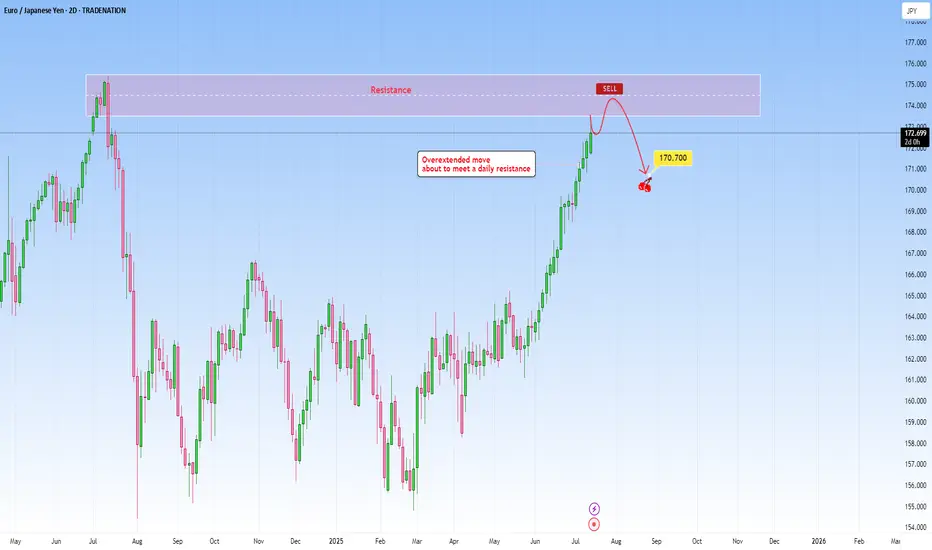
EURJPY: Overextended move to meet daily resistanceThe current market context on EURJPY shows an overextended move that has been pushing higher as price is about to reach a well-established daily resistance. The rally into this resistance lacks healthy retracements, and momentum is likely unsustainable without a deeper correction. The probability of a pause or reversal here under this circumstances increases substantially.
This extension exaggerates this imbalance making it a high probability setup. Volume and price action near this level becomes critical in this case. Signs such as long upper wicks, bearish engulfing patterns will hint that the move may be running out of steam.
I would be targeting a decent pullback towards 170.700.
Just sharing my thoughts for the charts, this isn’t financial advice. Always confirm your setups and manage your risk properly.
Disclosure: I am part of Trade Nation's Influencer program and receive a monthly fee for using their TradingView charts in my analysis.
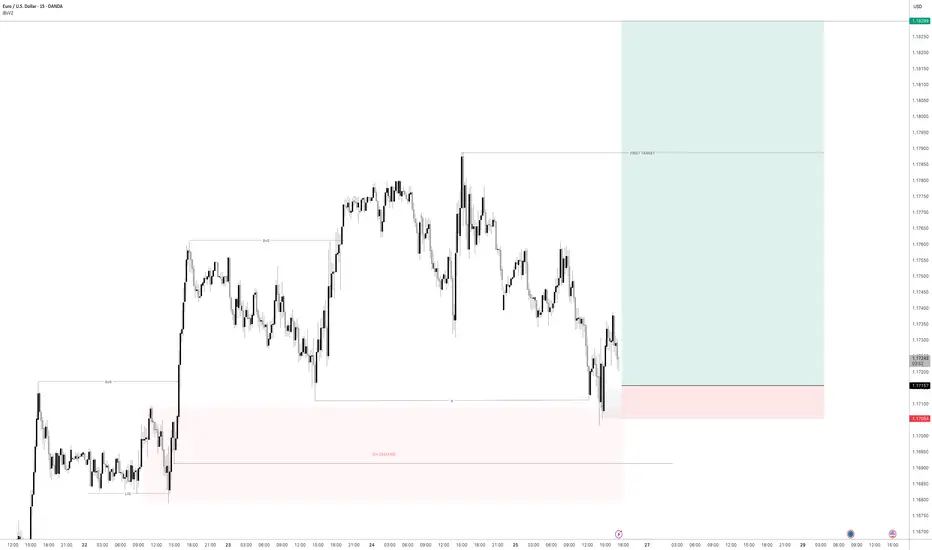
EURUSD - Next Buy Zone? This one has some nice potential
We will see how it plays out if we get tagged in
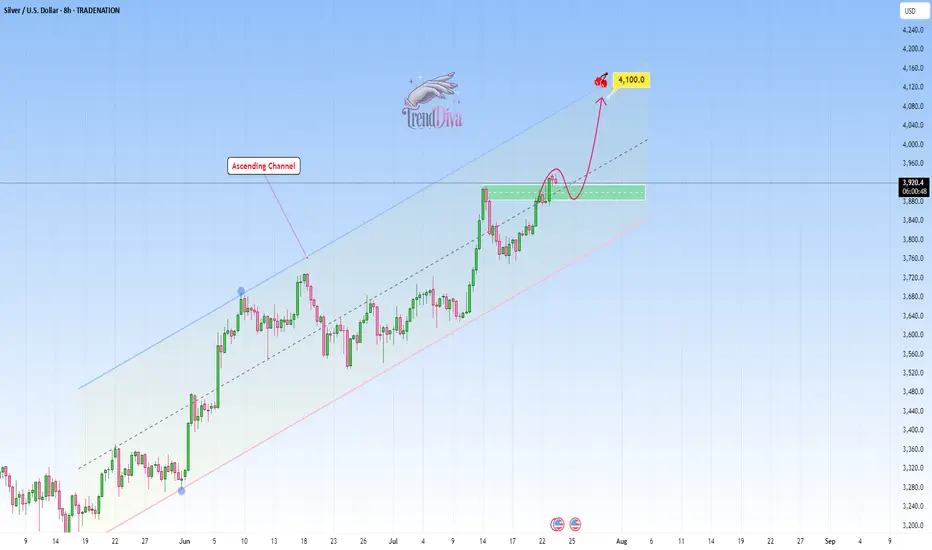
SILVER Analysis - Can buyers push toward 4,100$?TRADENATION:XAGUSD is trading within a clear ascending channel, with price action consistently respecting both the upper and lower boundaries. The recent bullish momentum indicates that buyers are in control, suggesting there's chances for potential continuation on the upside.
The price has recently broken above a key resistance zone and now came back for a retest. If this level holds as support, it would reinforce the bullish structure and increase the likelihood of a move toward the 4,100 target, which aligns with the channel’s upper boundary.
As long as the price remains above this support zone, the bullish outlook stays intact. However, a failure to hold above this level could invalidate the bullish scenario and increase the likelihood of a deeper pullback.
Remember, always confirm your setups and use proper risk management.
Disclosure: I am part of Trade Nation's Influencer program and receive a monthly fee for using their TradingView charts in my analysis.
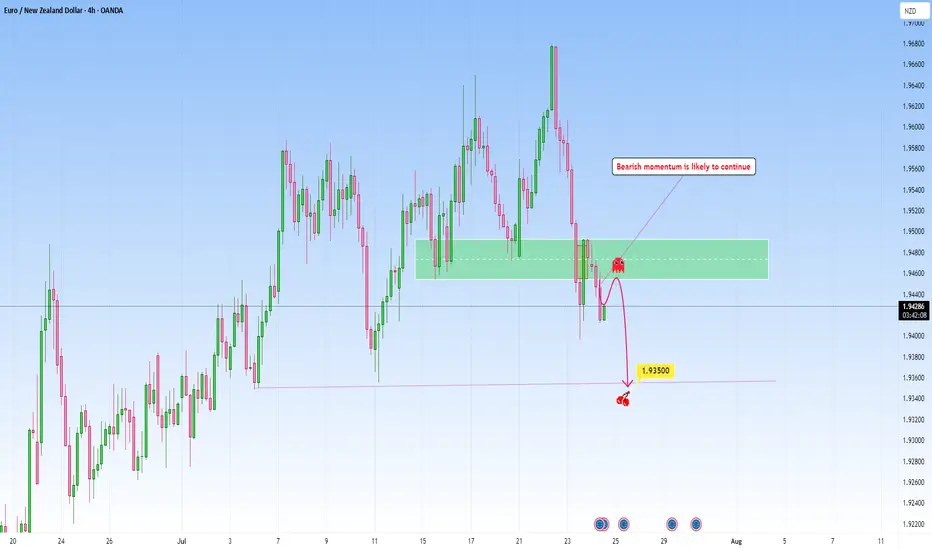
EURNZD Continuation setup following recent bearish momentumThe market has recently pushed down with momentum.
Price attempted a timid "echo bounce" back into the broken support but was rejected, confirming this area now serves as area for bearish re-entries.
From what I can tell, we're entering the next leg of what I call the “Gravity Spiral Phase”, where sellers take over after taking a clear zone. Each wave down is not just a move, but a continuation of momentum migration into new bearish move.
Target: 1.93500
This level marks the next gravity anchor, a zone where price memory may attempt to stabilize, but only temporarily.
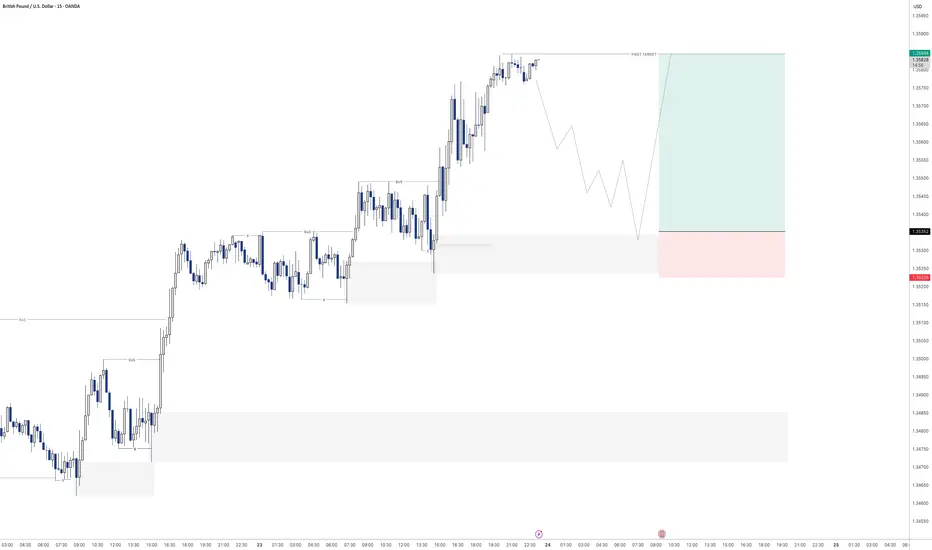
GBPUSD - Next buy from demandLooking here for potential further buying momentum to the upside.
Will see how this plays out tomorrow
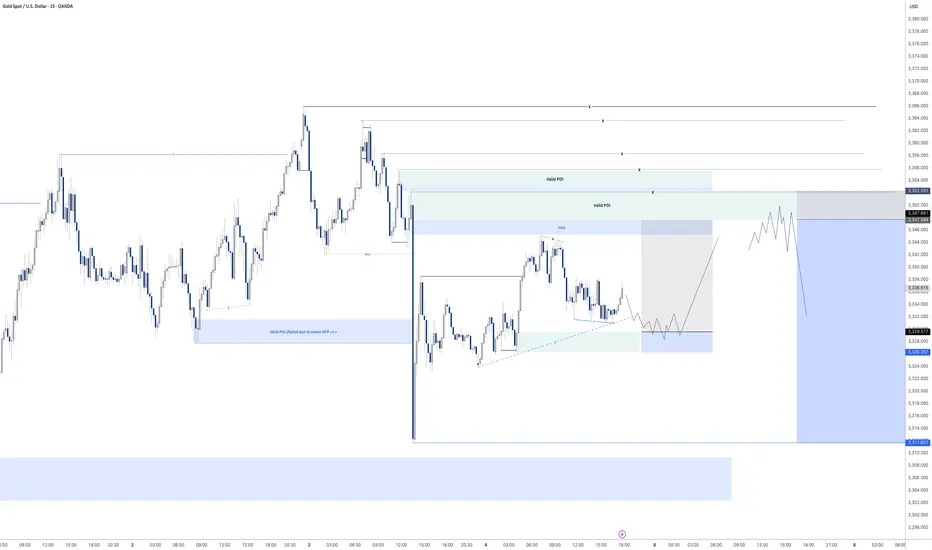
XAU/USD Intraday Plan | Support & Resistance to WatchGold has continued its rally, breaking through the 3,416 resistance and pushing into the next upside zone.
Price is now trading around 3,421, just below the 3,440 resistance cluster.
The structure remains bullish with price holding firmly above both the 50MA and 200MA, which are acting as dynamic support.
A confirmed break and hold above 3,440 would open the path toward 3,458 and potentially the higher‑timeframe target at 3,478 if momentum extends.
If price fails to sustain above 3,416–3,440 and begins to fade, watch the initial pullback toward 3,400.
A deeper move below that would shift focus to 3,383 - 3,362 and then the Pullback Support Zone.
Failure to hold there could expose price to the lower Support Zone if bearish pressure builds.
📌 Key Levels to Watch
Resistance:
‣ 3,440
‣ 3,458
‣ 3,478
Support:
‣ 3,416
‣ 3,400
‣ 3,383
‣ 3,362
‣ 3,336
🔎 Fundamental Focus
⚠️Not much on the calendar today. Still, manage your risk and stay prepared for any unexpected volatility.

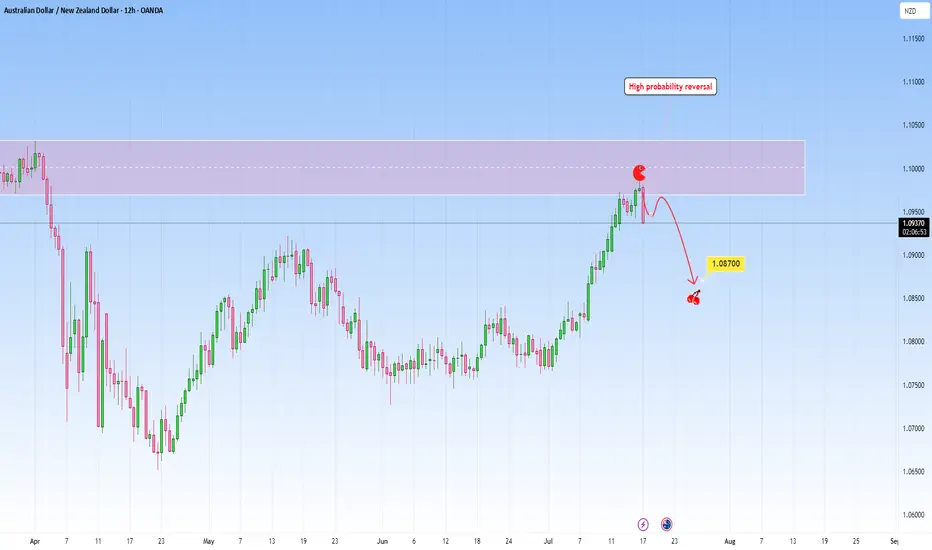
AUDNZD: Ongoing Reversal from ResistanceI am watching for a reversal on AUDNZD as marked on my chart, expecting a reversal with a downside target at around 1.08700.
This is a high probability setup taken into account the overextended upside move to this resistance zone.
Just sharing my thoughts for the charts, this isn’t financial advice. Always confirm your setups and manage your risk properly.
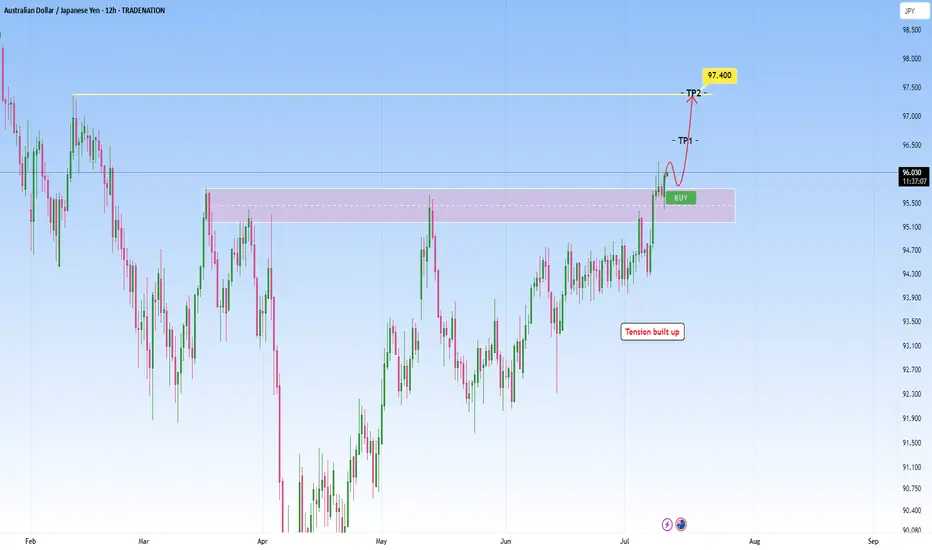
AUDJPY Technical Breakout - Targeting 97.400 Next?TRADENATION:AUDJPY has recently broken decisively above a key resistance zone that had previously capped price for several months. This breakout was preceded by a period of compression and range-bound price action, where bullish momentum steadily built up, indicated by higher lows pressing against the resistance level. This type of structure typically leads to an explosive breakout, which we are now seeing unfold.
After the breakout, price came back for a clean retest of the broken resistance zone, which has now flipped into support. The retest held firmly, suggesting strong buyer interest at this level and confirming the validity of the breakout.
With this structure in place, the bullish momentum is likely to extend further toward the next target zone around 97.400, provided price remains above the current support.
As long as the price holds above the retested zone, the bullish outlook remains intact. A breakdown back below this area, however, would be a warning sign and could open the door to a deeper pullback.
Remember, always wait for confirmation before entering trades, and maintain disciplined risk management.
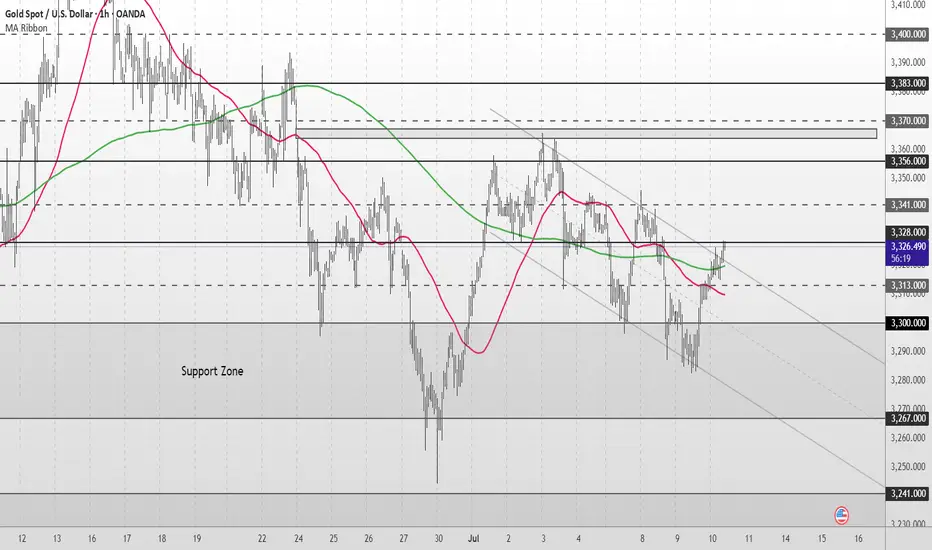
Gold Short Term OutlookGold continues its short-term recovery after bouncing from the Support Zone and reclaiming the $3,300 level. Price is now testing the $3,328 resistance zone, with both the 50MA and 200MA converging just below price.
A confirmed break and hold above $3,328 would open the door to higher resistance levels. However, failure to clear this zone could lead to a retest of the Support Zone. If that fails to hold, a deeper retracement toward the HTF Support Zone may follow.
📌 Key Levels to Watch
Resistance:
‣ $3,328
‣ $3,341
‣ $3,356
‣ $3,383
Support:
‣ $3,313
‣ $3,300
‣ $3,267
‣ $3,241
🔎 Fundamental Focus
All eyes on U.S. unemployment claims today
Expect volatility around the release – stay sharp.
GOLD - POTENTIALLooking at gold. Its still in a bit of limbo after the NFP reaction on Friday. However it is looking like the draw on liquidity is higher. Therefore my bias on gold for the start of the week is bullish so will be looking to get the most optimal entry to take some buys to the upside.
If we can manage to find a decent enough move price really could rally upwards.
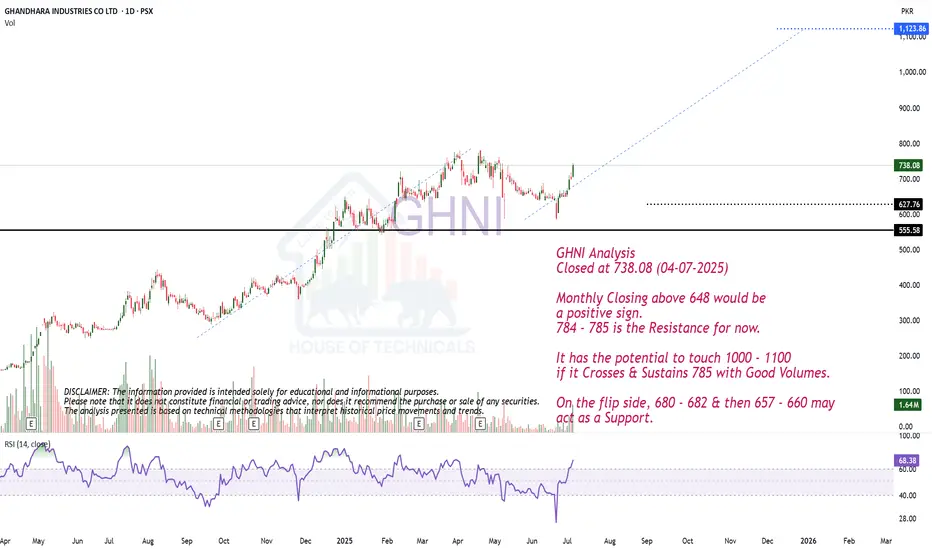
ABCD PatternGHNI Analysis
Closed at 738.08 (04-07-2025)
Monthly Closing above 648 would be
a positive sign.
784 - 785 is the Resistance for now.
It has the potential to touch 1000 - 1100
if it Crosses & Sustains 785 with Good Volumes.
On the flip side, 680 - 682 & then 657 - 660 may
act as a Support.
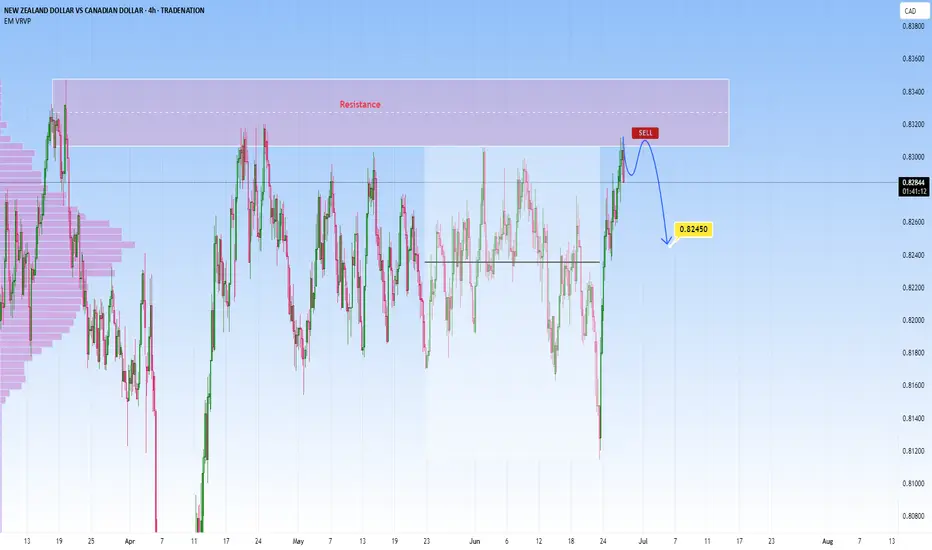
NZDCAD reached key resistance: Rebound to 0.82450 likelyPrice on NZDCAD has reached a pretty significant resistance level, that has been a key turning point in the past, with several strong reversals from the area. So naturally, I’ve been watching to see how price reacts here again.
We can already see early signs of rejection, so I will monitor this pair and I’ll be looking for short setups from the zone again.
🟥 My sell idea is based on the expectation that this resistance will hold. I would be targeting a move down toward the 0.82450 level , which I feel is a realistic target before any reversal could take from the gains, especially if price respects this structure continuously.
But if price breaks above and starts holding strong above the zone, then I’ll back off the bearish bias and reassess, and I’d consider the bearish idea invalidated, with potential for further upside.
Just sharing how I see the chart right now, not financial advice
Gold Short Term OutlookYesterday, we noted that gold was attempting a recovery from the Support Zone but remained below both the 50 and 200 MAs, meaning bearish pressure was still intact.
Since then, price has broken and held above $3,298, and is now trading around $3,330, just beneath the 200MA.
This marks a shift in short-term momentum — gold has reclaimed the 50MA and is now challenging the 200MA.
If bulls manage to break and hold above the $3,327 resistance, it could open the path toward $3,352 - $3,364 and potentially higher resistance zones.
However, if price rejects the 200MA and fails to hold above $3,327, we may see a pullback toward $3,298 or deeper into $3,270, where bulls could look to reload.
📌 Key Levels to Watch:
Resistance:
$3,327 • $3,364 • $3,383 • $3,400
Support:
$3,298 • $3,270 • $3,241
🧠 Fundamental Focus:
📌 Fed Chair Powell speaks today at the ECB Forum in Portugal.
Markets will closely watch for any shift in tone on inflation or rate outlook. His comments may influence USD direction and gold volatility.
📌 ISM Manufacturing PMI – a key gauge of economic activity. A strong print may pressure gold; a weak reading could support it.
📌 JOLTS Job Openings – offers insight into labor market strength. A tighter market could delay rate cuts and weigh on gold.
With multiple risk events packed into today, expect increased volatility across the board.

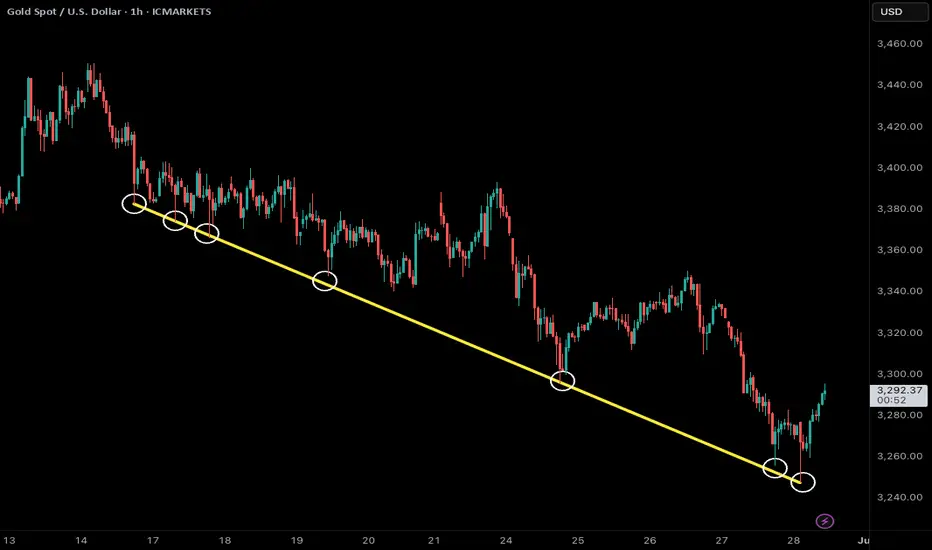
golden trend linegold price peaked on intraday h1 chart on 3450 level despite shocking war news
opposite to crowd consensus price came down last two week until crowd give up buying war news
but price was falling like text book from trend line
test bounce then new lower low
(price now testing h4 support 3245)
EURUSD heads towards resistance, short-term reversal expectedEURUSD has been in a strong uptrend, and we’re currently observing price action is reaching a notable resistance zone. I am watching for a reversal here as marked on my chart, not expecting a major move, but rather a short-term rejection with a downside target at around 1.13670 , which also aligns with the POC.
This is where it can become a decision point, either price finds support and bounces, or it breaks below, and that’s when we might see the move start to extend lower.
If we get a decisive breakdown through that ascending trendline, my next area of interest is marked as TP2. From there we can expect either potential accumulation or another reaction, depending on broader market sentiment at the time.
That said, we're navigating a complex backdrop currently:
The EU macro environment is under pressure, as weak economic data from Europe is contributing to cautious sentiment around the euro.
Meanwhile, a sustained USD bid continues, supported by stronger U.S. growth expectations, favorable yields, and persistent global demand. This further weighs on EURUSD.
Adding to the uncertainty, escalating tensions between Israel and Iran have rattled markets this week. This geopolitical risk could be pushing oil prices higher:
It’s important to note that if price convincingly rejects here and loses structure, especially with high volume and obvious bullish structure, this setup would become invalid. In that case, I would reassess and adapt

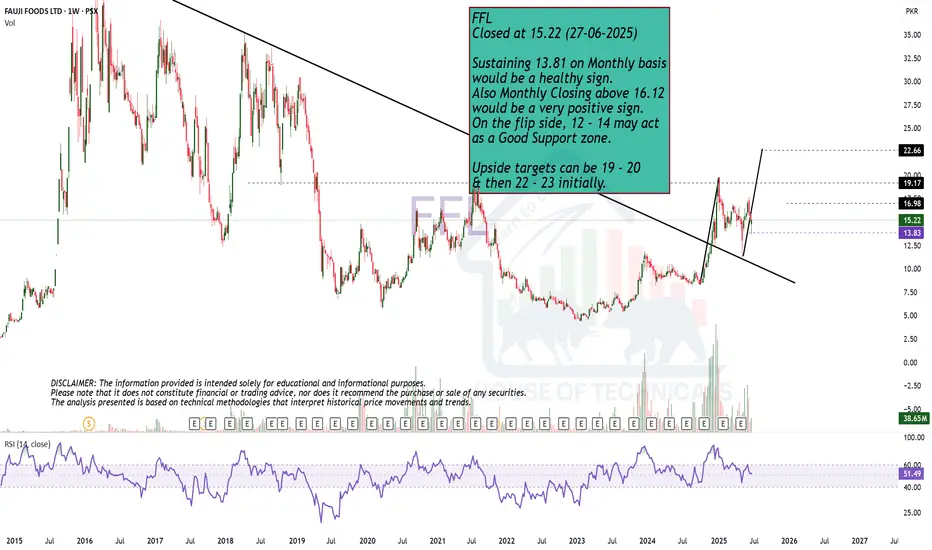
Strong Stock!FFL
Closed at 15.22 (27-06-2025)
Sustaining 13.81 on Monthly basis
would be a healthy sign.
Also Monthly Closing above 16.12
would be a very positive sign.
On the flip side, 12 - 14 may act
as a Good Support zone.
Upside targets can be 19 - 20
& then 22 - 23 initially.
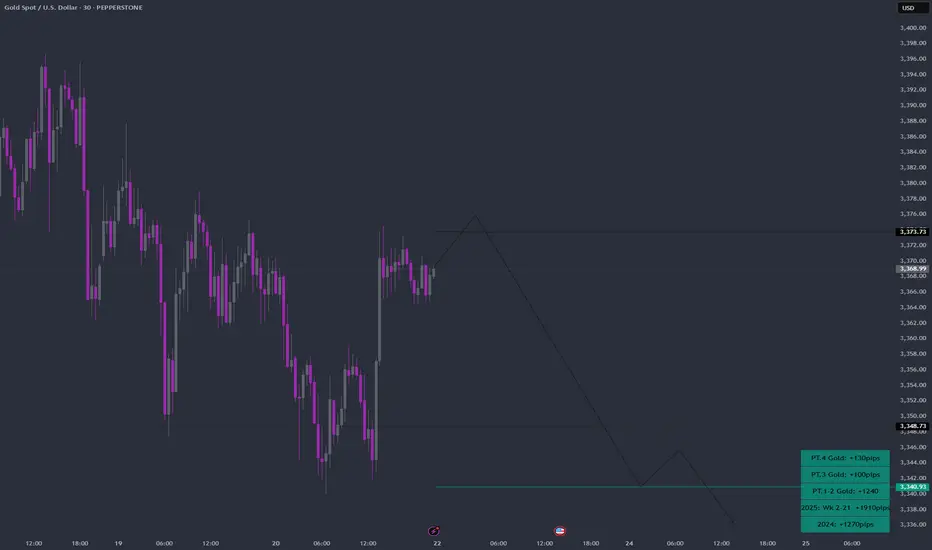
Everybody loves Gold Part 5Keeping it steady and reasonable
Part 5 weekly path is as shown.
Here's a breakdown of trading dynamics:
1. Expecting price to break past green line, level of significance (LOS) for continuation down
2. Price might bounce back for which; will be looking for a continuation from +50/+100 or +150pips to the downside
3. Will be looking for double tops/bottom along the way: Last week saw classic double top formed around level of significance (LOS)
As always price action determines trades
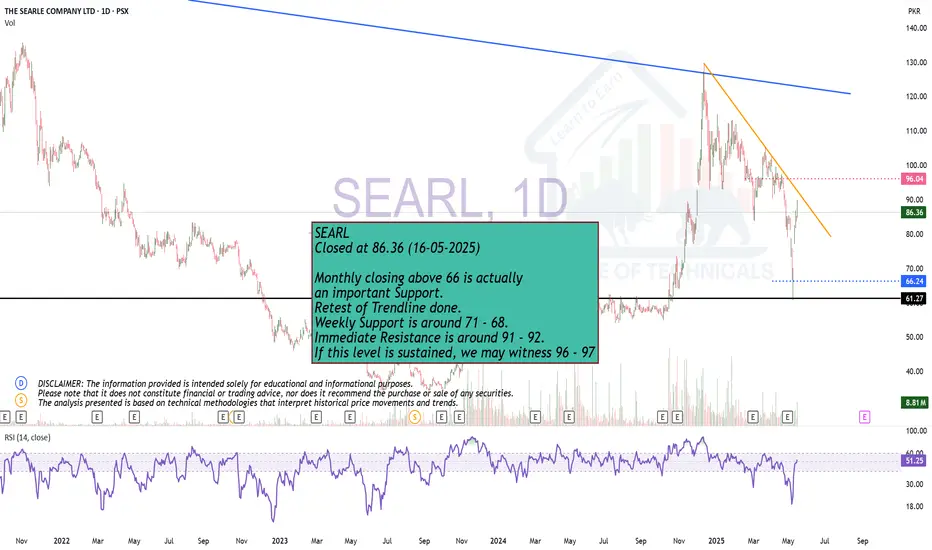
Play on levelsMonthly closing above 66 is actually
an important Support.
Retest of Trendline done.
Weekly Support is around 71 - 68.
Immediate Resistance is around 91 - 92.
If this level is sustained, we may witness 96 - 97
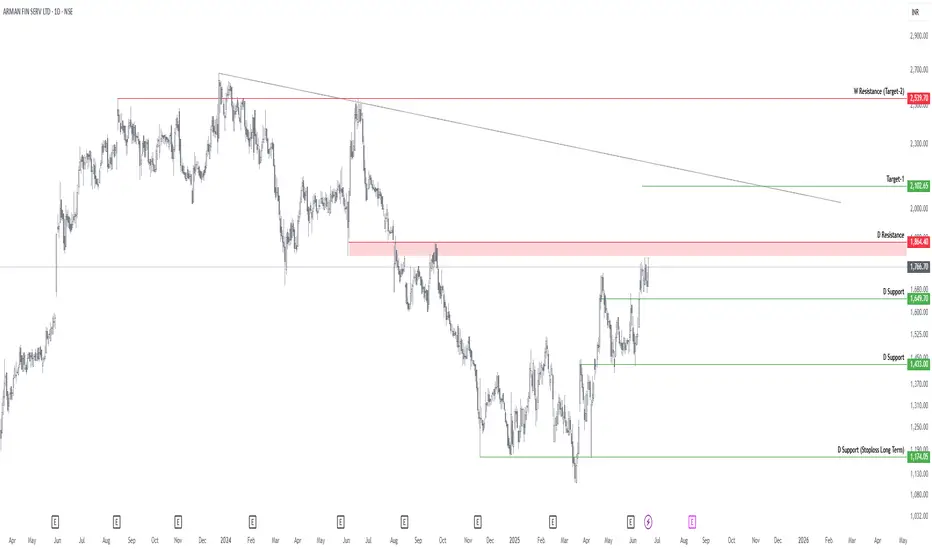
ARMANFIN Long IdeaARMANFIN chart looks strong. It is in uptrend and going towards ATH.
Supports and Targets are given in Chart.
Risk management is Important.
pro's : Repo Rate fallen down. Overall MFI space is better than previous quarters.
Con's : ArmanFinancial has no growth guidnace for FY26. They are in Asset Quality management currently.
Long ConsolidationBNWM Analysis
Closed at 63.48 (18-06-2025)
Long Consolidation of 9 - 10 years almost.
Now either wait for Breakout above 69; or
Wait for a Good Support around 35 - 43.
Once 69 is Crossed & Sustained with Good
Volumes, we may witness 100+

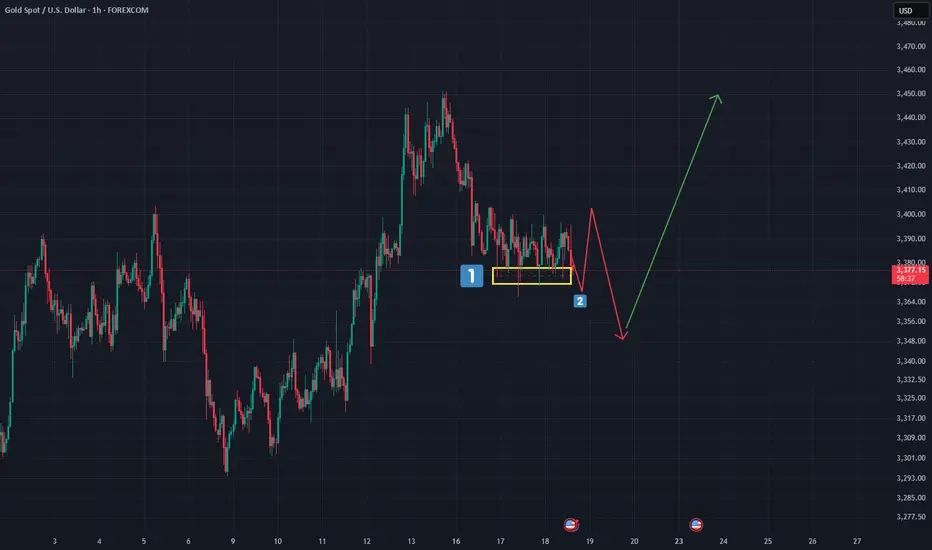
Gold’s in a Trap — And That’s Exactly Why You Should Be CarefulGold is stuck in a tight sideways range. It’s been bouncing between $3,370–$3,380 for two days now. Everyone sees it. Every trader watching gold knows this level acted as support — and judging by the candle shadows, buyers are getting aggressive here.
So if you're purely technical — yeah, looks like a solid buy right now.
But here’s the twist…
___________________________________________________________
I’m not buying.
And I’ll tell you why — because it's too obvious.
When something screams "buy" from every chart and every textbook, that’s when you pause and ask yourself:
“Am I about to walk into a classic setup… or actually catch a real move?”
Because history shows us — these textbook setups often play out like this:
Motivation → Encouragement → Payback. (See Chart 2)
It goes like this:
Price breaks a visible high or low (Motivation)
Traders jump in and get some pips(Encouragement)
Then — brutal reversal (Payback)
Only then will everything get off the ground, and it will be fast, so that the "unnecessary" passengers who were "dropped off" should not have time to return to this train. So why are they "unwanted"? Well, here's one possible answer: because retail tends to hold losing trades too long , but gets spooked early on winners. We’re wired that way.
So what happens when everyone starts booking profits after a small bounce?
You get limit sell orders piling up , slowing momentum — sometimes even flipping the trend.
And then what do big players do?
Then come back in — buying at higher levels, averaging their positions. Not the best case scenario....
Key Takeaway:
______________________
Here’s my advice — especially if you’re in this game long-term:
1. Avoid those super obvious setups everyone else is jumping into.
2. Instead of asking, "Why should I open a trade now?"
Try asking: "Why shouldn’t I open a trade now?"
p.s.
If you liked this kind of deep-dive — follow along. We don’t just read charts. We read the market behind them.
Conclusion:
_________________________
📍 Gold is testing a key zone — but don’t let the crowd pull you in.
🧠 The first quick impulse is often a trap
📈 Stay sharp, stay ahead.
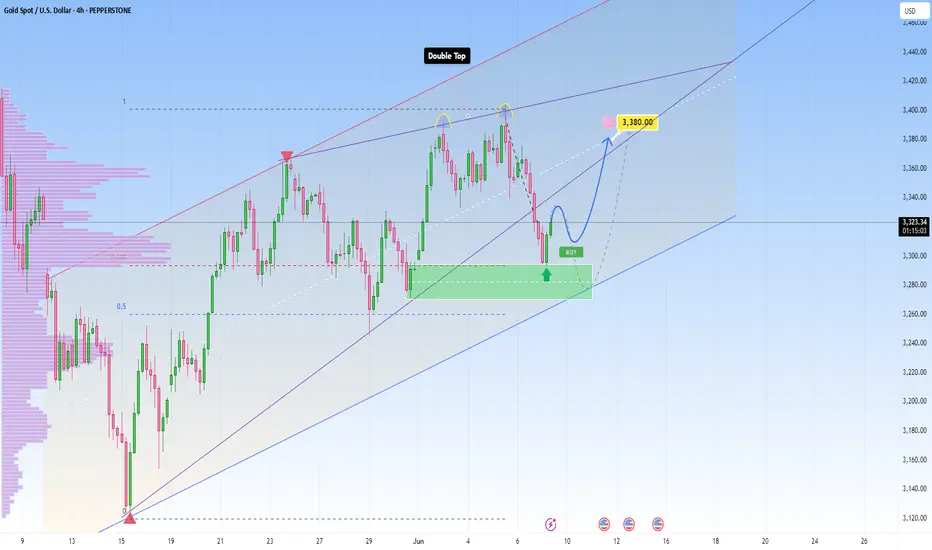
Gold’s back on track, paying attention to momentum and hintsXAUUSD is still climbing steadily within its upward parallel channel, respecting structure beautifully as we’re now seeing early signs of bullish interest returning, right after we got a nice rejection from the support zone.
Currently I’m watching this bounce to have a target near 3,380 , somewhere around the middle line of the ascending channel. If this bullish push continues with strong volume and momentum, I’ll be locking in that bias and planning my entry accordingly.
Patience first, I always wait for price to prove itself before getting involved.
This could be a beautiful continuation…
Or just one more fakeout before a deeper drop.