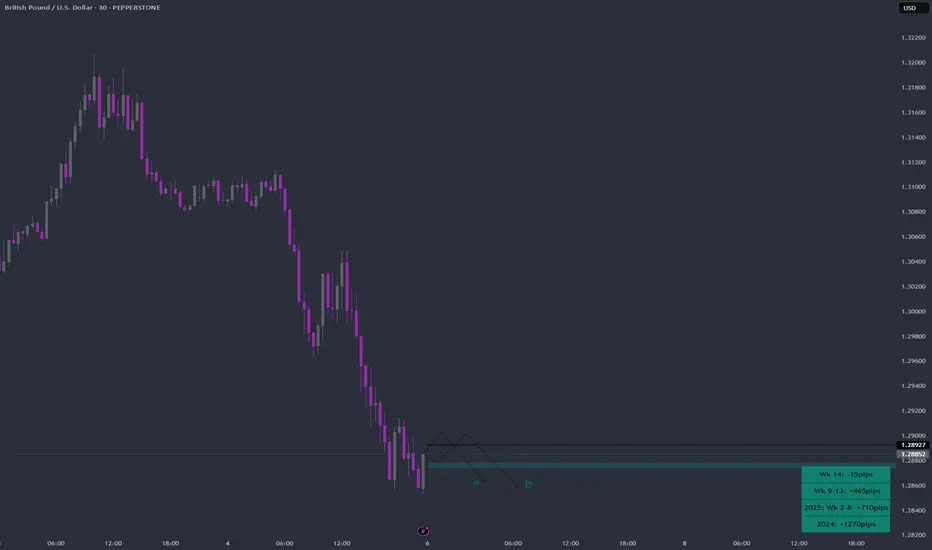
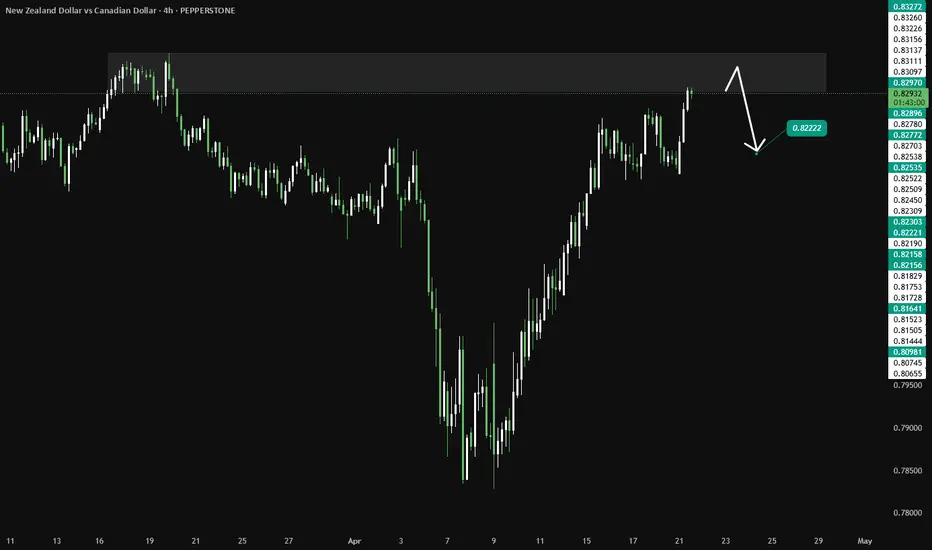
NZDCAD at Key Resistance Level: Will it Drop To 0.81608?OANDA:NZDCAD is approaching a key resistance level that has previously acted as a strong barrier, triggering bearish momentum in the past. This zone also aligns with prior supply areas where sellers have stepped in, making it a potential point of interest for those looking for short opportunities. Given its historical significance, how price reacts here could set the tone for the next move.
If bearish signals emerge, such as rejection wicks, bearish candlestick patterns, or signs of weakening bullish pressure, I anticipate a move toward the 0.81608 level. However, a clear breakout above this resistance could challenge the bearish outlook and open the door for further upside. It's a pivotal area where price action will likely provide clearer clues on the next direction.
Just my take on support and resistance zones, not financial advice. Always confirm your setups and trade with a proper risk management.
Best of luck!
Support_and_resistance

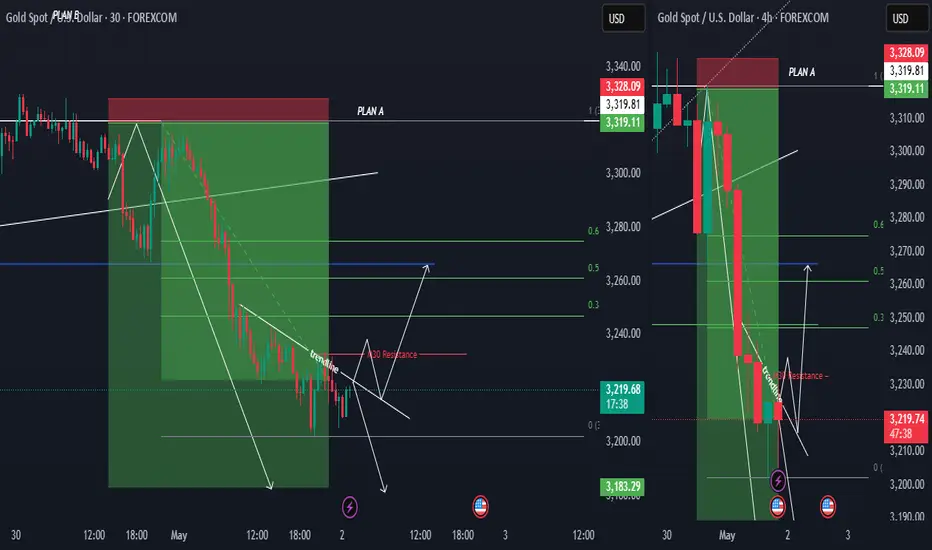
XAUUSD UPDATEHi all
The rejection at the 3202 level, Plan A remains a strong possibility, especially if the trendline also shows signs of resistance. However, if the trendline breaks, then Plan B would be the preferred approach—waiting for a confirmed breakout on the 30-minute timeframe before considering a long position.
Keep a close watch on price action and ensure strong confirmation before making any moves. Feel free to share any updates or additional insights. Wishing you success in trading!
good luck all
**My trading strategy is not intended to be a signal. It's a process of learning about market structure and sharpening my trading my skills also for my trade journal**
Thanks a lot for your support
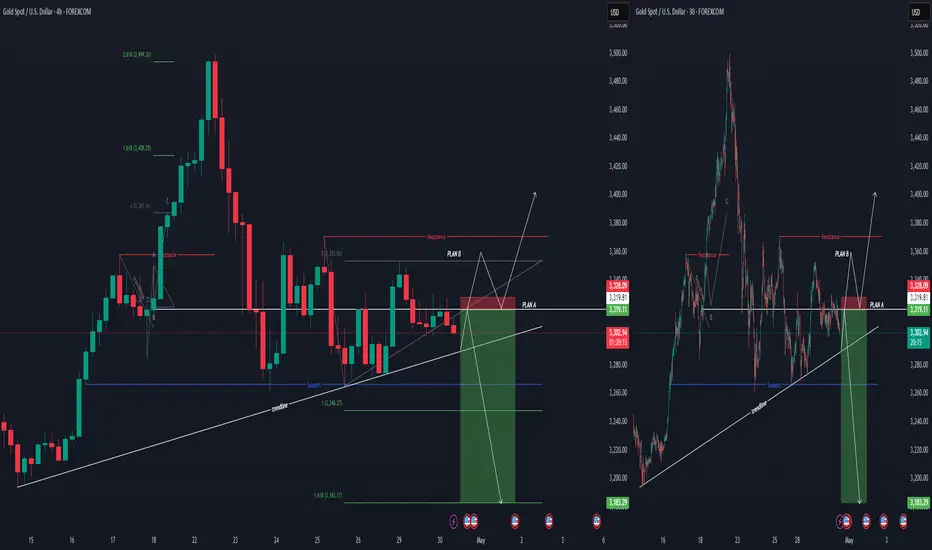
XAUUSD TRADE IDEA
Hi everyone,
here is my gold price movement forecast. My forecast tends to lean towards temporary strength for gold. Therefore, if there is a rejection at the trendline on the H4, I will wait for the price to come back to 3320 before shorting gold... If the price successfully breaks the entry price and makes a new high, I will look for opportunities to long towards 3402.
good luck all
**My trading strategy is not intended to be a signal. It's a process of learning about market structure and sharpening my trading my skills also for my trade journal**
Thanks a lot for your support
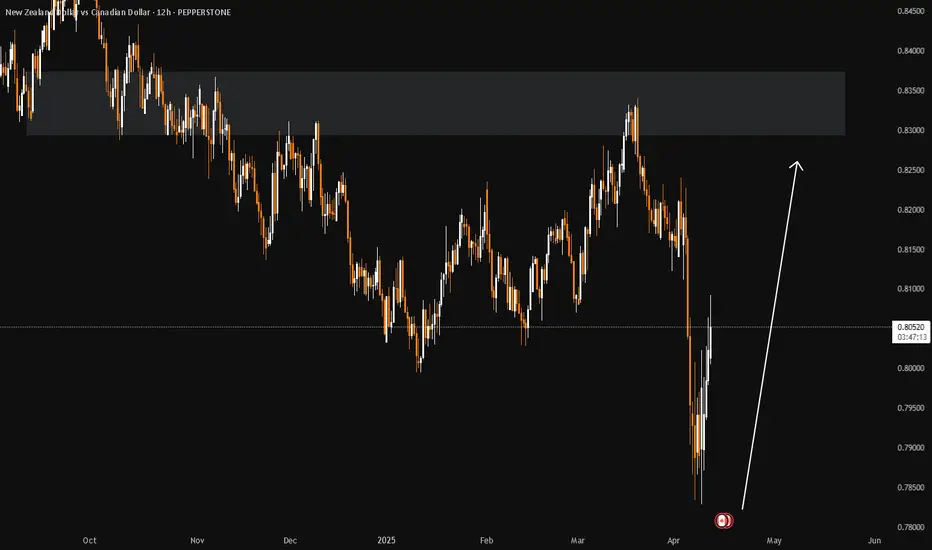
NZDCAD Discretionary Analysis: Bounce at 0.83Hello traders and happy Easter Monday!
I'm expecting a bounce on NZDCAD. I'm interested in this 0.83 zone. It might turn into a strong bounce point. If the signs are there, I'm jumping in with a short.
Discretionary Trading: Where Experience Becomes the Edge
Discretionary trading is all about making decisions based on what you see, what you feel, and what you've learned through experience. Unlike systematic strategies that rely on fixed rules or algorithms, discretionary traders use their judgment to read the market in real time. It's a skill that can't be rushed, because it's built on screen time, pattern recognition, and the ability to stay calm under pressure.
There's no shortcut here. You need to see enough market conditions, wins, and losses to build that intuition—the kind that tells you when to pull the trigger or sit on your hands. Charts might look the same, but context changes everything, and that's something only experience can teach you.
At the end of the day, discretionary trading is an art, refined over time, sharpened through mistakes, and driven by instinct. It's not for everyone, but for those who've put in the work, it can be a powerful way to trade.
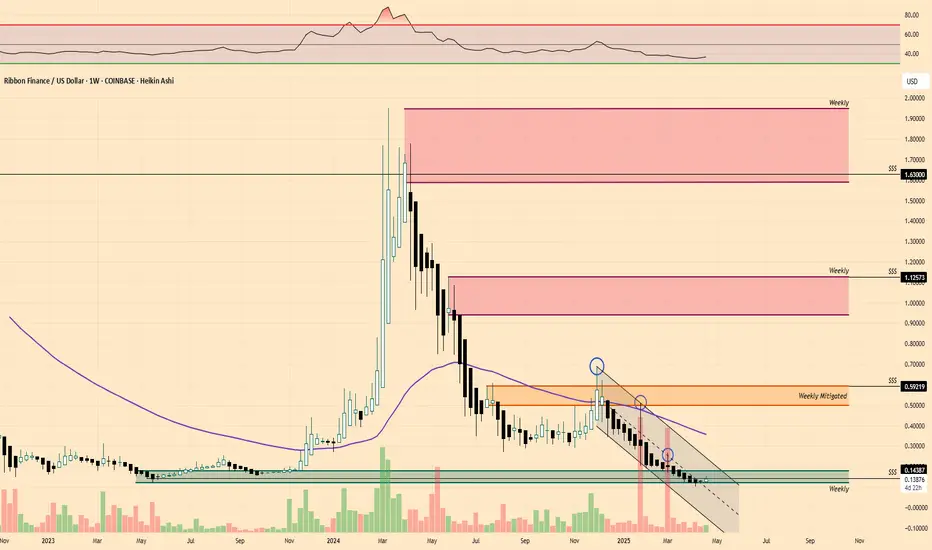
$RBN | Showing glimpses of lifeAdded to my Altcoin Portfolio:
• COINBASE:RBNUSD @ $0.13876 bringing my average cost from $0.17 -> $0.1511
Notes/Thoughts: Typically I would wait until the Weekly Close for my buys as it’s only Tuesday but I like the market pump currently & perceived momentum plus price is still held in a Weekly Demand area without collapse.
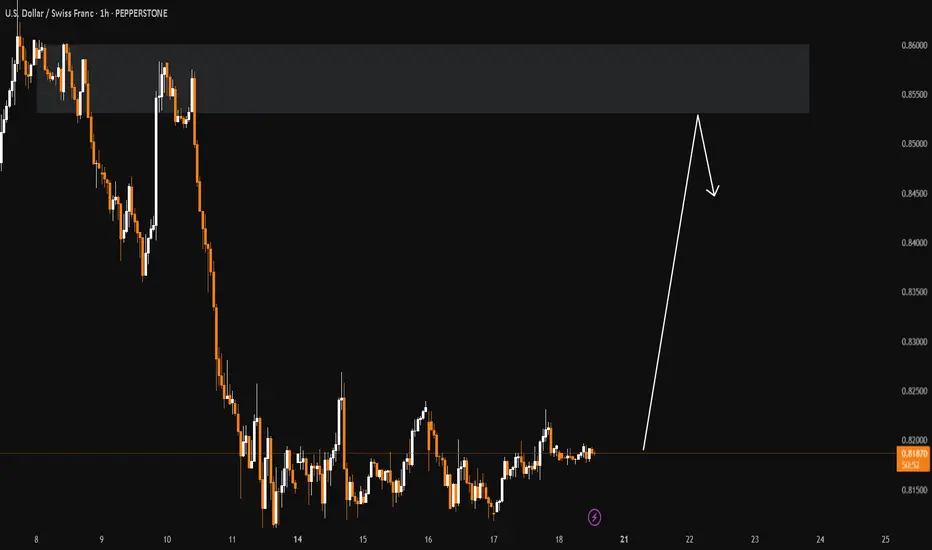
USDCHF Discretionary Analysis: Bounce at 0.85Hello traders.
I'm anticipating the momentum on USDCHF to carry on. Got my eyes locked on the 0.85 area. It might turn into a strong bounce point. If the signs are there, I'm jumping in with a short.
Discretionary Trading: Where Experience Becomes the Edge
Discretionary trading is all about making decisions based on what you see, what you feel, and what you've learned through experience. Unlike systematic strategies that rely on fixed rules or algorithms, discretionary traders use their judgment to read the market in real time. It's a skill that can't be rushed, because it's built on screen time, pattern recognition, and the ability to stay calm under pressure.
There's no shortcut here. You need to see enough market conditions, wins, and losses to build that intuition—the kind that tells you when to pull the trigger or sit on your hands. Charts might look the same, but context changes everything, and that's something only experience can teach you.
At the end of the day, discretionary trading is an art, refined over time, sharpened through mistakes, and driven by instinct. It's not for everyone, but for those who've put in the work, it can be a powerful way to trade.
Yen Outlook: Preparing for the Coming Week! During the recent short trading week, we did not observe significant changes in the portfolios of major players. No outflows or overbought conditions—this indicates that the targets remain unchanged, and we are getting closer to the 0.0072 mark. 📊
I recall how, back in mid-December of last year, we noticed the first signs of volume accumulation in the portfolio. It felt like discovering a new horizon! We shared this insight with our subscribers, allowing us to prepare a plan in advance and identify well-founded entry points for the rise of the yen futures. 🚀
Currently, as we maintain a long position on the futures (or a short on the dollar/yen pair), it is essential to keep in mind the boundaries of the expected volatility range.
We have marked these on the chart: the yellow rectangle for Monday and the red rectangle for the upcoming week. 📅
Given the sustained positive sentiment surrounding yen futures, opening a long position as the price approaches the lower boundary of the range could present an excellent opportunity . As indicated by the arrows on the screenshot, don’t miss your chance! 🎯
Summary, we see that the yen continues to be in focus, and we have a clear action plan. We are holding our long position, monitoring the range boundaries, and preparing for the opportunities the market presents. 🌈
No Valuable Data, No Edge!

BTC POTENTIAL TRIPLE TOP PATTERNhi
From the previous chart, the price successfully broke through the upper trendline and started to rise. This could indicate that bullish momentum is taking over. Waiting for the price to break the upper trendline is a solid strategy for confirming bullish momentum. However, there is a potential triple top pattern forming, which could indicate that the price may face rejection at a key resistance level 86056.35
If the triple top pattern becomes more apparent and the price fails to break above resistance, it could signal the start of a bearish move. In this scenario, trading volume and price action around the resistance zone are crucial to observe. If volume declines and selling pressure increases, the price may drop further.
good luck
**My trading strategy is not intended to be a signal. It's a process of learning about market structure and sharpening my trading my skills also for my trade journal**
Thanks a lot for your support

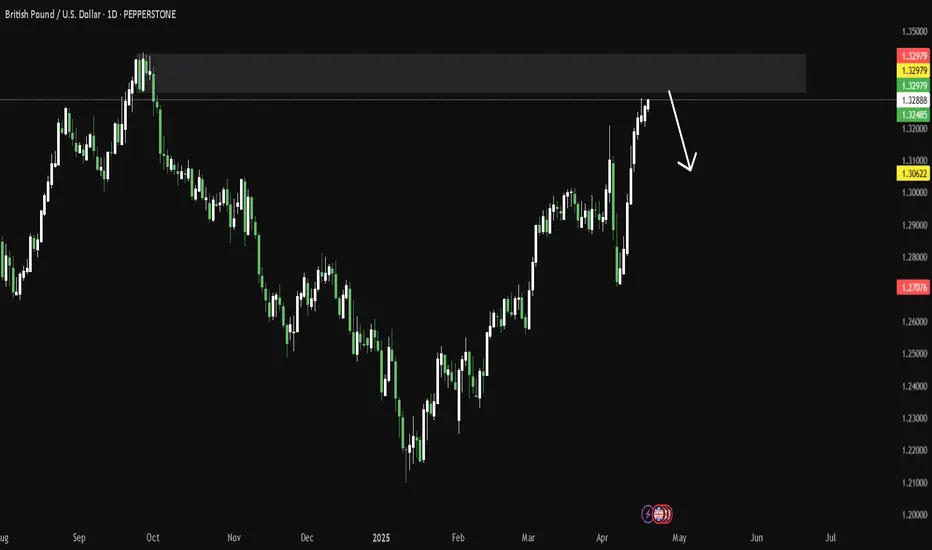
GBPUSD Discretionary Analysis: Bounce at 1.33Hello traders.
On GBPUSD, I'm watching this 1.33 zone closely. It's where I'll be looking for a reaction. It can be a solid bounce spot if it shows signs.
Discretionary Trading: Where Experience Becomes the Edge
Discretionary trading is all about making decisions based on what you see, what you feel, and what you've learned through experience. Unlike systematic strategies that rely on fixed rules or algorithms, discretionary traders use their judgment to read the market in real time. It's a skill that can't be rushed, because it's built on screen time, pattern recognition, and the ability to stay calm under pressure.
There's no shortcut here. You need to see enough market conditions, wins, and losses to build that intuition—the kind that tells you when to pull the trigger or sit on your hands. Charts might look the same, but context changes everything, and that's something only experience can teach you.
At the end of the day, discretionary trading is an art, refined over time, sharpened through mistakes, and driven by instinct. It's not for everyone, but for those who've put in the work, it can be a powerful way to trade.
GBPNZD Discretionary Analysis: Bounce at 2.18Hello traders.
I'm like what I see on GBPNZD. I'm expecting the momentum to continue. I'm watching that 2.18 zone closely. It's where I'll be looking for a reaction. Could be a solid bounce spot, and if it shows signs, I'm stepping in.
Discretionary Trading: Where Experience Becomes the Edge
Discretionary trading is all about making decisions based on what you see, what you feel, and what you've learned through experience. Unlike systematic strategies that rely on fixed rules or algorithms, discretionary traders use their judgment to read the market in real time. It's a skill that can't be rushed, because it's built on screen time, pattern recognition, and the ability to stay calm under pressure.
There's no shortcut here. You need to see enough market conditions, wins, and losses to build that intuition—the kind that tells you when to pull the trigger or sit on your hands. Charts might look the same, but context changes everything, and that's something only experience can teach you.
At the end of the day, discretionary trading is an art, refined over time, sharpened through mistakes, and driven by instinct. It's not for everyone, but for those who've put in the work, it can be a powerful way to trade.

NZDCAD Discretionary Analysis: Bank Manipulation?The price just crashed into the distribution block, straight into that sellside liquidity order block like it knew exactly where it was going. Bank manipulation? It's all over this one. The institutional orderflow is running the show, and with a sharp liquidity spike followed by orders stacking up like a ticking time bomb, it's getting real... they are manipulating the price. The fair value gap is wide, and that uptrust into the distribution channel? That's the red flag that’s flashing "this is it." Everything is lined up for a big move, and I'm here for going on the lower timeframe and entering on that liquidity sweep from a NY Open manipulated candlestick.
Just kidding, I just think it's gonna go up.
AUDUSD Discretionary Analysis: Recovery Mode ActivatedIt’s that feeling when the engine’s been cold for a while, but now it’s starting to rev. AUDUSD is flashing signs it wants to push up — not in a rush, but with purpose. I’m seeing strength building, like it’s getting ready to climb. Recovery mode’s not just activated — it’s already in motion. I’m calling for upside here. If it plays out, I’ll be riding the move. If not, hey, I’ll wait for the next setup. But right now? I like the long.
Just my opinion, not financial advice.

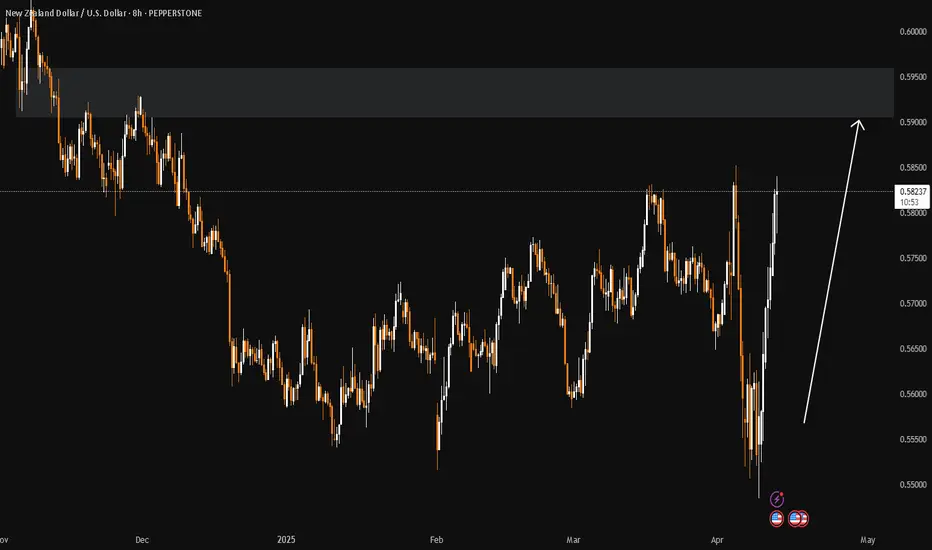
NZDUSD Discretionary Analysis: Bounce at 0.59Hello traders.
NZDUSD has potential for me. I'm expecting the momentum to continue, and I've got my eye on that 0.59 level to get involved. That's where I'll be looking for a setup.
Discretionary Trading: Where Experience Becomes the Edge
Discretionary trading is all about making decisions based on what you see, what you feel, and what you've learned through experience. Unlike systematic strategies that rely on fixed rules or algorithms, discretionary traders use their judgment to read the market in real time. It's a skill that can't be rushed, because it's built on screen time, pattern recognition, and the ability to stay calm under pressure.
There's no shortcut here. You need to see enough market conditions, wins, and losses to build that intuition—the kind that tells you when to pull the trigger or sit on your hands. Charts might look the same, but context changes everything, and that's something only experience can teach you.
At the end of the day, discretionary trading is an art, refined over time, sharpened through mistakes, and driven by instinct. It's not for everyone, but for those who've put in the work, it can be a powerful way to trade.
CHFJPY Discretionary Analysis: Bouncing from the zoneHello traders.
CHFJPY is getting ready for the bounce. Start looking for a setup, if you are not already in.
Discretionary Trading: Where Experience Becomes the Edge
Discretionary trading is all about making decisions based on what you see, what you feel, and what you've learned through experience. Unlike systematic strategies that rely on fixed rules or algorithms, discretionary traders use their judgment to read the market in real time. It's a skill that can't be rushed, because it's built on screen time, pattern recognition, and the ability to stay calm under pressure.
There's no shortcut here. You need to see enough market conditions, wins, and losses to build that intuition—the kind that tells you when to pull the trigger or sit on your hands. Charts might look the same, but context changes everything, and that's something only experience can teach you.
At the end of the day, discretionary trading is an art, refined over time, sharpened through mistakes, and driven by instinct. It's not for everyone, but for those who've put in the work, it can be a powerful way to trade.

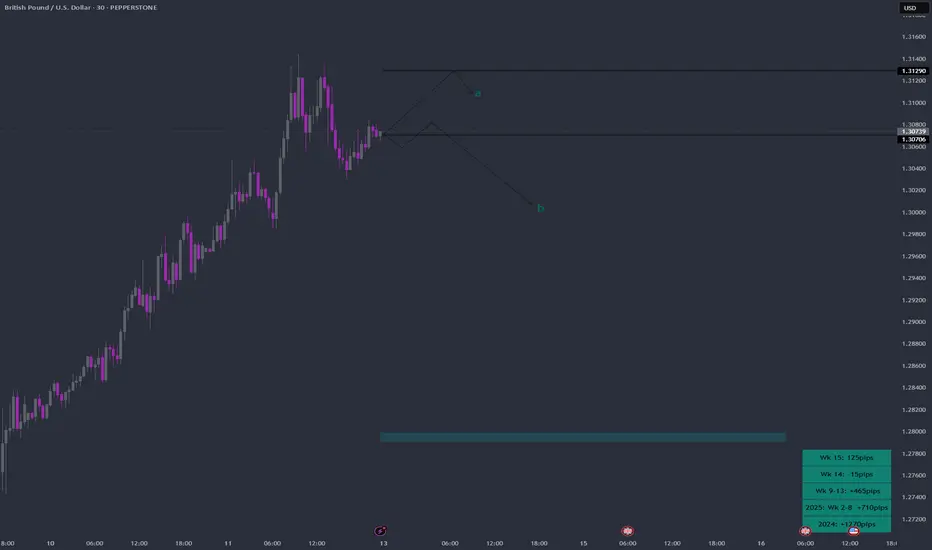
LEAP: GBPUSD Week 16 Swing Zone/LevelsSwing zone and levels are calculated and set.
As always price action determines trades.
GBPJPY Discretionary Analysis: Aiming for the Sky I’m not entirely sure, but my gut says it’ll go up. If not, I lose some money and my gut clearly needs more back testing. Profit if I’m right, lesson if I’m wrong! 👌
Just my opinion, not financial advice.
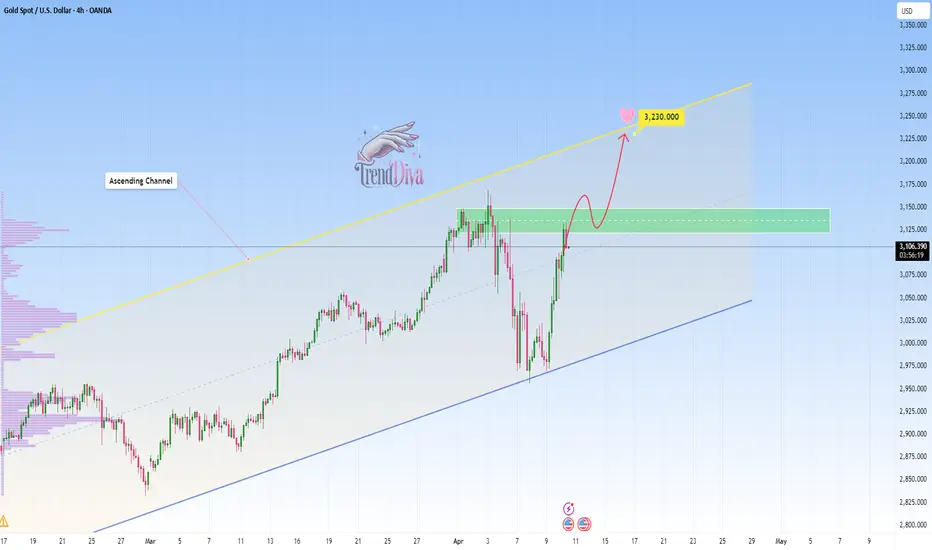
GOLD Analysis: Will buyers push toward 3,230?OANDA:XAUUSD continues to trade within a clearly defined ascending channel, with price action consistently respecting both upper and lower boundaries. The recent price action suggests buyers are currently in control, indicating the potential for continued upside.
Given the strength of the current bullish momentum, there is a strong likelihood that price may break above the key resistance zone. If that happens, it could come back to retest the level as support before continuing higher. A successful retest would reinforce the bullish structure and open the door for a potential move toward the 3,230 target, which aligns with the channel’s upper boundary.
However, if price fails to break above the resistance zone, it could signal weakening bullish momentum and open the door for a deeper pullback toward the lower boundary of the ascending channel.
Always confirm your setups and manage your risk accordingly.
Best of luck!
US DOLLAR at Key Support: Will Price Rebound to 103.000TVC:DXY is currently approaching an important support zone, an area where the price has previously shown bullish reactions. This level aligns closely with the psychological $100 , which tends to have strong market attention.
The recent momentum suggests that buyers could step in and drive the price higher. A bullish confirmation, such as a strong rejection pattern, bullish engulfing candles, or long lower wicks, would increase the probability of a bounce from this level. If I'm right and buyers regain control, the price could move toward the 103.00 level.
However, a breakout below this support would invalidate the bullish outlook, potentially leading to more even more downside.
This is not financial advice!

EURGBP Discretionary Analysis: Eyes on the SupplyIt's that feeling when you just know the tide's about to turn (like when you're waiting for the wind to pass but can already smell the rain). EURGBP is giving off that "Next stop? Supply zone" kind of vibe. I see it pushing up to test that level, like it's gearing up for a showdown. If I'm right, I'll be eyeing some clean entries to make a move. If I'm wrong, I'll just grab a coffee and wait for the next opportunity to roll in.
Just my opinion, not financial advice.
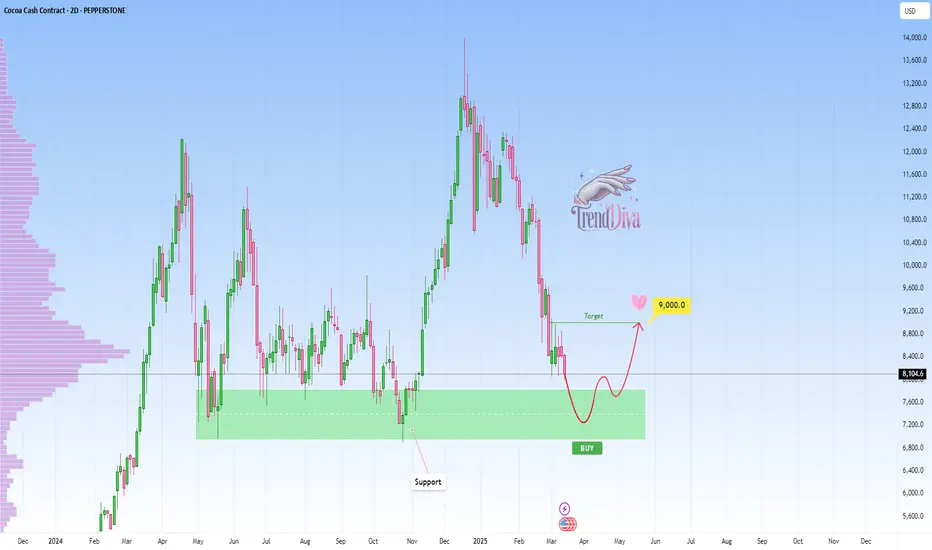
COCOA Nearing Major Support - Rebound Towards 9,000$?PEPPERSTONE:COCOA is approaching a significant support zone. This area has consistently acted as a key level where buyers have stepped in, leading to notable reversals in the past. The current move suggests the potential for a bullish reaction if price action confirms rejection through signals such as bullish engulfing candles, long lower wicks, or increased buying volume.
If the support holds, I anticipate a move upward toward the 9,000 level, aligning with the expectation of a short-term reversal. However, if the price breaches this zone and sustains below it, the bullish outlook may be invalidated, potentially opening the door for further downside.
Monitoring candlestick patterns and volume at this critical zone is essential for identifying buying opportunities. Proper risk management is advised to navigate potential volatility.
Just my take on support and resistance zones—not financial advice. Always confirm your setups and trade with solid risk management.
Best of luck!
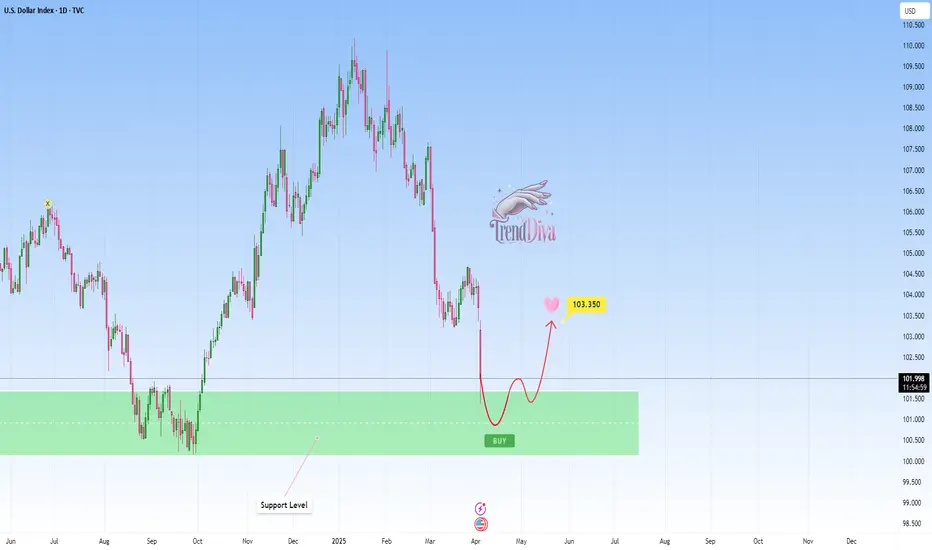
US DOLLAR at Key Support: Will Price Rebound to 103.350?TVC:DXY is currently testing a key support zone, an area where the price has previously shown strong bullish reactions. The recent price action suggests that buyers may step in and drive the price higher. A bullish confirmation, such as a strong rejection pattern, bullish engulfing candles, or long lower wicks, would increase the probability of a bounce from this level. If buyers regain control, the price could move toward the 103.350 level.
However, a breakout below this support would invalidate the bullish outlook, potentially opening the door for further downside.
This is not financial advice but rather how I approach support/resistance zones. Remember, always wait for confirmation, like a rejection candle or volume spike before jumping in.
Please boost this post, every like and comment drives me to bring you more ideas! I’d love to hear your perspective in the comments.
Best of luck , TrendDiva
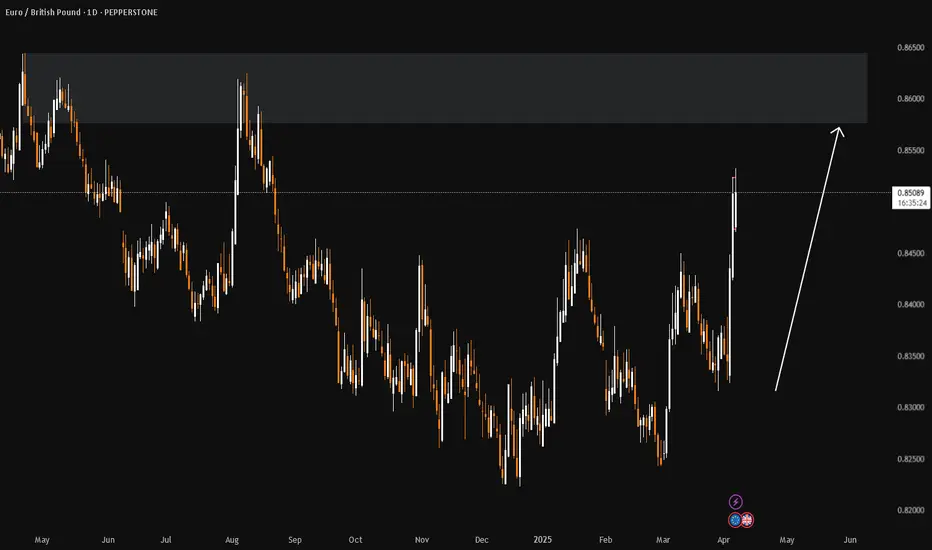
EURGBP Discretionary Analysis: Dive Time, No Life Jacket NeededIt’s dive time, no life jacket needed, just that instinct telling me it’s going down.
You know that feeling when you’re about to jump in, but you’ve got no backup? That’s the vibe here.
I’m calling for a deep dive, and I’m riding it all the way. If I’m right, I’ll be making a splash with some profits. If not, I’ll just float back up and try again.
Just my opinion, not financial advice.
LEAP: GBPUSD Week 15 Swing Zone/LevelsFollowing last week's sharp whipsaw that ended in a downtrend due to the tariff announcement, the expectation is for the downward trend to continue. That said, price action may ultimately tell a different story.