Gold Approaching Major Resistance – Will It Drop to 2,736$?OANDA:XAUUSD is nearing the upper boundary of an ascending channel, which aligns with a major resistance zone. This area has acted in the past as a reversal point, making it a key level to watch for potential bearish movements.
If the price confirms rejection at this level, I anticipate a move downward toward the 2,736$ level, consistent with the channel’s structure and a nearby support zone. Conversely, if this resistance is breached, it could signal increased buying pressure and a continuation of the bullish trend.
Support_and_resistance

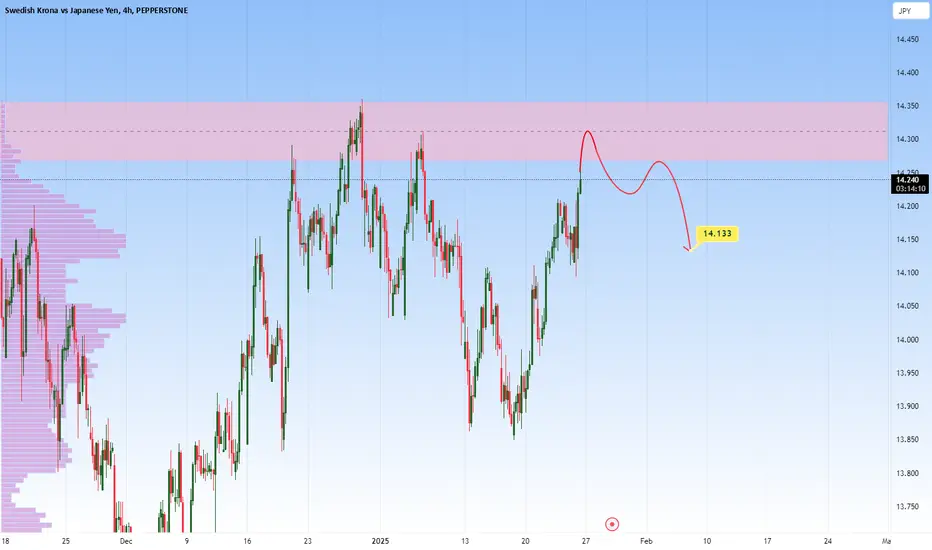
SEKJPY at Major Resistance - Could it Reach 14.133?SAXO:SEKJPY is approaching a key resistance level that has previously triggered bearish reversals. While current bullish momentum has driven the price into this zone, it could present an opportunity for sellers to step in.
If bearish signals such as rejection wicks or bearish engulfing candles appear, a move toward 14.133 could follow. On the other hand, a breakout above this resistance would invalidate the bearish bias and signal potential for further upside.
Key Takeaway: Wait for clear rejection patterns before considering short positions.
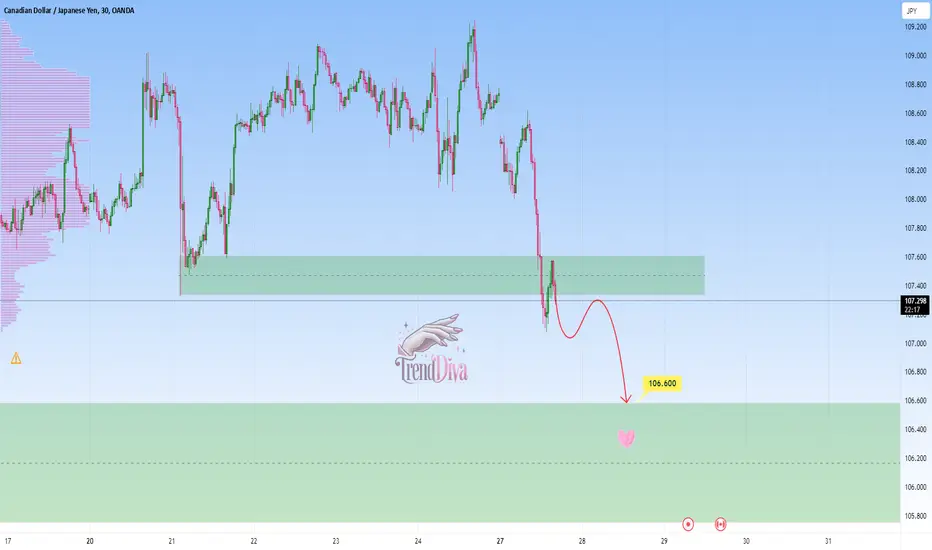
CADJPY - Bearish Continuation After Support BreakOANDA:CADJPY has broken through a key support level and is now retesting this level as resistance. If the resistance holds, it could pave the way for a deeper move downward, with the 106.600 level emerging as the next major area of interest. This level also aligns with a significant support zone, making it a critical area where buyers may attempt to regain control.
Traders are advised to monitor for bearish confirmation signals, such as bearish engulfing candlestick patterns, rejection wicks, or strong selling volume at the retested resistance level. Such signals would reinforce the probability of a continuation to the downside. However, a decisive break back above the resistance zone would invalidate the bearish scenario
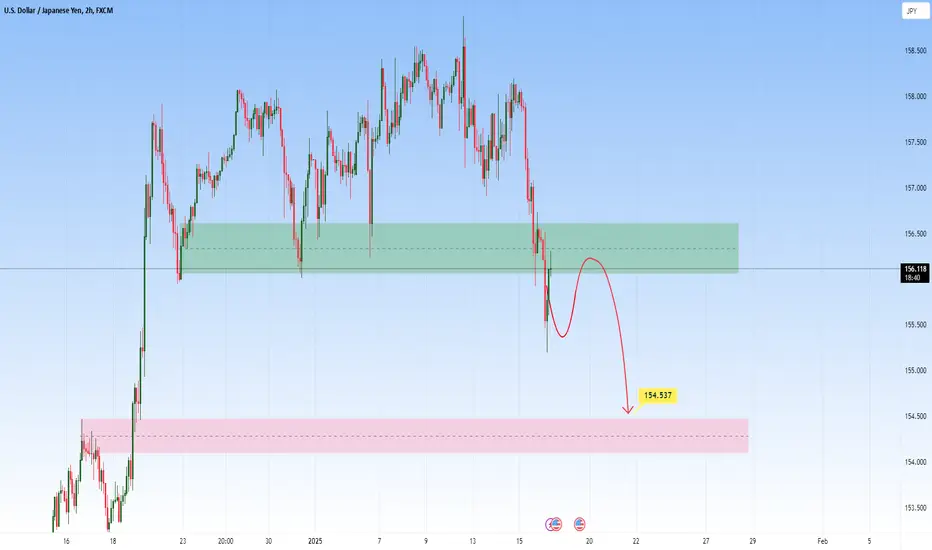
USDJPY – Break & Retest Short SetupThe USDJPY pair has recently broken below a key support level. This area could potentially act as resistance, presenting a classic break-and-retest scenario.
A bearish confirmation, such as rejection wicks, bearish engulfing candles, or strong selling pressure, would validate the potential for a short setup. If sellers step in at this level, the next downside target could be the 154.537 zone.
Traders should monitor the retest closely for clear signs of rejection before committing to short positions.
GBPCAD - Bearish Momentum Expected from Resistance ZoneOANDA:GBPCAD is currently testing a significant resistance zone. This level has previously acted as resistance, leading to a bearish reversal. The recent upward momentum into this zone suggests a potential for sellers to regain control and push prices lower.
A bearish confirmation, such as a rejection candle, bearish engulfing pattern, or signs of fading bullish momentum, would indicate an increased likelihood of a move downward. If this scenario unfolds, the price could head toward the 1.78220 level.
This setup aligns with a potential short-term correction after an impulsive move. Traders should wait for confirmation of selling pressure before considering short positions.
This is not financial advice but rather how I approach support/resistance zones. Always wait for confirmation, like a rejection candle or volume spike before jumping in. And let me know what you think of this setup in the comments!

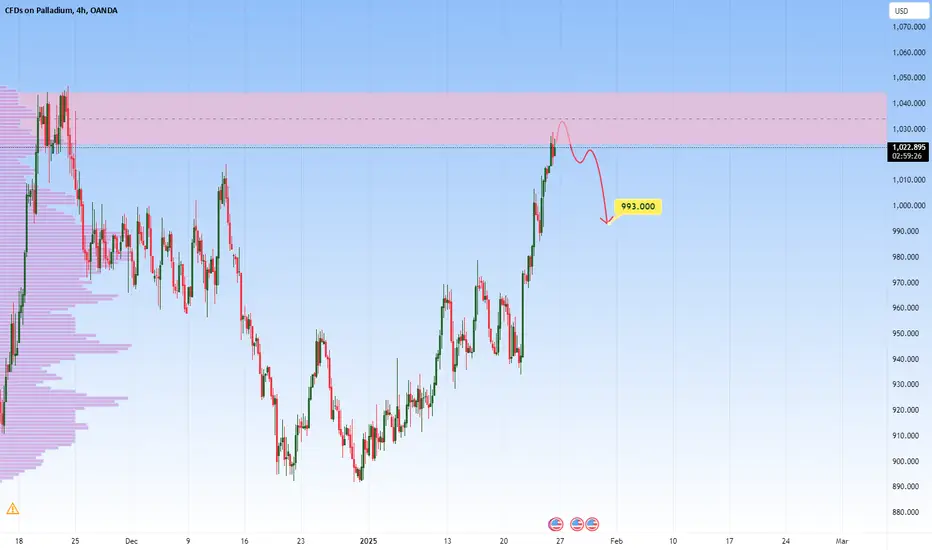
PALLADIUM - In a significant resistance levelOANDA:XPDUSD is approaching a significant resistance level that has previously seen bullish momentum. This area aligns with a notable supply zone and could present a potential selling opportunity.
If bearish signals, such as rejection wicks or bearish candlestick patterns, appear, the price may decline toward 993,000. Crossing above this resistance zone would diminish the bearish perspective and indicate bullish continuation.
Key Takeaway: Monitor price action closely at this level and prioritize strong risk management. What’s your perspective on this setup? Share your thoughts in the comments!
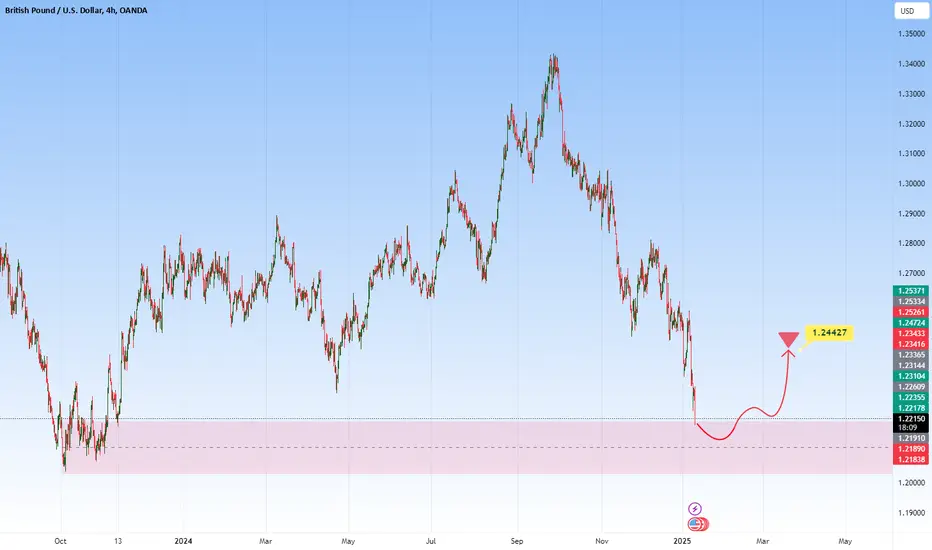
GBPUSD - Potential Long from Key Support ZoneThe GBPUSD pair is currently approaching a significant demand zone near the 1.20200 - 1.22000 level. Historically, this area has served as a robust support level, often leading to strong bullish reversals. The recent bearish momentum has pushed the pair into this critical area, increasing the likelihood of buying interest emerging.
A bullish confirmation, such as a strong rejection pattern, bullish engulfing candles, or long lower wicks, would signal potential upward movement. If buyers regain control, the price may head toward the 1.24427 level.
This setup suggests a potential short-term rebound, aligning with a corrective move within the broader market structure.
EOS at Key Support Level - Bullish Bounce ExpectedCOINBASE:EOSUSD has reached a significant support area that has previously attracted buying interest, resulting in bullish bounces. If the support level holds and a bullish confirmation emerges, I anticipate a move toward the 0.8641 level. However, if the support is broken, the bullish outlook will be invalidated, opening the door for further bearish momentum.
Traders should wait for clear confirmation of buyer strength before opening any trades. If this analysis resonates with you or you have a different perspective, feel free to discuss in the comments!

Polygon at Key Support Zone - Will It Bounce to 0.4700?COINBASE:MATICUSD has reached a significant support level that has previously attracted buying interest, often resulting in bullish recoveries. This level aligns with previous market reactions, highlighting its role as a key area to watch.
If the support holds and bullish confirmation emerges—such as bullish engulfing candles or long lower wicks—a move toward the 0.4700 level is anticipated. However, if the support is broken, the bullish outlook could be invalidated, opening the door for further bearish momentum.
Traders should closely monitor this zone for signs of buyer strength before considering long positions. As always, risk management is essential to mitigate potential losses.

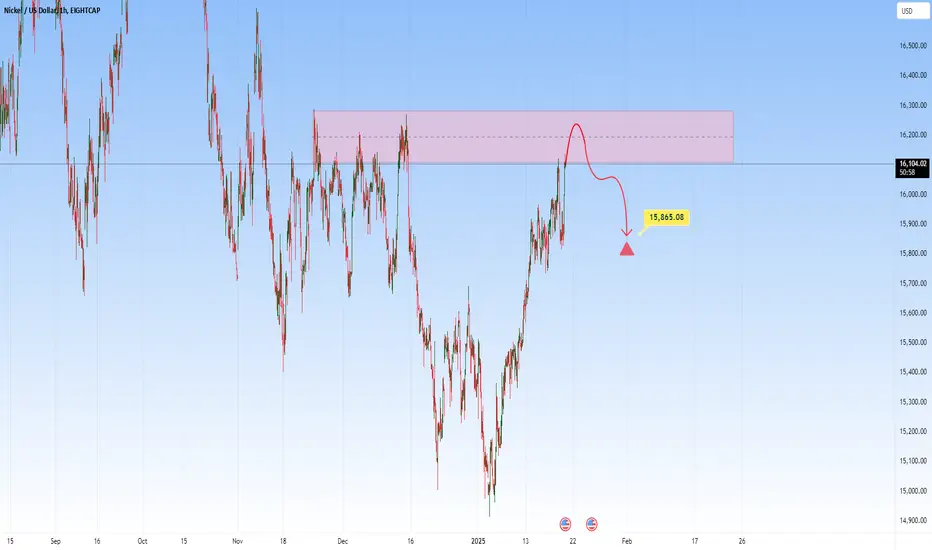
NICKEL: Sell Setup at Key ResistanceCAPITALCOM:NICKEL is at a key resistance zone. This zone has consistently acted as a key area of interest where sellers regained control, leading to prior reversals. If the price confirms rejection through bearish price action, such as wicks signaling rejection or bearish engulfing candles, I anticipate a move downward toward the 15865.08 level.
However, if the price successfully breaks and holds above the zone, this would invalidate the bearish outlook and could open the door for further upside. Traders should monitor price action closely at this critical resistance area.
Proper risk management is essential, given the possibility of price breaking higher.
TRUMP at Key Support Level: Will It Bounce or Break Below?BINANCE:TRUMPUSDT is trading near a key support level that previously acted as a foundation for bullish momentum. The recent price action indicates that this area may serve as a strong demand zone.
If bullish confirmation appears, such as increased buying volume or candlestick reversal patterns, I expect the price to move toward 42.00$. Conversely, a break below this support would weaken the bullish scenario and suggest further downside.
Traders should monitor this level closely and use proper risk management to navigate potential market volatility.

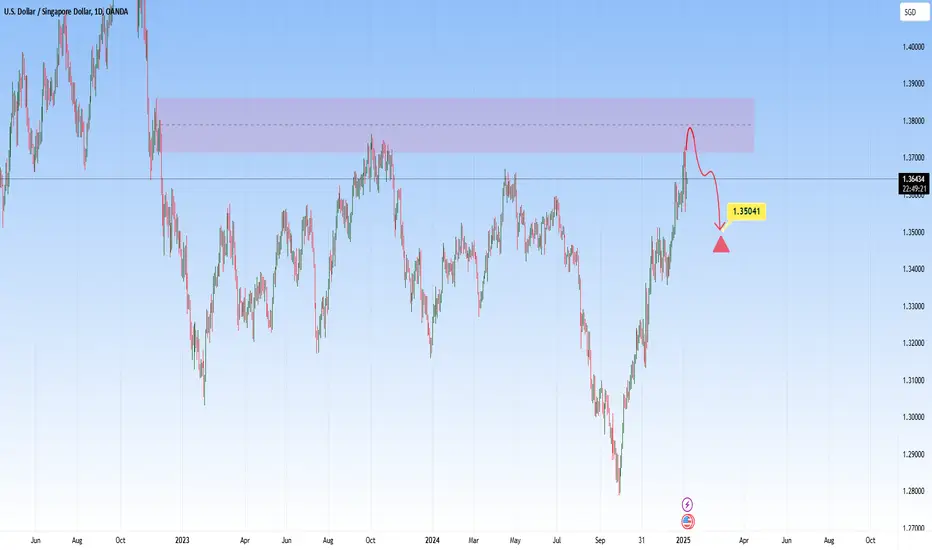
USDSGD: Potential Short from Key ResistanceThe USDSGD pair is approaching a notable resistance zone around the 1.37160 level, an area that has historically acted as a supply zone, leading to price reversals. The current price action shows signs of hesitation as it tests this zone, which could indicate potential weakness.
If sellers regain control, the pair could reverse downward, with the 1.35041 level being a likely target for the next support zone.
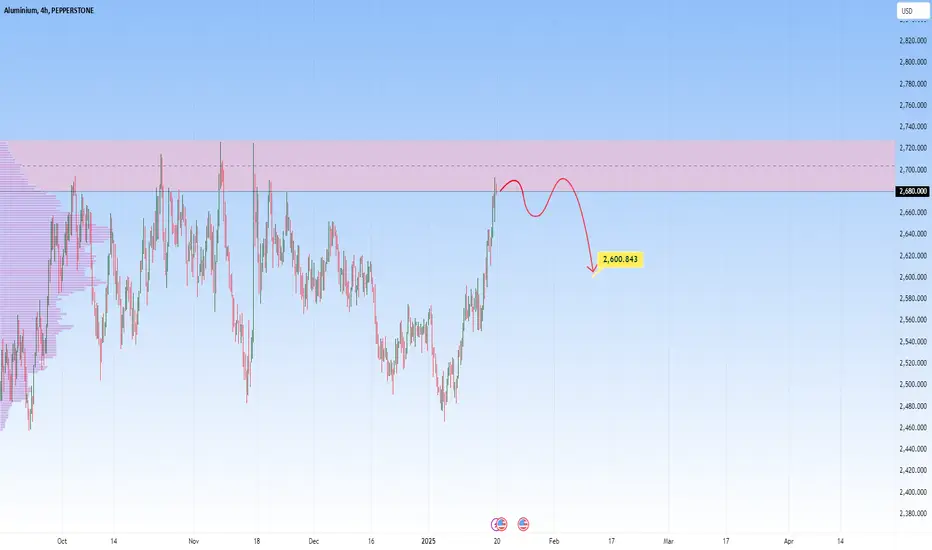
ALUMINIUM - Short Opportunity in sight PEPPERSTONE:ALUMINIUM is nearing a critical resistance zone that has consistently acted as a barrier for bullish momentum. This area aligns with prior supply levels and may attract seller interest.
If rejection patterns, such as bearish engulfing candles or long upper wicks, appear, I anticipate a move toward 2,600. A break above this resistance could indicate a shift in sentiment.
What you should monitor closely is confirmation before entering short positions. If you have any thoughts or agree with this analysis, I’d love to hear your perspective in the comments!
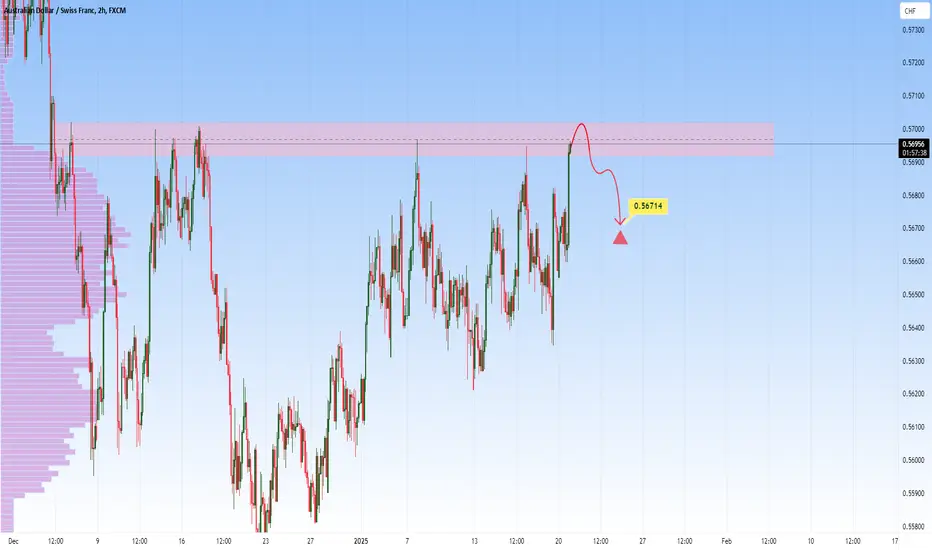
AUDCHF at Key Resistance: Will It Drop To 0.56714?OANDA:AUDCHF is at a significant resistance area that has consistently acted as a barrier for bullish momentum. The recent price action suggests a potential for sellers to step in and drive prices lower from this zone.
If rejection signals, such as bearish engulfing candles or upper wicks, appear, I expect a move toward 0.56714. A break above this resistance, however, could indicate a shift in market sentiment.
Traders should wait for confirmation before entering short positions and ensure proper risk management. If you have any thoughts or agree with this analysis, I’d love to hear your perspective in the comments!
Platinum – Potential Short Setup with RetestPlatinum is currently trading below a key resistance zone, following a breakdown from the ascending channel. The recent bearish momentum indicates the potential for a continuation lower if the price fails to reclaim the resistance zone.
If the price retests this zone and shows rejection signals—such as bearish wicks, engulfing candles, or decreased buying pressure—it would strengthen the case for a short trade. In this scenario, the next target for sellers would be the $926.94 support zone, where buying interest may re-emerge.
This setup aligns with the broader bearish structure following the channel breakdown. Traders should monitor price action closely at the resistance level for confirmation of rejection before entering short positions.

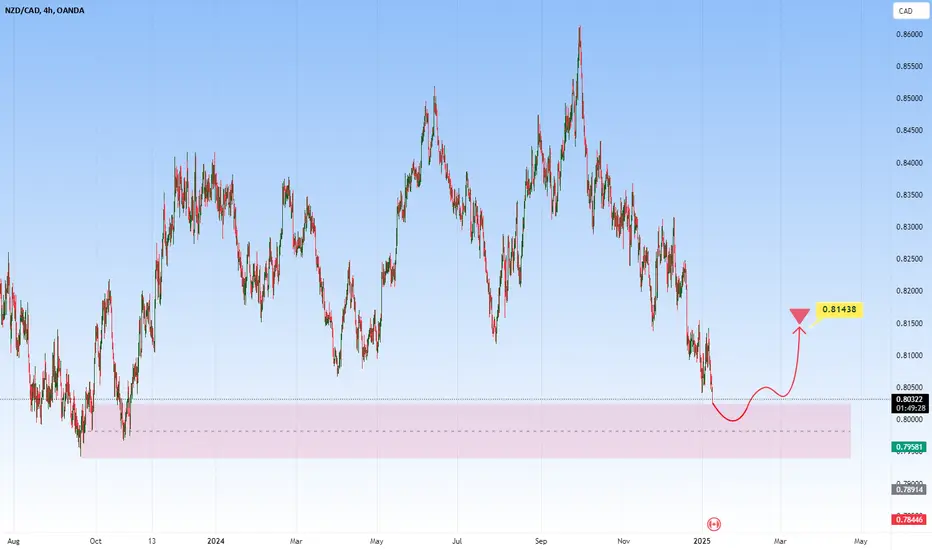
NZDCAD - Potential Long from Support ZoneThe NZDCAD pair is currently approaching a significant demand zone near the 0.80200 level. Historically, this area has acted as strong support, leading to bullish reversals. The recent decline into this zone suggests a potential for buyers to regain control and push prices higher.
A bullish confirmation, such as a strong rejection pattern, bullish engulfing candles, or long lower wicks, would support the likelihood of a move upward. If the scenario materializes, the price may head toward the 0.81438, where sellers might step in again.
This setup aligns with a potential short-term rebound within the broader market structure. Traders should wait for confirmation of buying pressure before considering long positions.
What are your thoughts on this outlook?
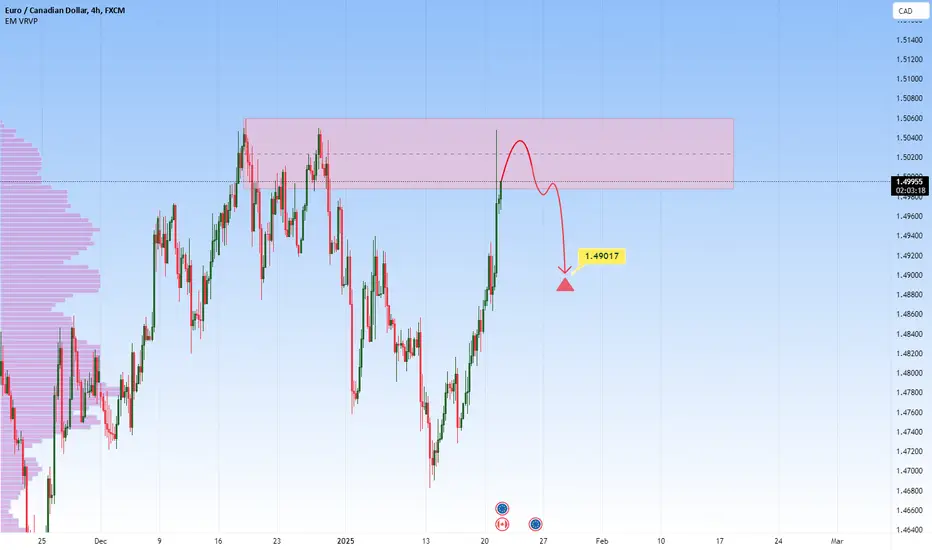
EURCAD at Major Resistance – Short Opportunity Ahead?OANDA:EURCAD is currently testing a significant resistance zone. This area has seen strong selling pressure, leading to notable bearish moves. The recent bullish push into this resistance zone suggests a potential for sellers to regain control.
A bearish confirmation, such as rejection candles, bearish engulfing patterns, or long upper wicks, would increase the probability of a downward move. If this scenario unfolds, the price could head toward the 1.49017 level.
Traders should remain cautious and wait for clear signs of selling pressure before considering short positions. Proper risk management is essential, given the possibility of a break above the resistance zone.
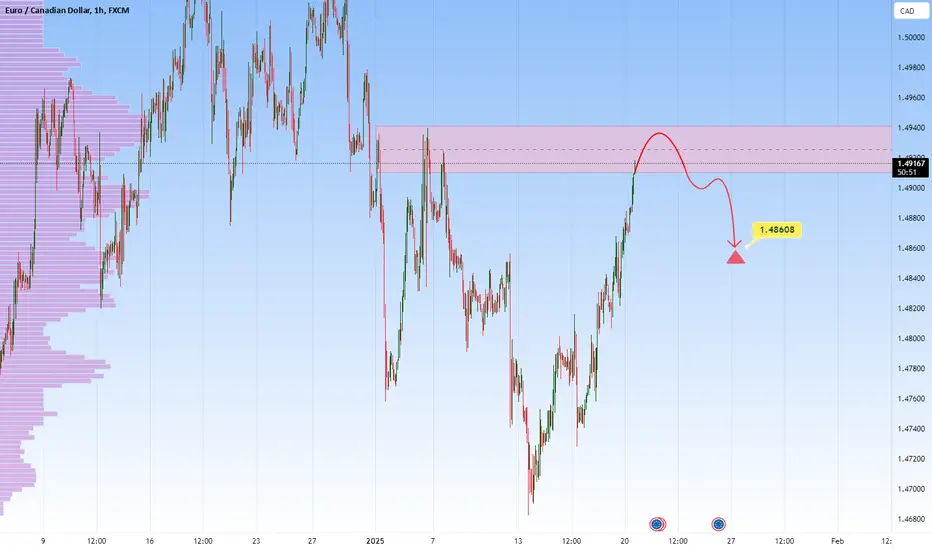
EURCAD - Potential Sell From Resistance ZoneEURCAD is testing a major resistance zone that has previously led to significant bearish reversals. The recent bullish momentum into this area increases the likelihood of seller interest.
If bearish confirmation emerges, such as rejection wicks, bearish engulfing candles, or increased selling volume, I anticipate a move toward 1.48608. However, a breakout above this resistance could signal further bullish continuation.
Traders should remain cautious and wait for clear signals of rejection before taking positions. Agree with this analysis? Let’s discuss further in the comments section!
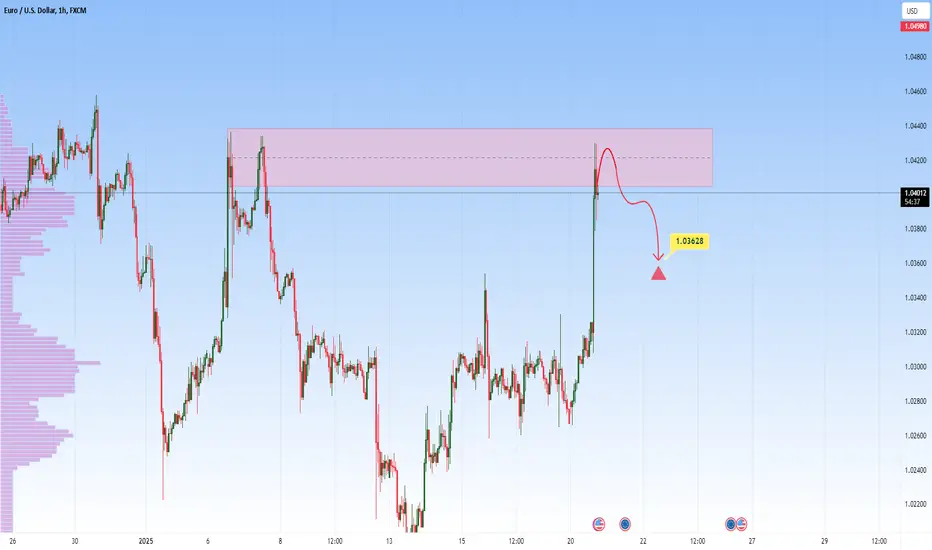
EURUSD at Key Resistance - Will it Drop to 1.03628?EURUSD is at a critical resistance zone that has consistently acted as a barrier for bullish momentum. This area aligns with prior supply levels and may attract seller interest.
If rejection patterns, such as bearish engulfing candles or long upper wicks, appear, I anticipate a move toward 1.03628. Conversely, a break above this resistance could indicate a shift in sentiment.
Traders should monitor this zone closely and wait for confirmation before entering short positions. If you have anything to add or a different perspective, I’d love to hear from you in the comments!
USDZAR - Potential Short from Key Resistance ZoneThe USDZAR pair is currently trading near a significant resistance zone around the 19.10300 level. Historically, this area has acted as a key turning point, where sellers have stepped in to push prices lower. The recent approach toward this resistance suggests a potential bearish scenario if price action confirms a rejection.
A clear rejection pattern, such as bearish engulfing candles, long upper wicks, or other signs of selling pressure, could indicate the start of a downward move. If this scenario unfolds, the price may head toward the 18.62617 target level, aligning with a potential corrective phase in the market.
This setup reflects the broader expectation of a pullback within the existing market structure. Traders should closely monitor price action at the resistance zone for confirmation signals before entering positions.
Feel free to share your thoughts or any additional insights!

CADCHF - Short Setup at Key ResistanceThe CADCHF pair just entered a notable resistance zone that has times before acted as a supply zone, leading to bearish movements. A confirmation of selling pressure, such as a bearish engulfing pattern or multiple rejection wicks at the resistance level, would increase the likelihood of a downward move.
If sellers take control at this level, the pair could move downward, with a target around the 0.63230 level.

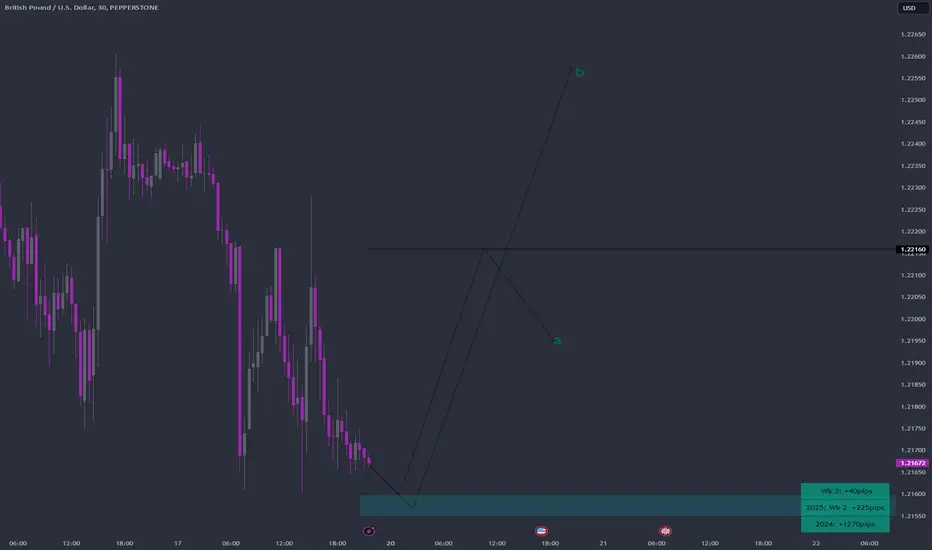
GBPUSD Week 4 Swing Zone & LevelDynamic Take profit, dtp allows trade to catch big moves. These are set based on price momentum. Last week provided a humble 40pips.
Initial Swing Zone/Level are calculated at
Zone: 21599-21549
Level set as shown. Either a or b could play out, as determined by Price action.
As price breaks or bounces off these areas, new zones/levels will be recalculated.
Happy trading week
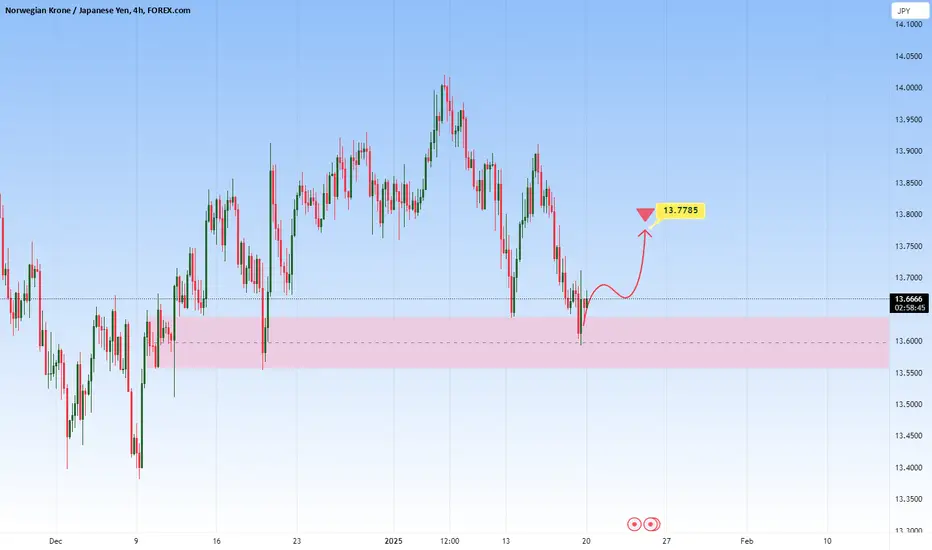
NOKJPY - Buy Setup from Key SupportFOREXCOM:NOKJPY is currently at a significant demand zone that has historically attracted buyers, triggering bullish reversals. This support level has been pivotal in past price actions, forming a solid base for potential upward momentum.
The appearance of a strong bullish candle reinforces the setup, suggesting the likelihood of an upward movement, with a target around 13.7785. However, if the support level is breached, the bullish sentiment could fade, allowing for a possible decline.
Traders should remain alert in this zone for signs of buyer strength before taking long positions. Proper risk management is critical to mitigate the risk of losses.