EURJPY 300+ PIP DROPFrom the beginning of the week i have called out shorts on EJ into 170.000 in the video we can see price hit that support and hitting target for a few positions and entry i called out during the week and also some key points for your personal trading
Support and Resistance

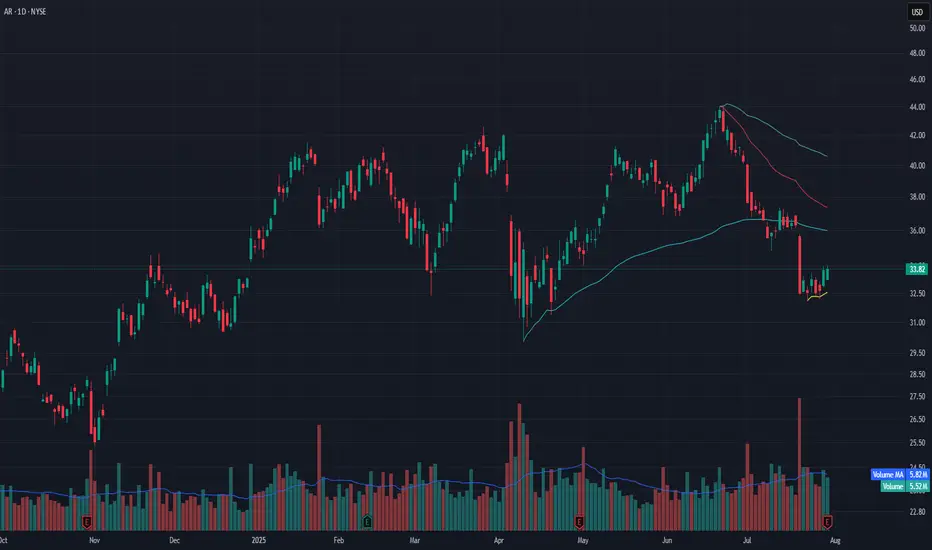
AR Rebounding from VWAP Zone – Watch for Break Above $34AR is attempting to base after a steep selloff from the $44 level. Over the past few sessions, price has found stability above the anchored VWAP (yellow line) and printed multiple higher lows. Today’s close at $33.82 brings it right up against the recent short-term resistance near $34.
Volume is steady (5.52M vs. 5.82M average), suggesting balance between buyers and sellers. A confirmed breakout above $34 with volume could trigger a move toward the $36.50–37 range, where the next anchored VWAP (red) and declining 20 EMA reside.
This setup favors early reversal traders with tight risk below VWAP and confirmation needed through $34.25.
Indicators used:
Anchored VWAP (short-term support reclaim)
Volume trend (flat but no selling surge)
Price structure (potential bottom formation with higher lows)
Entry idea: Long above $34
Target: $36.50–37
Stop: Below $32.75 or VWAP zone
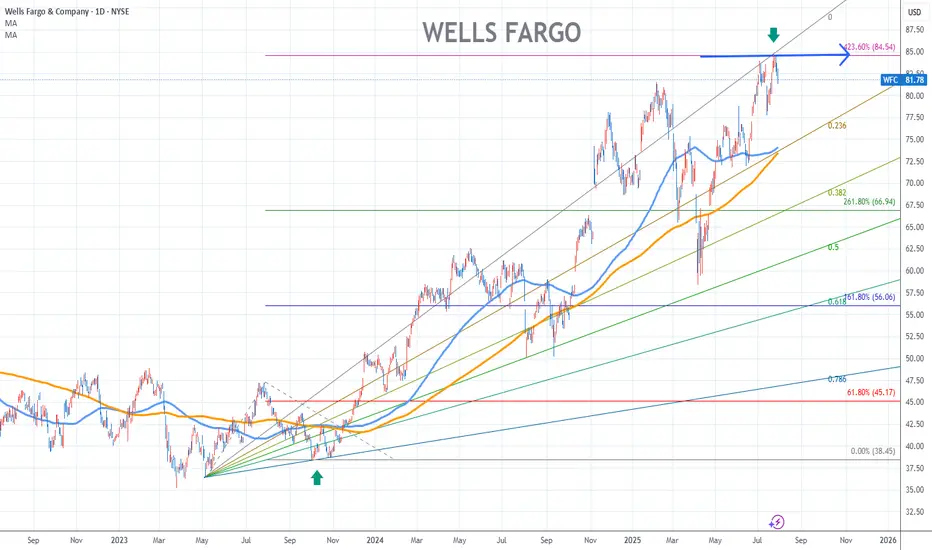
Wells Fargo Stock Chart Fibonacci Analysis 073025Hit the 84.5/423.60% resistance level.
Trading Idea
Chart time frame:D
A) 15 min(1W-3M)
B) 1 hr(3M-6M)
C) 4 hr(6M-1year)
D) 1 day(1-3years)
Stock progress:E
A) Keep rising over 61.80% resistance
B) 61.80% resistance
C) 61.80% support
D) Hit the bottom
E) Hit the top
Stocks rise as they rise from support and fall from resistance. Our goal is to find a low support point and enter. It can be referred to as buying at the pullback point. The pullback point can be found with a Fibonacci extension of 61.80%. This is a step to find entry level. 1) Find a triangle (Fibonacci Speed Fan Line) that connects the high (resistance) and low (support) points of the stock in progress, where it is continuously expressed as a Slingshot, 2) and create a Fibonacci extension level for the first rising wave from the start point of slingshot pattern.
When the current price goes over 61.80% level , that can be a good entry point, especially if the SMA 100 and 200 curves are gathered together at 61.80%, it is a very good entry point.
As a great help, tradingview provides these Fibonacci speed fan lines and extension levels with ease. So if you use the Fibonacci fan line, the extension level, and the SMA 100/200 curve well, you can find an entry point for the stock market. At least you have to enter at this low point to avoid trading failure, and if you are skilled at entering this low point, with fibonacci6180 technique, your reading skill to chart will be greatly improved.
If you want to do day trading, please set the time frame to 5 minutes or 15 minutes, and you will see many of the low point of rising stocks.
If want to prefer long term range trading, you can set the time frame to 1 hr or 1 day.
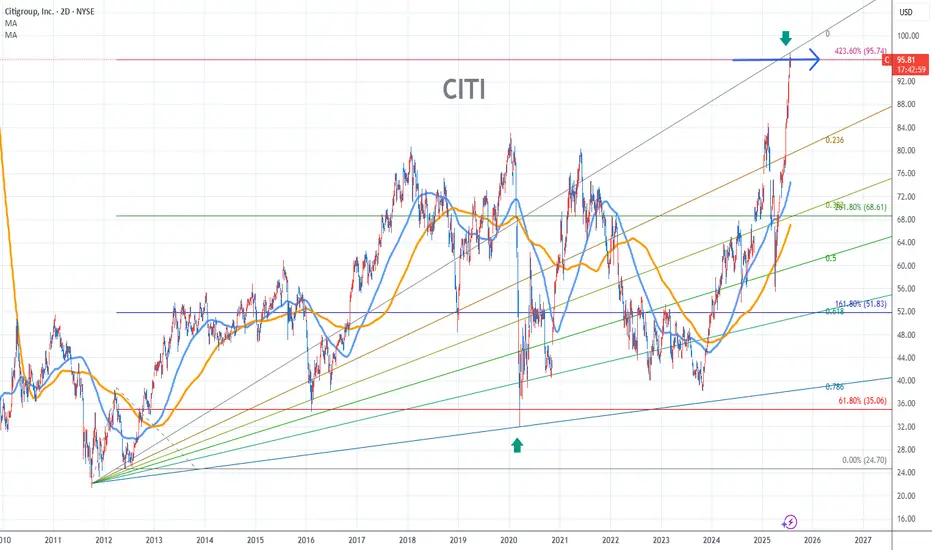
Citigroup Stock Chart Fibonacci Analysis 073025Hit the 96/423.60% resistance level.
Chart time frame:D
A) 15 min(1W-3M)
B) 1 hr(3M-6M)
C) 4 hr(6M-1year)
D) 1 day(1-3years)
Stock progress:E
A) Keep rising over 61.80% resistance
B) 61.80% resistance
C) 61.80% support
D) Hit the bottom
E) Hit the top
Stocks rise as they rise from support and fall from resistance. Our goal is to find a low support point and enter. It can be referred to as buying at the pullback point. The pullback point can be found with a Fibonacci extension of 61.80%. This is a step to find entry level. 1) Find a triangle (Fibonacci Speed Fan Line) that connects the high (resistance) and low (support) points of the stock in progress, where it is continuously expressed as a Slingshot, 2) and create a Fibonacci extension level for the first rising wave from the start point of slingshot pattern.
When the current price goes over 61.80% level , that can be a good entry point, especially if the SMA 100 and 200 curves are gathered together at 61.80%, it is a very good entry point.
As a great help, tradingview provides these Fibonacci speed fan lines and extension levels with ease. So if you use the Fibonacci fan line, the extension level, and the SMA 100/200 curve well, you can find an entry point for the stock market. At least you have to enter at this low point to avoid trading failure, and if you are skilled at entering this low point, with fibonacci6180 technique, your reading skill to chart will be greatly improved.
If you want to do day trading, please set the time frame to 5 minutes or 15 minutes, and you will see many of the low point of rising stocks.
If want to prefer long term range trading, you can set the time frame to 1 hr or 1 day.
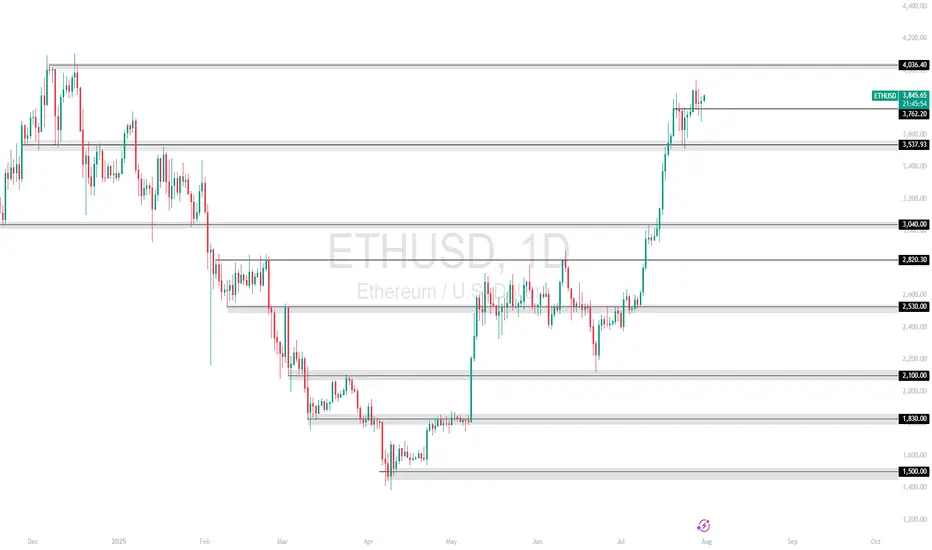
ETHUSD Key Zone Retest – Bullish Momentum Above 3,760?Price surged past the 3,537.93 and 3,762.20 zones, holding gains above both. The current daily candle shows consolidation just above the 3,760 zone after a strong impulsive move.
Support at: 3,762.20 🔽 & 3,537.93
Resistance at: 4,056.40 🔼
🔎 Bias:
🔼 Bullish: If price continues to hold above 3,762.20 and closes strongly above this zone, we may see continuation toward 4,056.40.
🔽 Bearish: A daily close back below 3,760 could open room for a deeper correction toward 3,537.93 or even 3,040.00.
📛 Disclaimer: This is not financial advice. Trade at your own risk.
SPX500USD | Retesting All-Time HighsThe index has extended its bullish rally, printing a new local high at 6,286.5 before showing signs of slight hesitation with consecutive small-bodied candles.
Support at: 6,134.5 / 6,026.0 / 5,926.2 🔽
Resistance at: 6,286.5 🔼
🔎 Bias:
🔼 Bullish: Sustains above 6,134.5 and breaks 6,286.5 for new highs.
🔽 Bearish: Break below 6,134.5 could trigger a retracement toward 6,026.0.
📛 Disclaimer: This is not financial advice. Trade at your own risk.

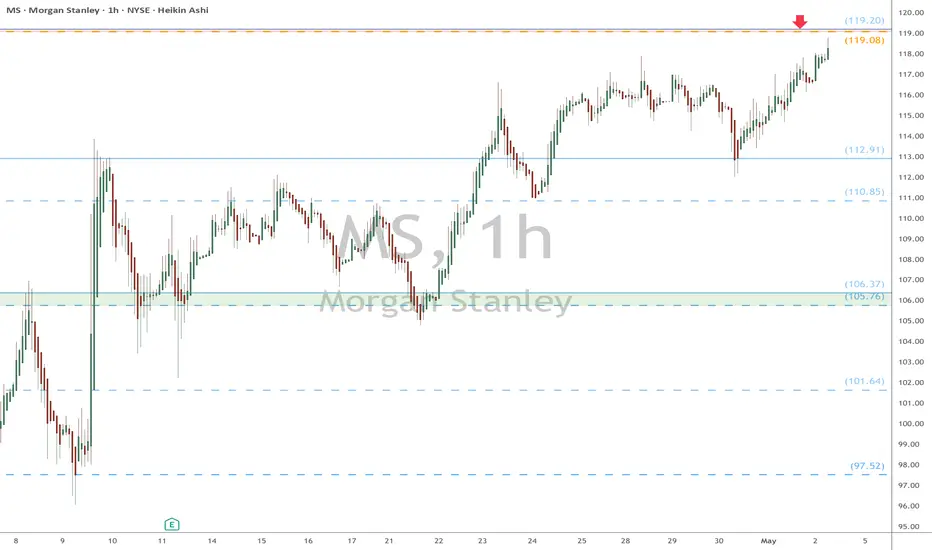
MS eyes on $119: Major Resistance may End Bounce or Strong BullMS recovering well from the tariff tantrum.
About to test a major resistance $119.08-119.20
Break would show strong bull, but dip more likely.
===========================================
.
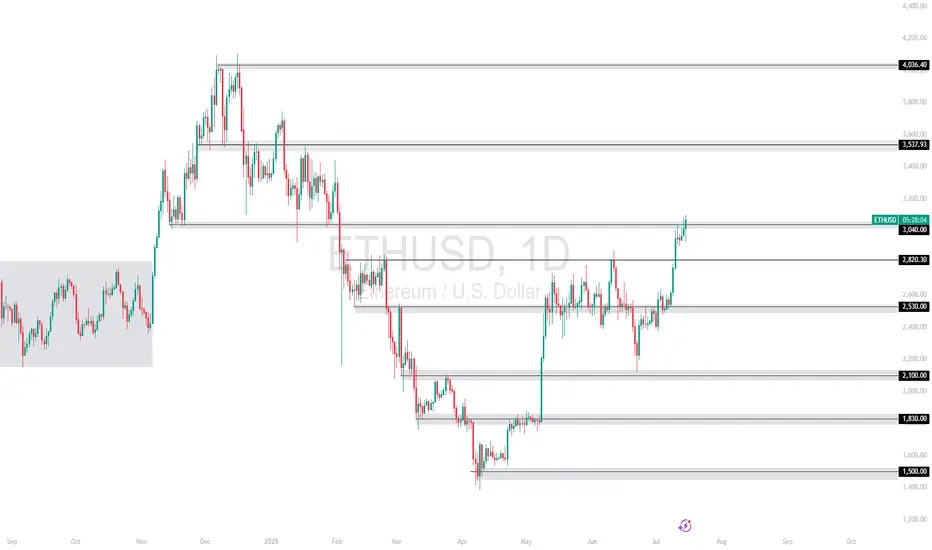
ETHUSD | Breakout Watch Above $3,040Ethereum has surged above the critical $2,530 resistance zone and is now challenging $3,040, a key structure level. A daily close above this could open the path toward $3,537 and even $4,056 in the mid-term.
Support at: 2,530 / 2,100 / 1,830 🔽
Resistance at: 3,537.93 / 4,056.40 🔼
🔎 Bias:
🔼 Bullish: Holding above 2,530 confirms breakout structure; a clean break above 3,040 targets higher zones.
🔽 Bearish: Failure to stay above 3,040 may invite a retest of 2,530.
📛 Disclaimer: This is not financial advice. Trade at your own risk.
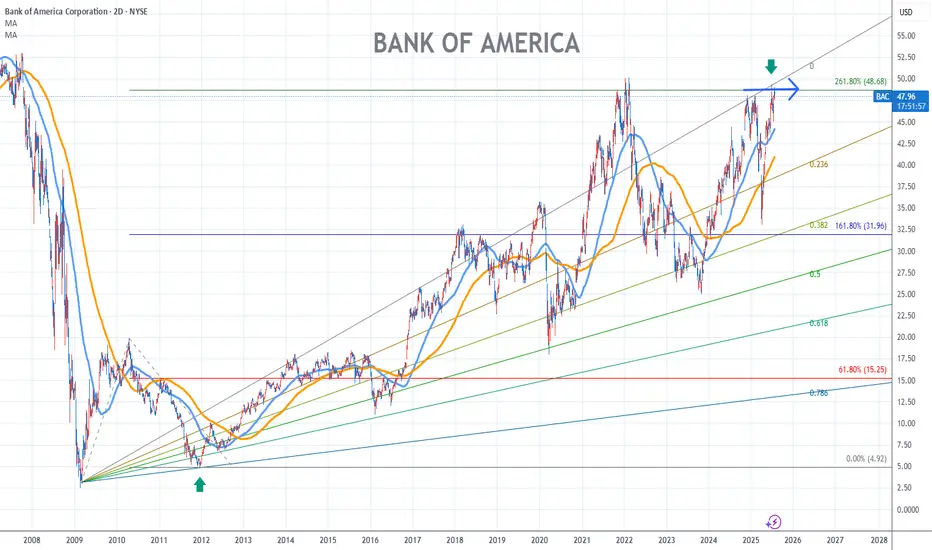
Bank of America Stock Chart Fibonacci Analysis 073025
Hit the 48.7/261.80% resistance level.
Trading Idea
Chart time frame:D
A) 15 min(1W-3M)
B) 1 hr(3M-6M)
C) 4 hr(6M-1year)
D) 1 day(1-3years)
Stock progress:E
A) Keep rising over 61.80% resistance
B) 61.80% resistance
C) 61.80% support
D) Hit the bottom
E) Hit the top
Stocks rise as they rise from support and fall from resistance. Our goal is to find a low support point and enter. It can be referred to as buying at the pullback point. The pullback point can be found with a Fibonacci extension of 61.80%. This is a step to find entry level. 1) Find a triangle (Fibonacci Speed Fan Line) that connects the high (resistance) and low (support) points of the stock in progress, where it is continuously expressed as a Slingshot, 2) and create a Fibonacci extension level for the first rising wave from the start point of slingshot pattern.
When the current price goes over 61.80% level , that can be a good entry point, especially if the SMA 100 and 200 curves are gathered together at 61.80%, it is a very good entry point.
As a great help, tradingview provides these Fibonacci speed fan lines and extension levels with ease. So if you use the Fibonacci fan line, the extension level, and the SMA 100/200 curve well, you can find an entry point for the stock market. At least you have to enter at this low point to avoid trading failure, and if you are skilled at entering this low point, with fibonacci6180 technique, your reading skill to chart will be greatly improved.
If you want to do day trading, please set the time frame to 5 minutes or 15 minutes, and you will see many of the low point of rising stocks.
If want to prefer long term range trading, you can set the time frame to 1 hr or 1 day.
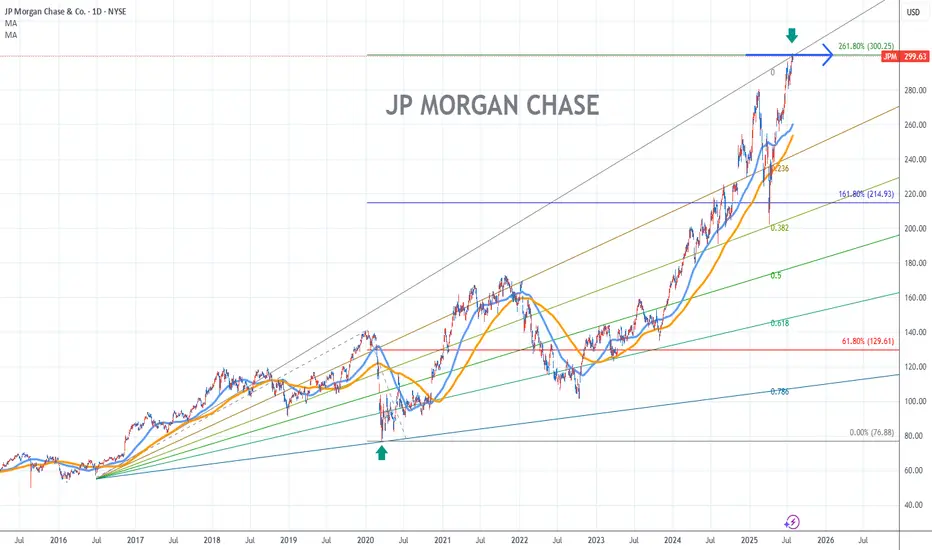
JP Morgan Chase Stock Chart Fibonacci Analysis 073025Trading Idea
Hit the 300/261.80% resistance level.
Chart time frame:D
A) 15 min(1W-3M)
B) 1 hr(3M-6M)
C) 4 hr(6M-1year)
D) 1 day(1-3years)
Stock progress:E
A) Keep rising over 61.80% resistance
B) 61.80% resistance
C) 61.80% support
D) Hit the bottom
E) Hit the top
Stocks rise as they rise from support and fall from resistance. Our goal is to find a low support point and enter. It can be referred to as buying at the pullback point. The pullback point can be found with a Fibonacci extension of 61.80%. This is a step to find entry level. 1) Find a triangle (Fibonacci Speed Fan Line) that connects the high (resistance) and low (support) points of the stock in progress, where it is continuously expressed as a Slingshot, 2) and create a Fibonacci extension level for the first rising wave from the start point of slingshot pattern.
When the current price goes over 61.80% level , that can be a good entry point, especially if the SMA 100 and 200 curves are gathered together at 61.80%, it is a very good entry point.
As a great help, tradingview provides these Fibonacci speed fan lines and extension levels with ease. So if you use the Fibonacci fan line, the extension level, and the SMA 100/200 curve well, you can find an entry point for the stock market. At least you have to enter at this low point to avoid trading failure, and if you are skilled at entering this low point, with fibonacci6180 technique, your reading skill to chart will be greatly improved.
If you want to do day trading, please set the time frame to 5 minutes or 15 minutes, and you will see many of the low point of rising stocks.
If want to prefer long term range trading, you can set the time frame to 1 hr or 1 day.
#PENGUUSDT confirms a bearish impulse📉 SHORT BYBIT:PENGUUSDT.P from $0.034625
⚡ Stop loss $0.035646
🕒 Timeframe: 4H
⚡ Overview:
➡️ A Double Top pattern BYBIT:PENGUUSDT.P has formed, signaling a bearish reversal.
➡️ The price broke the $0.0355 support and is consolidating below, confirming seller strength.
➡️ Increasing sell volume confirms bearish control.
➡️ Main focus on targets in the $0.034–0.033 zone.
➡️ The POC at $0.03113 remains the ultimate bearish objective.
🎯 TP Targets:
💎 TP 1: $0.033947
💎 TP 2: $0.033369
💎 TP 3: $0.032948
BYBIT:PENGUUSDT.P Trade Recommendations:
📢 Hold short towards the TP zones.
📢 Watch for reaction around $0.0339 — partial profit-taking possible.
📢 Invalidation if price reclaims above $0.0356.
⚠️ As long as bearish pressure holds, the price is likely to continue towards TP2–TP3.
⚠️ A recovery above $0.0356 would invalidate this setup.
🚀 The signal confirms a bearish impulse — expecting further downside!

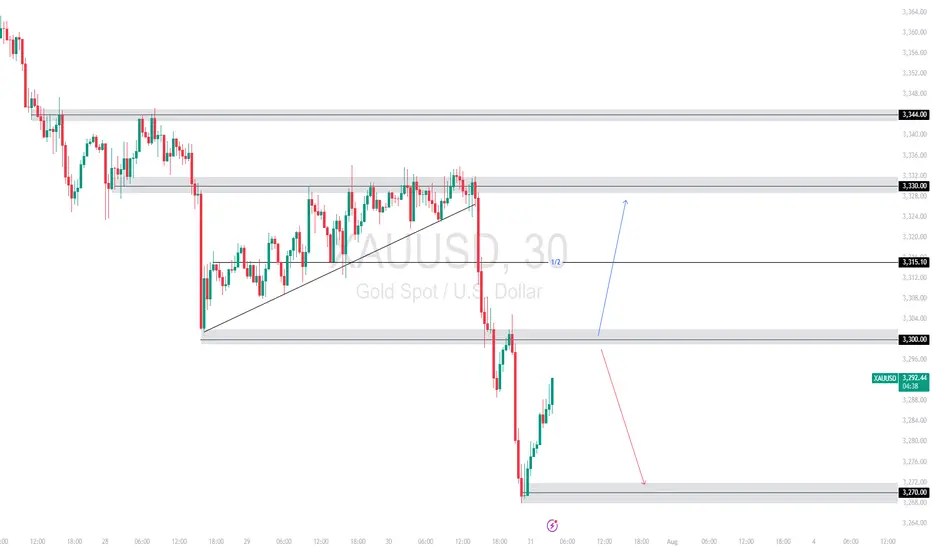
SHORT-TERM TECHNICAL ANALYSIS FOR GOLDXAUUSD broke down sharply from the 3,330 🔽 resistance zone, violating trendline support and slicing through 3,300 🔽. Price has now found temporary support at 3,270 🔽 and is attempting a retracement.
Support Levels: 3,270 🔽
Resistance Levels: 3,300 🔼, 3,315 🔼, 3,330 🔼
Bias:
🔼 Bullish: If price breaks and retests above 3,300, a push toward 3,315 or even 3,330 is possible.
🔽 Bearish: Failure to reclaim 3,300 could lead to continued downside toward 3,270 or even lower.
📛 Disclaimer: This is not financial advice. Trade at your own risk.
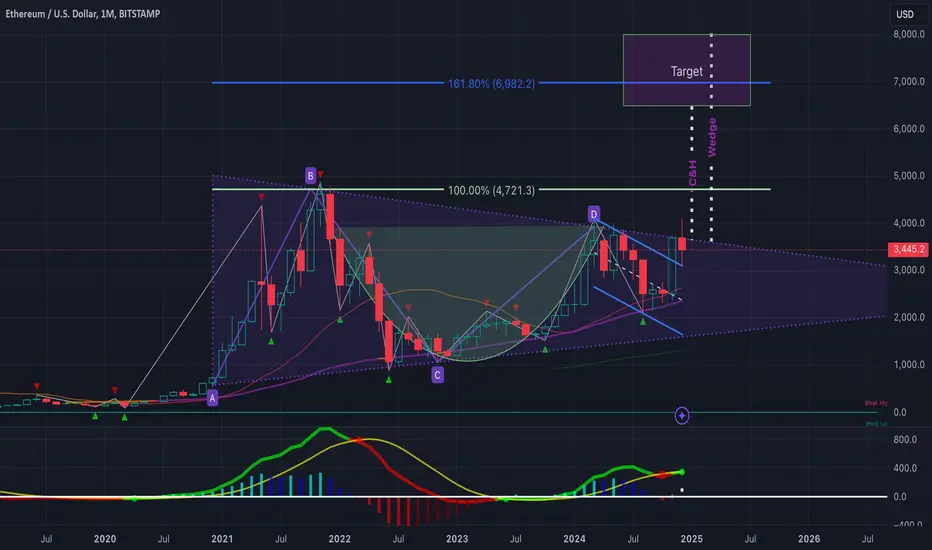
$ETH to $6.45k USD - 2024's Crescendo CRYPTOCAP:ETH is showing strong signs of an impending breakout to the $6.4k–$8k range, backed by two key technical indicators:
Cup & Handle Formation: ETH has recently broken out of a textbook cup and handle pattern, confirming the breakout with a solid retest over this past week of VOL. This is a classic bullish signal pointing to higher targets.
Bull Pennant: Since the 2021 rally, ETH has been consolidating within a massive bull pennant. This long-term structure suggests Ethereum is coiled and ready for a significant move upward.
1.618 Fib: Also layering in a Fibonacci retrace, if ETH is indeed heading for ATHs and price discovery, the 1.618 FIB is a common level that traders are very familiar with. It just so happens to be right in the middle of our target box at ~$7k!
Momentum is building— we will need to keep an eye on volume and follow-through for confirmation.
To boot, bearish sentiment for ETH is near all time highs. I think it might be time for a most-hated rally. I have a short term allocation in AMEX:ETHT to ride this momentum, NFA DYOR
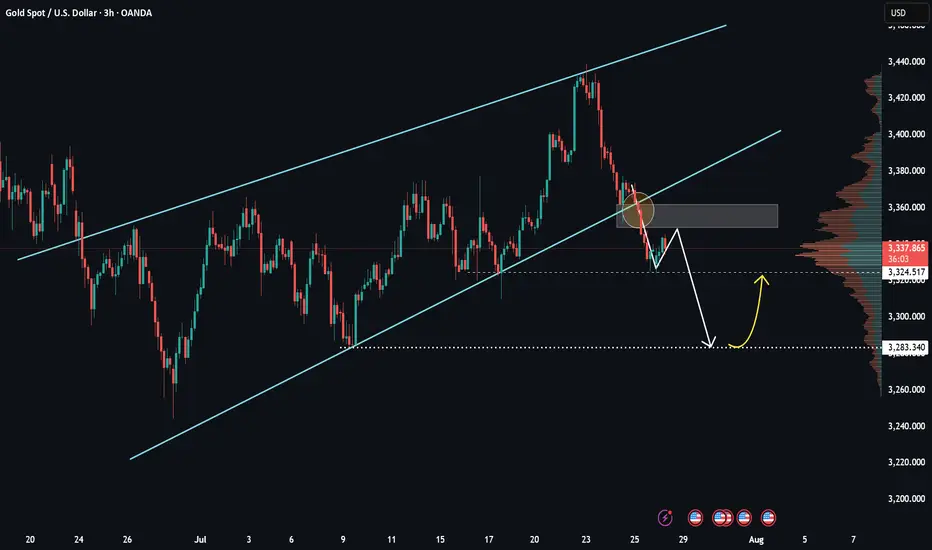
Gold Price Outlook: A Deeper Correction Ahead?Hello everyone! What are your thoughts on the current gold market?
Gold's decline is picking up speed, with the price now testing the 3,320 USD level. A stronger U.S. dollar, coupled with recent developments in the U.S.-EU trade agreement, has significantly reduced demand for gold as a safe-haven asset.
From a technical perspective, the break below the rising price channel is a key signal. It could mark the beginning of a deeper correction, as oscillators are starting to show negative momentum, indicating that the path of least resistance is now downward.
Looking ahead, all eyes will be on Wednesday’s FOMC decision. The market will be watching closely for any signs of a rate cut roadmap from the Federal Reserve, especially during Powell’s press conference. Additionally, several important U.S. macroeconomic data releases this week could provide new momentum for the USD and play a crucial role in shaping gold's next move.
What are your thoughts on where gold is heading? Let us know in the comments below!

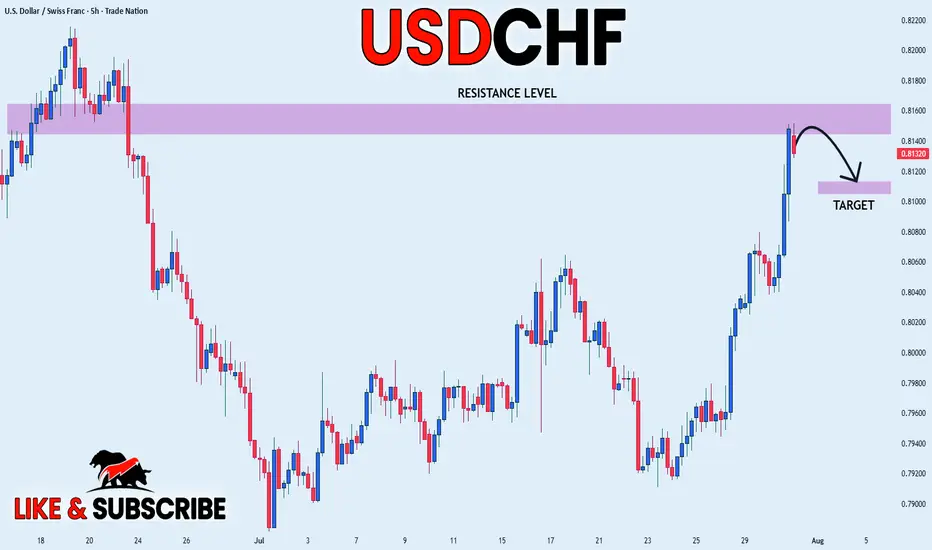
USD_CHF LOCAL SHORT|
✅USD_CHF price went up sharply
But a strong resistance level was hit at 0.8152
Thus, as a pullback is already happening
And a move down towards the
Target of 0.8113 shall follow
SHORT🔥
✅Like and subscribe to never miss a new idea!✅
Disclosure: I am part of Trade Nation's Influencer program and receive a monthly fee for using their TradingView charts in my analysis.
XAUUSD – Weak recovery, selling pressure still dominatesHello everyone! What do you think – is it time to buy or sell gold?
After clearly breaking the ascending trendline late last week, gold made a slight rebound from the 3,325 zone. However, in my view, this bounce was relatively weak and mostly technical in nature.
Currently, price is retesting a key confluence area around 3,345–3,355, which includes the previous trendline and a nearby resistance zone.
If we see a clear rejection candle form at this level, there's a high chance the price may reverse and continue its downward trend. The short-term target I’m watching is 3,300 USD – and if that level doesn’t hold, we could see stronger reactions near 3,283.
According to the VRVP indicator, volume is concentrated around lower price levels, suggesting that liquidity is still sitting near previous lows. Structurally, the market continues to form lower highs and lower lows, and with the EMA sloping downward, my primary bias remains to SELL on rallies within the trend.
Juicy 12hr Setup on $XLMUSDT
Decided to take this as a short-term play, level by level.
Already holding an initial position (see my previous CRYPTOCAP:XLM post), but this current setup was too clean to pass up.
Still believe CRYPTOCAP:XLM is one of those coins primed to finally break out of its multiyear consolidation—and I’m expecting that breakout to happen this year.
First TP at 62c, and letting the rest ride if momentum kicks in. BINANCE:XLMUSDT

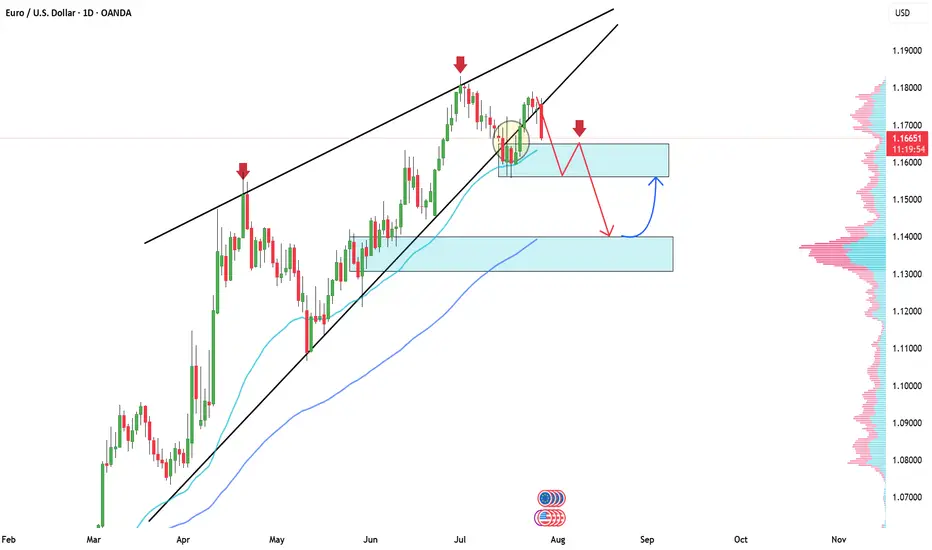
EURUSD: Buy or Sell?Dear friends!
On our 1D chart, after careful observation, we can see that a wedge pattern is forming. After EURUSD breaks out of the previous trend and completes the correction phase, a new downtrend is likely to be established.
Adam's target is to break above the 1.16000 support level and head towards the lower support level of 1.140000, which is where the pine attracts a large amount of buyers.
And you, do you think the price will go up or down? What is the target for your thinking?
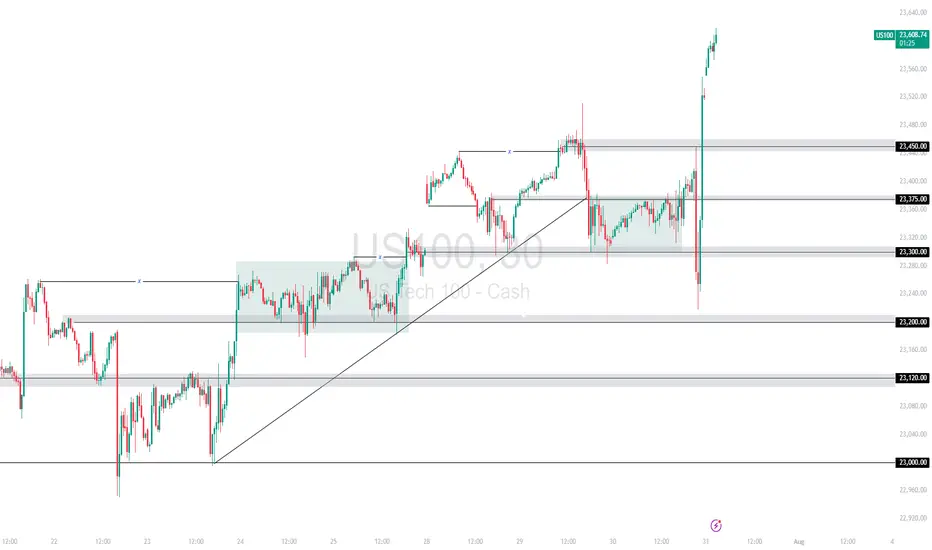
US100 Surges on Strong Fed Data and Trump Trade Deals A combination of upbeat economic data from the Fed and renewed optimism from Trump’s trade announcements fueled a powerful bullish rally on the US100. Price broke above the 23,450 🔼 resistance after reclaiming the 23,300 🔽 zone, leaving behind a strong V-shaped recovery from 23,200 🔽.
Support Levels: 23,450 🔽, 23,375 🔽, 23,300 🔽
Resistance Levels: None locally – price is printing new highs
Bias:
🔼 Bullish: Holding above 23,450 could support further upside. A clean retest may offer continuation entries.
🔽 Bearish: A drop back below 23,450 would weaken the rally and may open the path to 23,375 or 23,300.
📛 Disclaimer: This is not financial advice. Trade at your own risk.
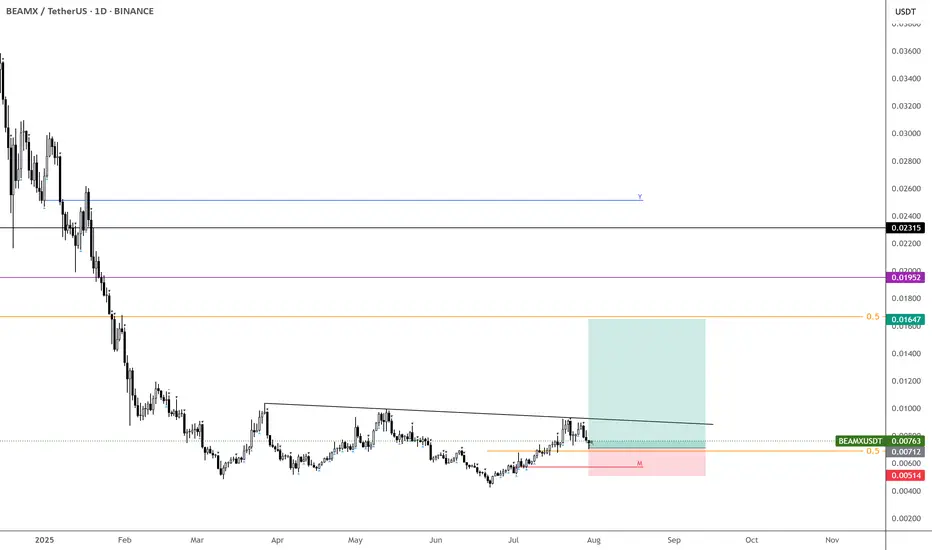
$BEAMX – Waiting for the Pop
One of those coins that’s hard not to track—when it expands, it does so aggressively.
The META sector’s been slow this year and might stay that way, with utility coins taking the spotlight this quarter, so it's key to pick your winners wisely.
That said, NASDAQ:BEAM still has a solid shot at moving higher. Buying some here and ready to adjust if it breaks above the trendline.
Targeting just above a 2x for my first offload. BINANCE:BEAMXUSDT
$POPCAT – Patience Before the Pounce
BYBIT:POPCATUSDT holding up well—expecting a move after 2 weeks of ranging.
Starting to slowly scale in around 30c and under (if you haven't already).
Will reassess if 24c is lost and stays below for too long.
Still targeting $1 if momentum kicks in.

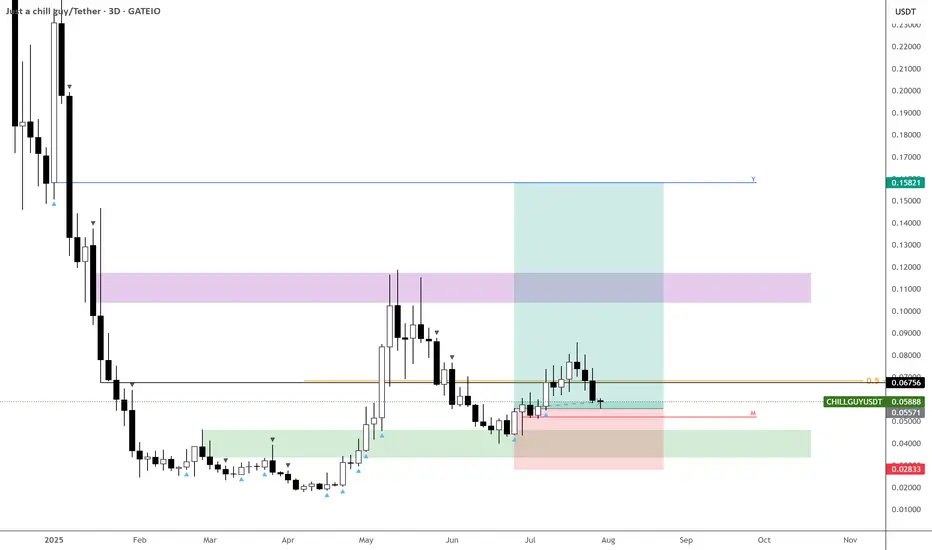
$CHILLGUYUSDT – Second Chance Before the Breakout?Getting a second chance to enter $CHILLGUYUSDT.
Price is still basing out and holding key levels—looking constructive.
I’m adding here and will continue to do so as long as this structure holds.
The path remains tilted to the upside for now.
15 cents still firmly on the horizon.
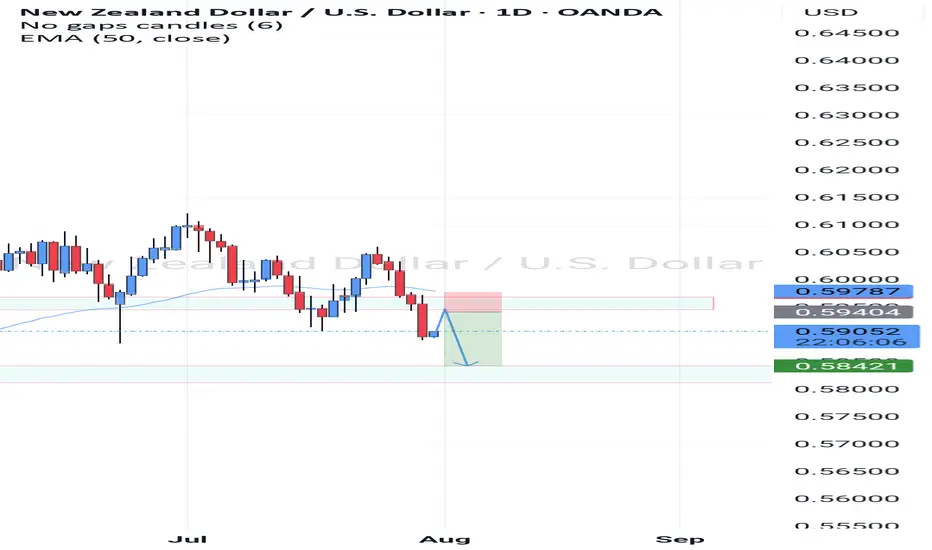
Nzdusd We are expecting price to go back to the resistance zone , we hv a head and shoulder pattern on the daily time frame so we are expecting a retracment to the neck line then we sell