USDT DOMINANCE Update (2H)After losing important levels, the price has now started to pull back, and it seems that some of the market’s major players have taken profits.
On the chart, the price faces two key levels ahead, from which it could be rejected at either one.
There is also a possibility that the price will reach the key level zone.
We are waiting for the reaction to these levels.
A daily candle close above the invalidation level will invalidate this analysis.
For risk management, please don't forget stop loss and capital management
Comment if you have any questions
Thank You
Support and Resistance

EURUSD has formed a double top patternOn the daily chart, EURUSD has formed a double top pattern. Currently, attention should be paid to the resistance around 1.1600. If the rebound does not break through, it is expected to continue to fall. The support below is around 1.1450. If it falls below, the support below is around 1.1370.

GBPUSD SELLAfter seeing the previous daily candle close bearish and the 4hr had a retrace back into the moving averages we could expect price to see further sell off into support

EURJPY ANALYSISAfter seeing the daily still pushing to the downside and breaking below key support of 171.250 we could be looking out for a retest and continuation to the down side target of 170.000

MIDWEEK FORECAST WHAT TO LOOK FOR WHEN WEARING THE MARKET LENSLess is more when you are looking for setups you can just check how am not complicating my charts yet am always finding setups everyday

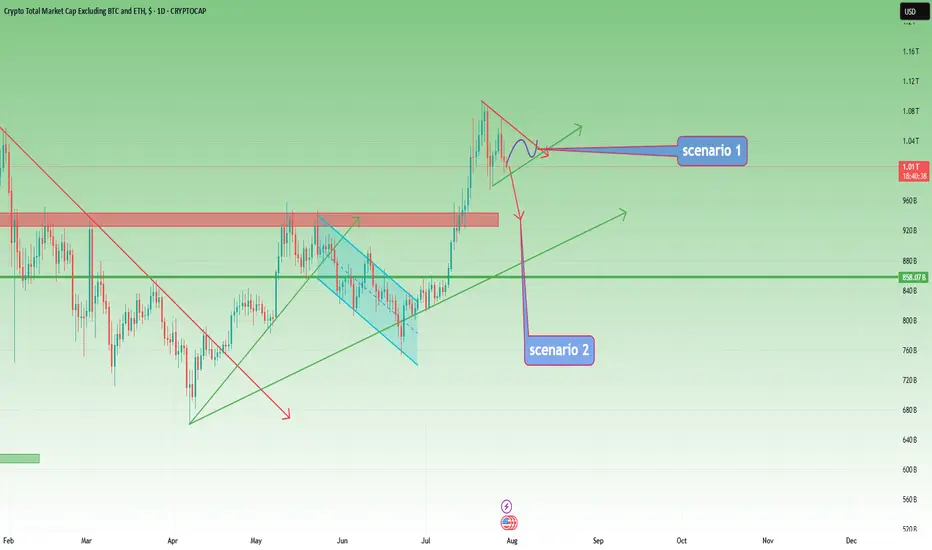
TOTAL3 – Still Bullish, But Waiting for Clarity
In my previous analysis on TOTAL3, I mentioned the high probability of a correction, but also noted that I didn’t expect the 925–940B zone to be reached.
And indeed, price reversed early — finding support around 975B before moving higher.
However, after a push up to 1.07T, the market has started to pull back again.
📊 Current Outlook – Two Scenarios I’m Watching:
Bullish Triangle:
Price may continue to consolidate into a symmetrical triangle, then resume the uptrend from there.
Deeper Pullback into Support:
The market could retest the 925–940B zone, a key support area, before bouncing back up.
⚠️ Bearish Reassessment?
Of course, if price breaks back below 925B and stays there, we’ll have to reconsider the bullish case.
But for now, the trend remains intact, and there’s no technical reason to panic.
📌 My Plan:
I already hold a bag of alts, and I’m not adding for now.
I’ll wait until the pattern becomes clearer — whether it’s a triangle breakout or a dip into support.
Until then, I’m sitting comfortably on what I already hold.
USDJPY PRICE AT RESISTANCE!Price is stuck at a resistance level of 148.198 ahead of US fed interest rate today. I from the higher timeframes (monthly and weekly) the market is still bullish. If we do get a break above the resistance level. More bullish price action will be envisaged.

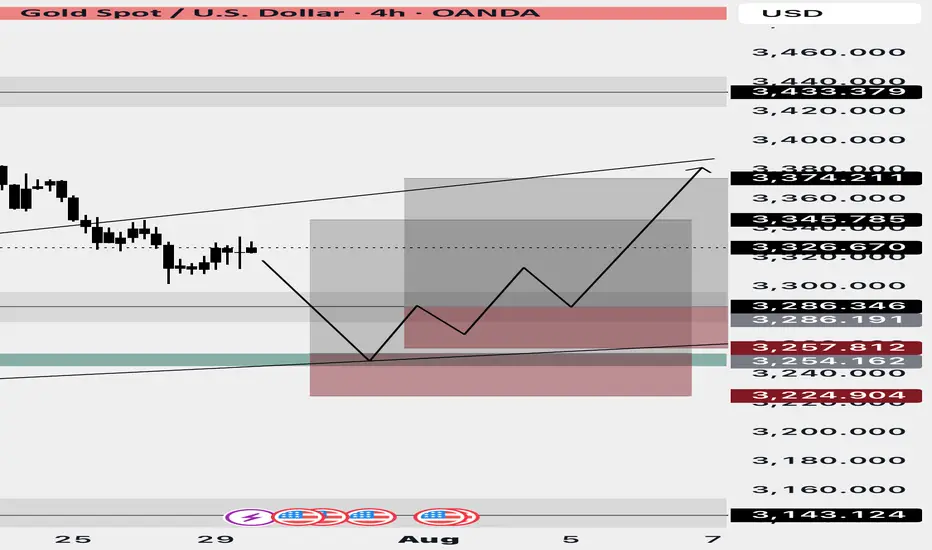
Gold loading up on buys but first, more drops!Gold is in a place where many are loading up on buys and I understand why. Gold has been taking some significant drops since pushing all time highs but check my charts and reason with me.
In the large timeframes gold still has some movement down to complete the cycle before going back for all time highs again.
Additionally it’s holding the $3388 resistance level (futures price) pretty strong on the 15 minute chart. It’s gonna be an interesting week for gold to say the least.
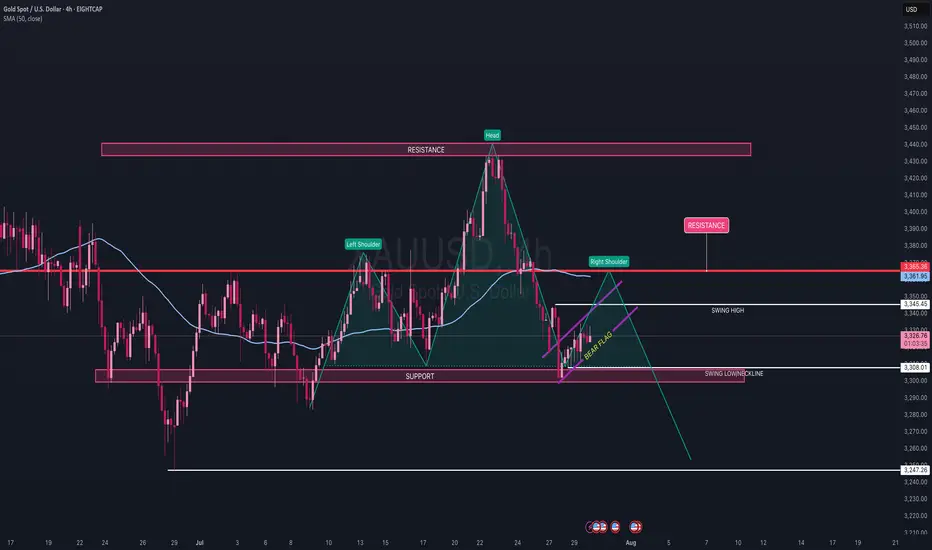
Gold (XAU/USD) 4H Timeframe UpdateGold opened the week continuing its bearish move down to the 3303 area. Since then, price has been slowly climbing, showing signs of retracement — but structure remains uncertain.
On the 4H timeframe, we’re currently forming a head and shoulders pattern (now 2/3 complete), and price action is also shaping a bearish flag, suggesting a possible continuation to the downside.
We’re heading into heavy economic news starting tomorrow morning, along with the beginning of earnings season for major assets — all of which could trigger sharp volatility in gold.
Key levels to watch:
• A break above the swing high at 3345 would suggest a bullish continuation.
• A break below the swing low at 3308 would confirm a bearish move.
• The resistance level at 3365 is a key zone to monitor — this is where I expect the right shoulder of the head and shoulders pattern to complete.
Importantly, the 50 SMA is currently traveling in line with this 3365 resistance, adding extra confluence. A break above 3365 would not only take out a strong historical level but also break above the 50 SMA, signaling potential strength to the upside. On the flip side, a rejection from this area would serve as a double rejection — from both resistance and the 50 SMA — reinforcing the bearish case.
For now, it’s a tug of war between buyers and sellers, and with the upcoming data releases, momentum could shift fast.
⚠️ As always, wait for confirmed setups, manage your risk, and only trade with a plan.
Limit risk to 1–2% of your capital per day.
could continue to trendI am still fairly new to trading. It took my quite some time to analyze this chart, it was a trend, then it became a ranged market. I had difficulty finding a support, however, i did find my middle support, it is the black line, it could possible drop there, or, it would stay in my green support

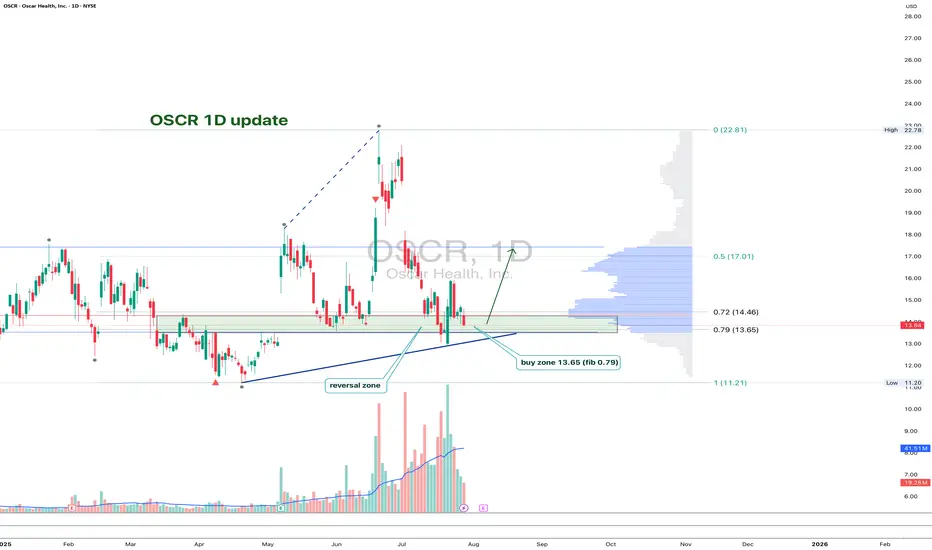
OSCR: back to support and now it’s decision timeAfter the recent impulse move, OSCR has pulled back to a key support zone around 13.65. That area aligns with the 0.79 Fib retracement, a horizontal level from spring, and a rising trendline that has already triggered reversals in the past. The structure is still intact, and buyers are testing the level again. If support holds and we get a bullish confirmation, the next target is 17.01, followed by a potential breakout toward the high at 22.81.
Volume remains elevated, the overall structure is healthy, and the correction is controlled. A break below 13.00 would invalidate the setup - until then, it’s a clean, high-reward zone with tight risk.
Fundamentally, Oscar Health has revised its 2025 guidance: revenue is expected in the $12–12.2B range, with operating losses projected between $200M and $300M. Despite softening topline growth, earnings per share are improving, and investor sentiment has been shifting. Technical strength is also reflected in the recent rise in RS Rating to 93, confirming that the stock is showing relative leadership even as the market cools.
This is one of those setups where both technicals and narrative are aligning - now we just need confirmation from the chart.
JPY at Key Zone – EURJPY & GBPJPY Could Drop 1k+ PipsExactly one year ago, the JPY Currency Index broke above the falling trendline of a falling wedge, signaling the end of a bearish cycle that had lasted nearly five years.
As is typical after long-term reversals, the reaction was sharp and fast, and the price quickly reached the first resistance target of the pattern.
Since then, the index entered a lateral phase, with clear support forming around the 730 zone.
________________________________________
🔍 Current Price Action
Recently, the price pulled back to test that same support, and at the time of writing it sits at 737, forming a tight consolidation.
This suggests we’re again at an inflection point.
________________________________________
📊 Trade Outlook
From a medium-term perspective, I believe the index is preparing for another leg higher, potentially toward resistance at 780.
➡️ That would mean a 7% rise on the JPY Index – and this move could translate into more than 1,000 pips of downside for pairs like EURJPY and GBPJPY.
________________________________________
🔄 What’s Next?
In the coming sessions, I’ll focus on these two pairs as they offer the clearest setups and have the strongest volatility.
Stay tuned — follow for the next updates. 🚀

AUDUSD InsightHello to all subscribers.
Please share your personal opinions in the comments. Don’t forget to like and subscribe!
Key Points
- According to the U.S. June Job Openings and Labor Turnover Survey (JOLTS), the seasonally adjusted number of job openings was 7.437 million, a decrease of 275,000 from the previous month, falling short of the market expectation of 7.55 million.
- During high-level talks between the U.S. and China held in Stockholm, Sweden, both sides reportedly agreed to extend the tariff suspension measure for an additional 90 days.
- While the Federal Reserve is expected to hold rates steady in the July FOMC meeting, there is growing anticipation for a dovish stance suggesting a possible rate cut in September.
This Week's Major Economic Events
+ July 30: Germany Q2 GDP, U.S. ADP Nonfarm Employment Change (July), U.S. Q2 GDP, Bank of Canada rate decision, FOMC meeting results announcement
+ July 31: Bank of Japan rate decision, Germany July Consumer Price Index (CPI), U.S. June Personal Consumption Expenditures (PCE) Price Index
+ August 1: Eurozone July CPI, U.S. July Nonfarm Payrolls, U.S. July Unemployment Rate
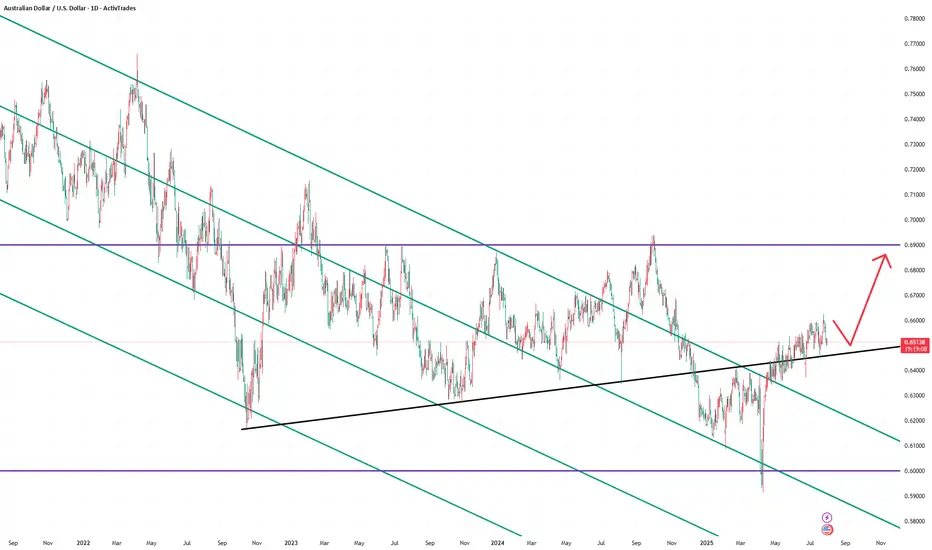
AUDUSD Chart Analysis
The pair recently climbed above the 0.66000 level but has since reversed, giving back gains. However, both higher highs and higher lows are being established, suggesting the current pullback is part of a gradual uptrend. A continued bullish outlook is expected over the long term, with a projected high around the 0.69000 level.
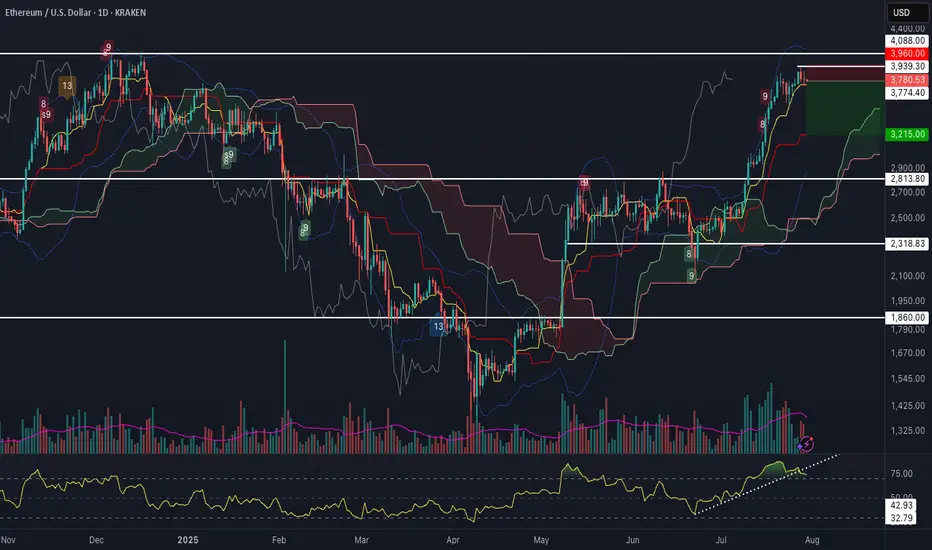
ETH Potential Swing ReversalAfter a strong leg higher, Ethereum is flashing a confluence of short-term reversal signals:
1. RSI trendline break on the daily, with bearish divergence building
2. %B Bollinger Band divergence, following three consecutive upper band taps during this move
3. Demark 9
4. Formation of a Doji candle at resistance, showing indecision near a key level
A clean break here opens room towards Ichimoku cloud support at $3,215.
🧠 Thoughts welcome!
Crude oil starts to rise, are you ready?
💡Message Strategy
Oil prices continued their upward trend amid rising geopolitical risks. US President Trump recently issued a tough statement, demanding Russia end the conflict with Ukraine within 10 to 12 days or face secondary sanctions.
Fears that Russian crude oil exports might be disrupted pushed Brent crude oil prices close to $70 per barrel, marking their largest single-day gain in two weeks at 2.3%. Meanwhile, US West Texas Intermediate (WTI) crude oil prices also remained stable around $67.
The intertwined uncertainties of geopolitics and trade policy have complicated market sentiment. Besides the situation between Russia and Ukraine, investors are closely watching the August 1st trade policy deadline set by the United States and the upcoming OPEC+ meeting in early August, which will determine its September crude oil production increase plan.
The industry generally expects that despite tight crude oil inventories in some parts of the world and strong peak season consumption in the Northern Hemisphere, if OPEC+ continues to increase production, oversupply pressure will gradually emerge by the end of the year.
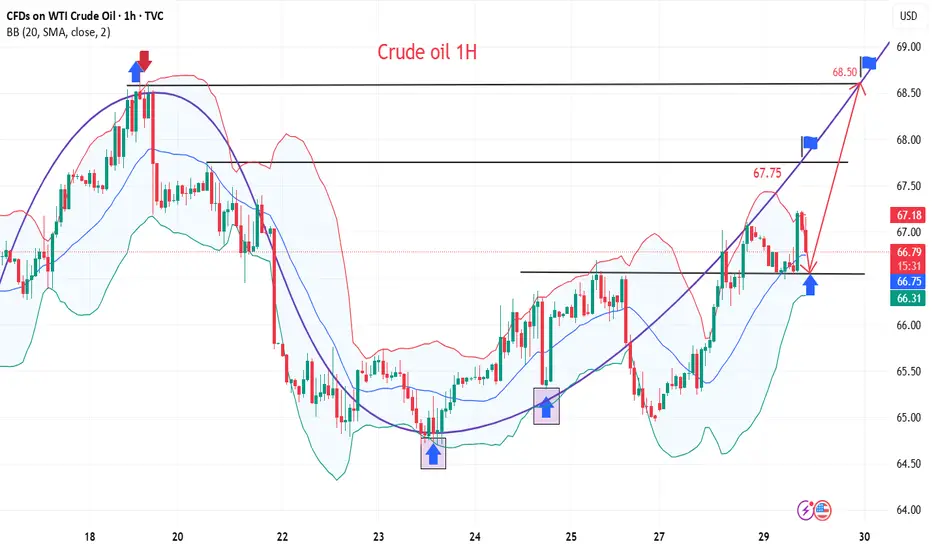
📊Technical aspects
From a technical perspective, the daily chart of US crude oil (WTI) shows a modest upward trend. The current price is trading steadily above its 100-day moving average, indicating continued bullish momentum.
The Relative Strength Index (RSI) remains between 55 and 60, remaining within overbought territory, suggesting further upside potential. A successful break above the key resistance level of $68.50 would open up opportunities towards $70.
💰Strategy Package
Long Position:66.50-67.00,SL:65.50,Target:68.50-69.00
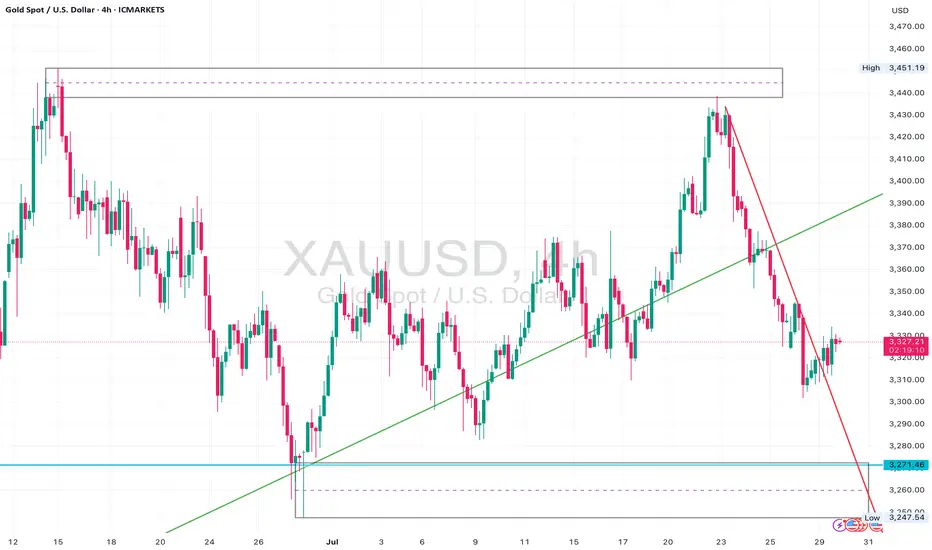
Gold Bear Flag Forming After Trendline Break – Short Setup BelowGold (XAUUSD) recently broke a major ascending trendline that had held since late June, leading to an aggressive sell-off from the $3,440s down to the $3,270 zone.
Following that, price is now consolidating just beneath the previous support trendline, forming what appears to be a bear flag or rising channel inside a corrective structure.
The $3,330–$3,340 zone is now acting as resistance, and price is struggling to close above this level.
The current structure suggests continuation to the downside, with clean space to revisit the $3,271 liquidity pool and potentially even sweep that low.
Watch for bearish confirmation below the current flag – especially if price prints a rejection wick or engulfing candle at the upper edge of the box.
⸻
Key Levels:
• Resistance: $3,330 – $3,340 (flag top + previous support turned resistance)
• Support: $3,271 zone, followed by $3,248 sweep potential
⸻
Trigger Criteria:
• Bearish rejection inside the flag (e.g. pin bar or engulfing)
• Break and retest of the flag bottom or horizontal support
⸻
Risk Note:
A clean break back above $3,350 and reclaim of the previous trendline would invalidate this idea short term and shift bias back to neutral/bullish.
Why Did Novo Stock Fall So Sharply YesterdayNovo Nordisk shares plunged nearly 20–23% on July 29, 2025, marking its worst trading day since Black Monday in 1987.
Significant Downgrade of 2025 Financial Outlook
The company revised its sales growth forecast for 2025 down to 8–14%, from its prior guidance of 13–21%, and reduced expected operating profit growth from 16–24% to 10–16%. This adjustment was attributed to weaker-than-expected demand for Wegovy and Ozempic, and rising competitive pressures
#TheWallStreetJournal
I will start my accumulation using DCA, but will be happier to start buying this stock heavily from $47 zone.
trade with care.
I look forward to connecting with you

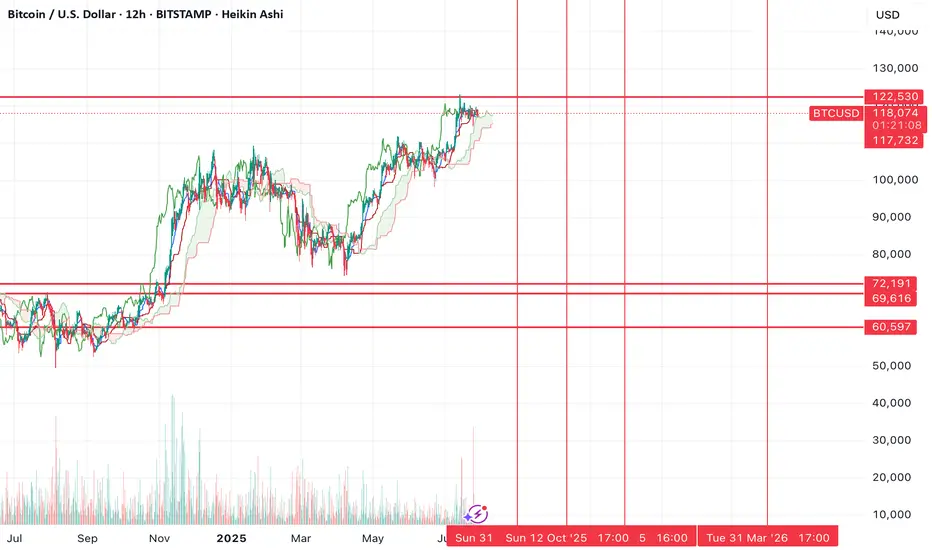
BTC highs in, new lows coming soon?~$122.5k was the top of the range. Now we'll need to go test the lows before we can continue higher.
Alts are clearly not confirming a trend change .
Many still bearish on HTFs (including ETH), I think the reason is because Bitcoin goes lower before we see a continued run and that will drag down alts with it. I think people holding alts here with hopes for new highs (in the near future) are about to have their hopes crushed, that also goes for people long crypto miners.
I don't think the real run starts until end of 2025 or 2026.
Time will tell.
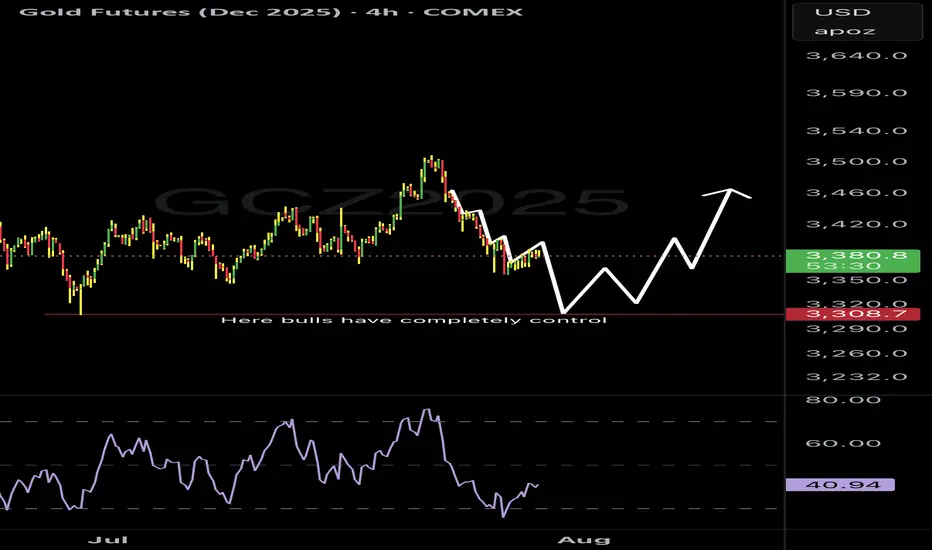
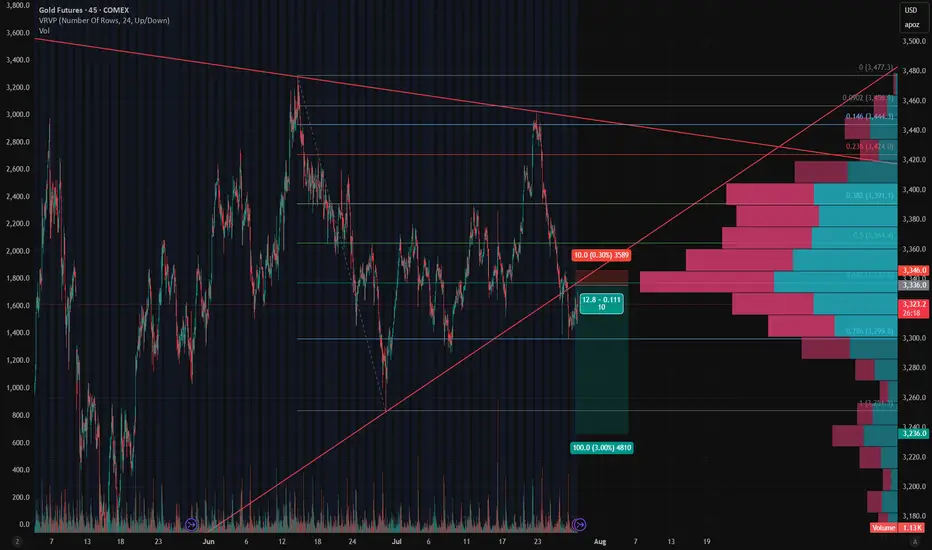
Gold - Short Setup Off Major Trendline Rejection📉 Gold - Short Setup Off Major Trendline Rejection
Gold has broken down through the rising trendline and is now retesting it — the moment of truth! 🧐
🔻 Short Entry: 3,336
🎯 Target: 3,236 (Fib 1.0 + HVN gap fill)
🛑 Stop: 3,346 (Above trendline retest)
⚖️ Risk/Reward: ~1:10
📊 Bonus: High volume node above adds resistance. Bearish volume profile structure confirms the breakdown bias.
Watching for volume to pick up on the move down. Let's see if GC bleeds into August. 🩸📆
XAGUSD | Silver Rebounds from 37.50 After 39.50 RejectionSilver pulled back sharply after failing at the 39.50 resistance zone. Price is currently consolidating just above the 37.50 support area, which has held firm on the initial retest.
Support at: 37.50 / 37.00 🔽
Resistance at: 39.50 🔼
🔎 Bias:
🔼 Bullish: A clean breakout above 39.50 could resume the uptrend.
🔽 Bearish: A break below 37.50 opens room toward 37.00 and 36.00.
📛 Disclaimer: This is not financial advice. Trade at your own risk.

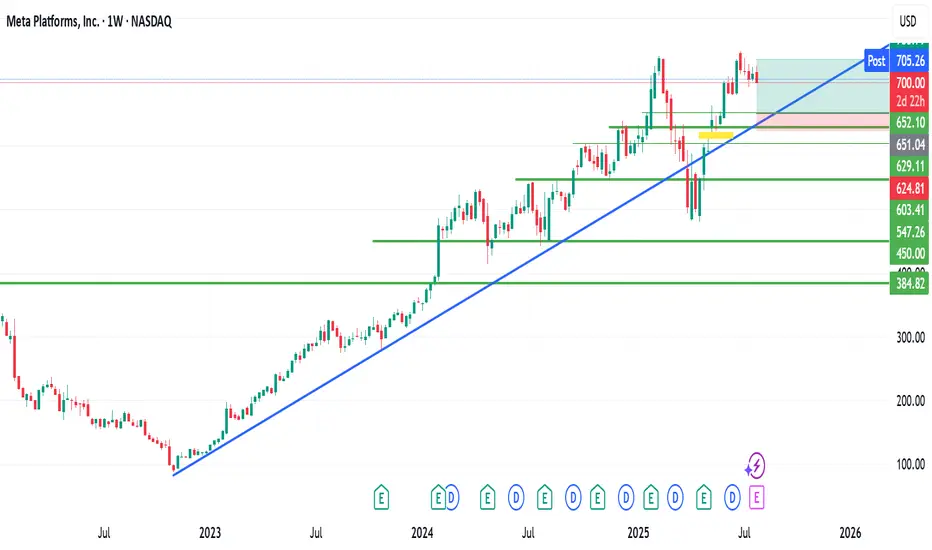
Is this possible with METAIs this possible with META?
META stock is currently trading at $700.
My technical view as shown on the chart, is looking at a possible retracement to around $650.
The question is ''Is this possible?
If it ever gets to this forecasted zone, I will accumulate massively.
Nikkei 225 Wave Analysis – 29 July 2025- Nikkei 225 reversed from the resistance zone
- Likely fall to support level 40000.00
Nikkei 225 index recently reversed from the resistance zone between the resistance levels 42000.00 (which started the sharp sell-off in 2024) and 41285.00.
This resistance zone was further strengthened by the upper daily and the weekly Bollinger Bands.
Given the strength of the aforementioned resistance zone and the overbought weekly Stochastic, Nikkei 225 index can be expected to fall to the next round support level 40000.00.

XAUUSD BUYS PROJECTION Hey everyone wow is been long since I posted here I can say for sure trading has never been so tougher for me cuz am tryna refine my edge and I miss posting and sharing my ideas here so this is my analysis on Gold after seeing Gold rejected a strong resistance zone and price keeps pushing down tho I missed the sells but market is always full of opportunity and here are my zones to take buys from,mind you these zone are very strong support zones that mostly buyers get in the market so I will be waiting for price to get to the first zone which is the green and the second is for scaling in after placing the first on breakeven and yes I will update you guys…..