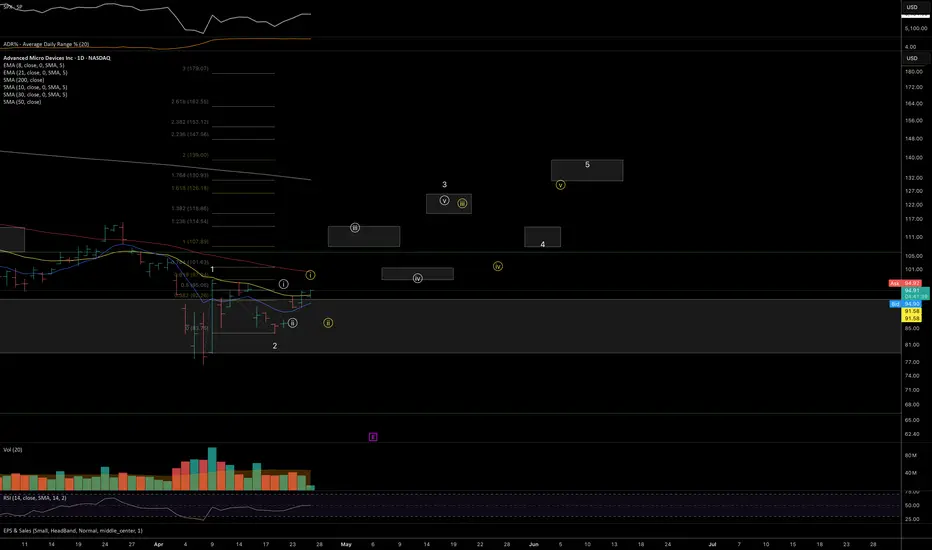
AMD: Potential Mid-Term Reversal from Macro SupportPrice has reached ideal macro support zone: 90-70 within proper proportion and structure for at least a first wave correction to be finished.
Weekly
As long as price is holding above this week lows, odds to me are moving towards continuation of the uptrend in coming weeks (and even years).
1h timeframe:
Thank you for attention and best of luck to your trading!
Support and Resistance
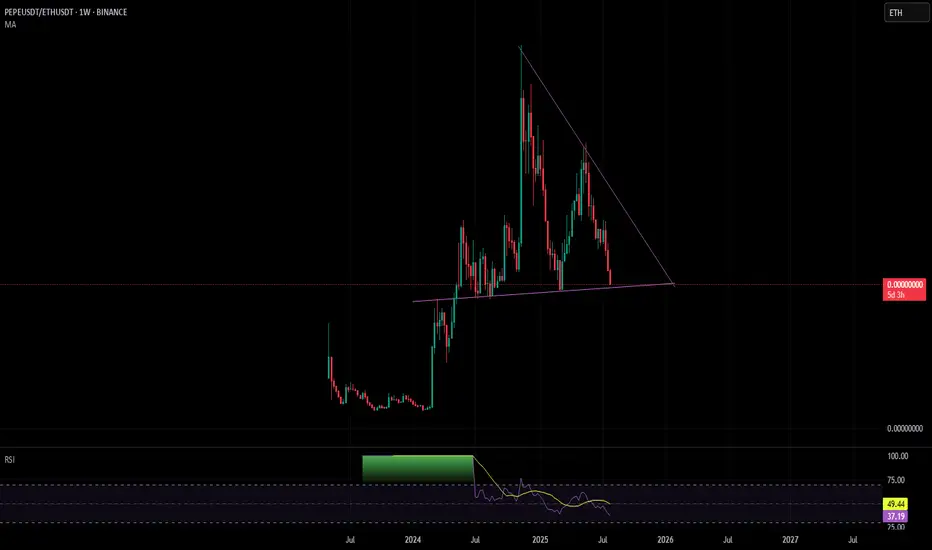
PEPE/ETH Weekly longPEPE against ETH is nearing a nice support level,
I will buy PEPE here and sell it at the tops against ETH to gain more ETH
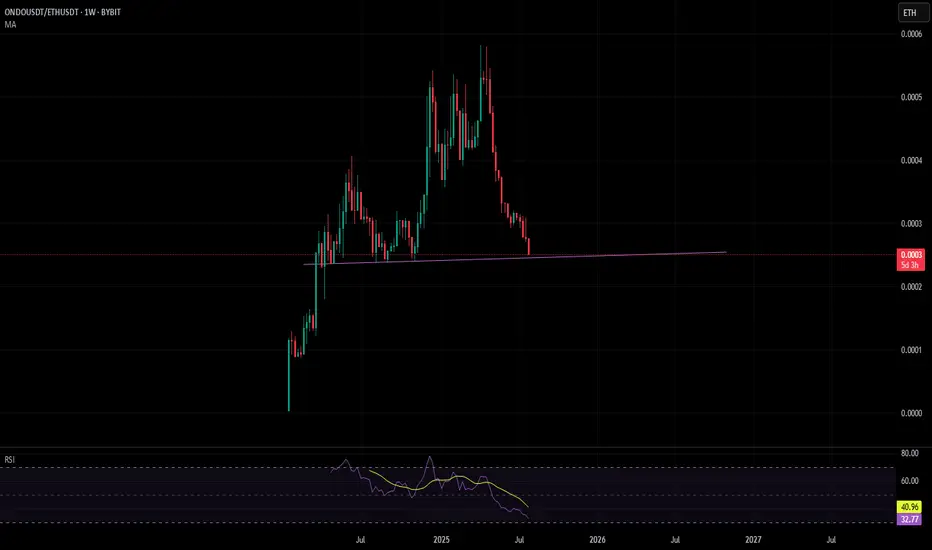
ONDOETH WeeklyOndo-ETH is nearing a nice clean support level.
I will buy ondo here and sell it at the top against ETH
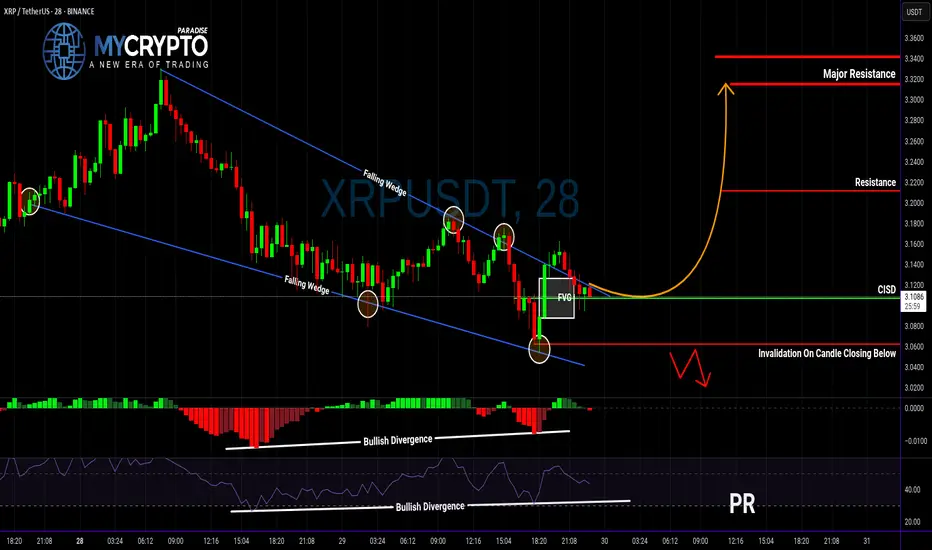
XRP Breakout Could Be a Trap… Or the Start of Something Big?Yello, Paradisers — are you about to buy into a fake breakout or position yourself right before a major move? Let’s break it down before emotions take over.
💎XRPUSDT has officially broken out of a falling wedge — a classic bullish reversal structure. What makes this breakout even more interesting is that it's supported by bullish divergence on both MACD and RSI, plus a Change In State of Delivery (CISD). All these technical signals combined significantly increase the probability of a bullish continuation.
💎Now, if you’re a disciplined trader looking for a safer entry with a higher risk-to-reward ratio, the smart move is to wait for a potential pullback to the CISD level. That would set up an opportunity offering a risk-to-reward of over 1:2.55 — not something you want to ignore.
💎But don’t get too comfortable…
💎If the price breaks down and closes below our invalidation level, the entire bullish idea is off the table. In that case, it’s wiser to stay patient and wait for clearer price action to develop. No emotional entries — only strategic moves.
🎖Strive for consistency, not quick profits. Treat the market as a businessman, not as a gambler. That’s how you’ll get inside the winner circle.
MyCryptoParadise
iFeel the success🌴
Dow Jones Wave Analysis – 29 July 2025
- Dow Jones reversed from the long-term resistance level 45000.00
- Likely fall to support level 44000.00
Dow Jones index recently reversed down from the resistance zone between the long-term resistance level 45000.00 (which has been reversing the price from the end of 2024) and the upper daily Bollinger Band.
The downward reversal from this resistance zone created the daily Japanese candlesticks reversal pattern, Bearish Engulfing.
Given the strength of the resistance level 45000.00 and the bearish divergence on the daily Stochastic, Dow Jones index can be expected to fall to the next support level 44000.00 (which reversed the price earlier in July).

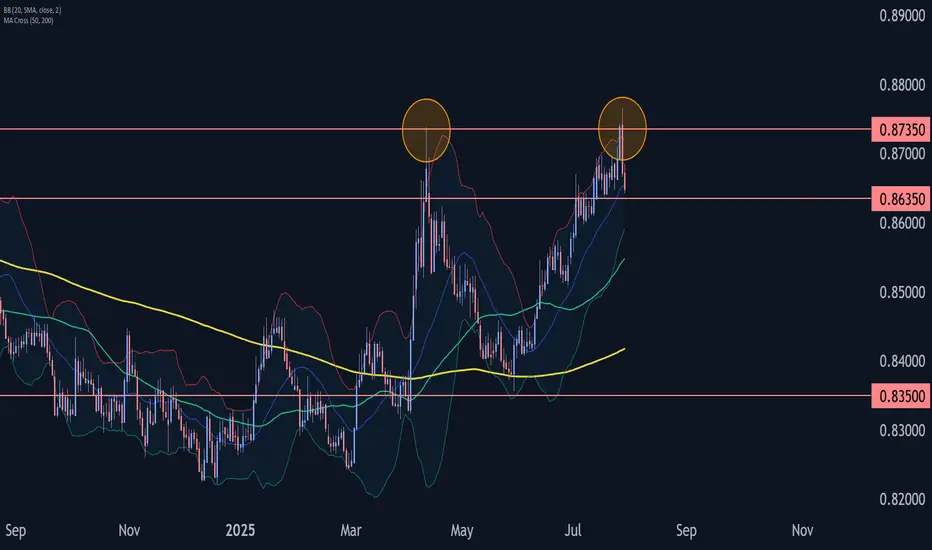
EURGBP Wave Analysis – 29 July 2025- EURGBP reversed from the resistance zone
- Likely fall to support level 0.8635
EURGBP currency pair recently reversed down from the resistance zone between the multi-month resistance level 0.8735 (which stopped sharp wave (A) in April) and the upper daily Bollinger Band.
The downward reversal from this resistance zone created the daily Japanese candlesticks reversal pattern Dark Cloud Cover.
Given the strength of the resistance level 0.8735, EURGBP currency pair can be expected to fall to the next support level 0.8635 (low of the previous minor correction ii).
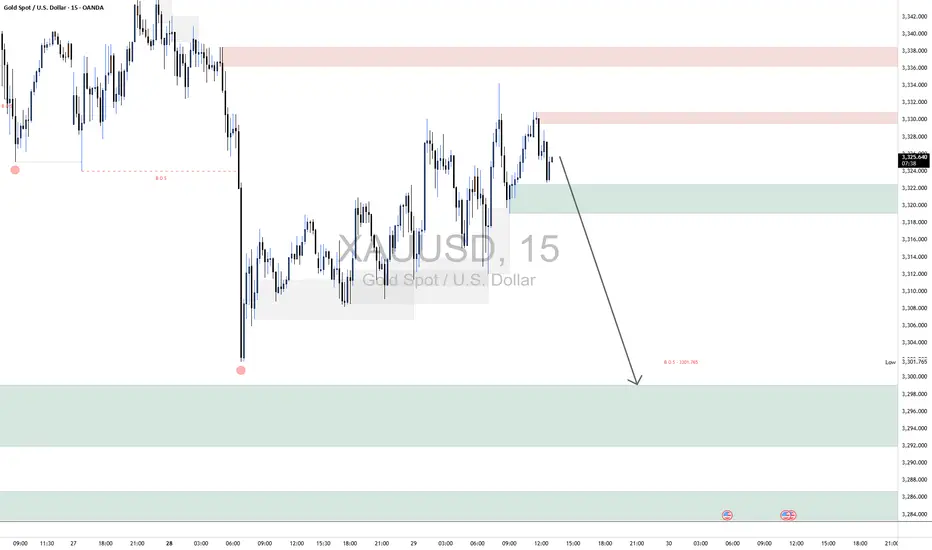
XAUUSD Short1. Market Structure Overview
The overall market structure on this 15-minute chart is bearish. A clear Break of Structure (BOS) occurred at $3,307.765, confirming that previous support failed and sellers are in control. After the BOS, price formed a lower high near $3,328, maintaining bearish momentum and setting the stage for potential continuation downward.
2. Supply & Demand Zones
The chart reveals two notable supply zones where sellers have been active. The first is a minor zone just above the current price, which has already triggered a rejection and shows signs of short-term bearish control. The second, positioned higher, marks the origin of a strong sell-off and represents a significant resistance level. On the demand side, the closest support zone lies just beneath the current price, but it appears weak due to prior tests. A stronger demand zone is located further down, where price previously saw an aggressive bullish reaction, indicating solid buyer interest. If bearish momentum continues, price may drop even lower into a deeper liquidity pocket—an area likely to attract strong institutional buying.
3. Price Action within the Current Region
Price is currently hovering around $3,325, inside a narrow range between the minor supply and weak local demand. After rejecting the upper supply zone, price is showing bearish intent. If the market maintains this rejection pattern, a drop toward the $3,293–$3,301 demand area is likely. This zone is expected to offer a bounce or at least temporary reaction due to the strong response seen there previously.
4. Trade Bias & Plan
The active bias is bearish. Short opportunities are favored while price remains below $3,328. Ideal short entries are from the rejection of the minor supply zone, targeting $3,301 and possibly $3,293. A clear break and hold above $3,329 would invalidate the short bias and shift focus toward higher liquidity levels. Until then, structure supports downside continuation.
5. Momentum & Confirmation
Momentum is currently favoring sellers. The lower highs and strong rejections near supply reinforce the bearish bias. Confirmation for continuation comes from bearish engulfing candles and sharp rejections from supply zones. A clean break below the nearest demand zone would further validate the move toward deeper targets.
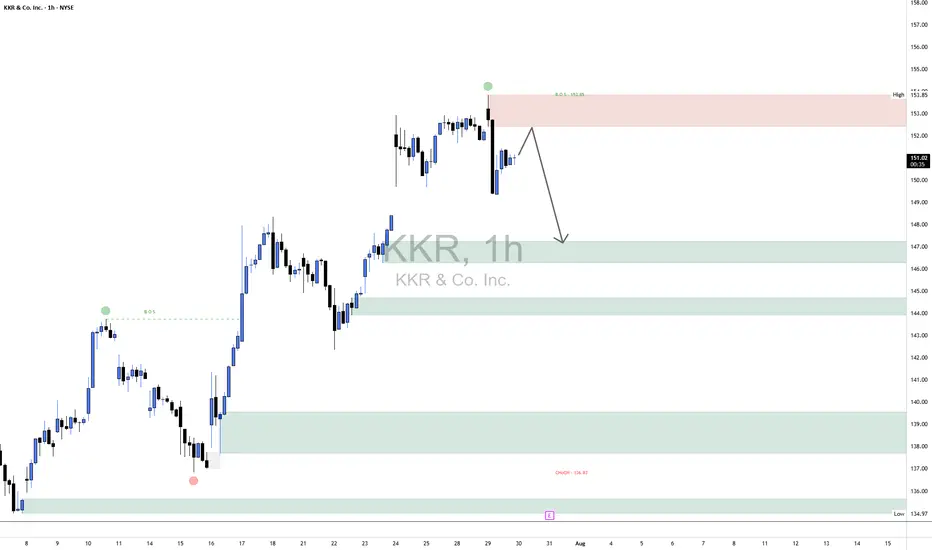
KKR Short1. Market Structure Context
Trend Prior to CHoCH: Bullish structure with higher highs and higher lows.
CHoCH (Change of Character): Occurred at $136.83 — a key higher low broke, indicating a possible trend reversal from bullish to bearish.
BOS (Break of Structure): Confirmed at $153.85, marking a shift to lower highs and supporting bearish continuation.
2. Key Supply & Demand Zones
🟥 Supply Zone (Resistance):
$153.05 – $153.85
Price previously distributed here before dropping.
Acts as a liquidity trap for late buyers and resistance for pullbacks.
🟩 Demand Zones (Support):
Zone 1: $147.00 – $148.00 → Minor demand; short-term reaction likely.
Zone 2: $144.50 – $146.00 → Historical pivot with volume; moderate demand.
Zone 3: $138.00 – $142.00 → Consolidation base; strong prior bullish impulse.
Zone 4: $134.00 – $137.00 → Final defense; includes the CHoCH at $136.83 and expected reaction if deeper retracement occurs.
3. Current Price Action (Bordered Region Focus)
Price currently trades around $151.06, beneath the key supply zone.
The market rejected supply and showed a bearish reaction.
Expectation: A pullback to ~$153 may occur, targeting trapped liquidity, before resuming bearish movement.
Next targets:
Primary: $147.50 (Demand Zone 1)
Secondary: $144.50 if breakdown intensifies.
XLU Long1. Market Structure Overview
A notable Change of Character (CHoCH) occurred at 84.09, breaking below a prior higher low and signaling a shift from bullish to bearish momentum. This was followed by a clear Break of Structure (BOS) at 83.40, confirming the bearish sentiment and initiating a new lower low sequence.
2. Supply and Demand Zones
Supply Zones (Resistance):
85.00–85.55: Strongest supply zone where multiple bearish rejections originated.
84.75–85.00: Closest overhead supply zone—price is expected to react if it reaches this area.
Demand Zones (Support):
84.00–84.20: Local demand that initiated the recent bullish push; possible short-term support.
83.10–83.40: Major demand zone that sparked the latest upward move; strong buyer interest observed.
3. Current Price Action & Expectation
Price is currently trading at 84.46, moving upward from the 84.00–84.20 demand zone. The near-term outlook suggests a continued push toward the 84.75–85.00 supply zone. If price can decisively break above 84.99, bullish momentum could extend toward 85.30–85.55.
However, if price rejects from 84.75–85.00, a pullback into 84.00–84.20 is expected before another attempt higher. A breakdown below 84.00 would open downside risk toward the stronger demand at 83.10–83.40.
4. Momentum & Risk Outlook
Momentum is gradually shifting bullish after forming a swing low near 83.40. Maintaining structure above that level is crucial for a bullish continuation. Watch for a clean break and retest of the CHoCH level at 84.99 to confirm strength.

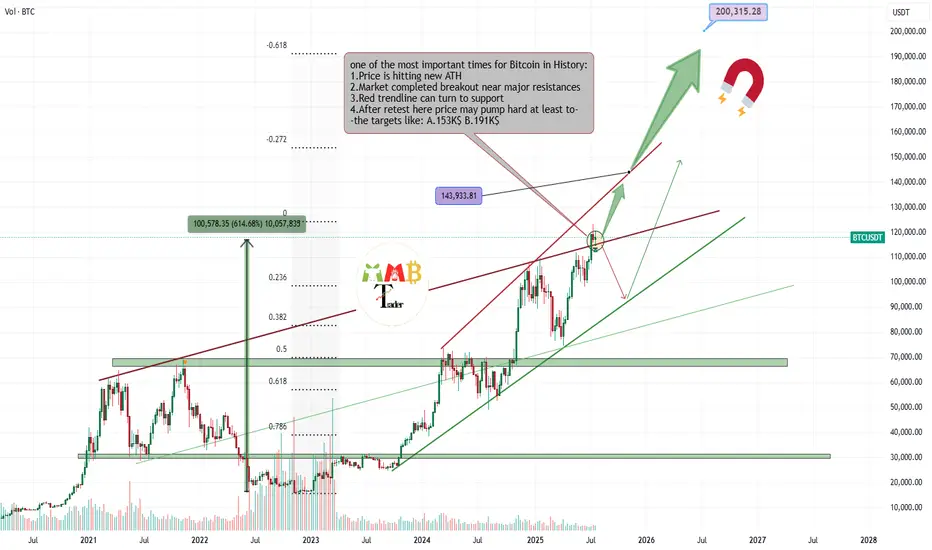
Bitcoin is getting Ready for 143K$ nowMajor red resistance trendline is now broken also last week the retest is completed now price is range for a while for new week to start and fresh volume and buys that make path easier to reach above 140K$.
Get ready and take a look at important zones at chart and possible scenarios which are all mentioned.
DISCLAIMER: ((trade based on your own decision))
<<press like👍 if you enjoy💚
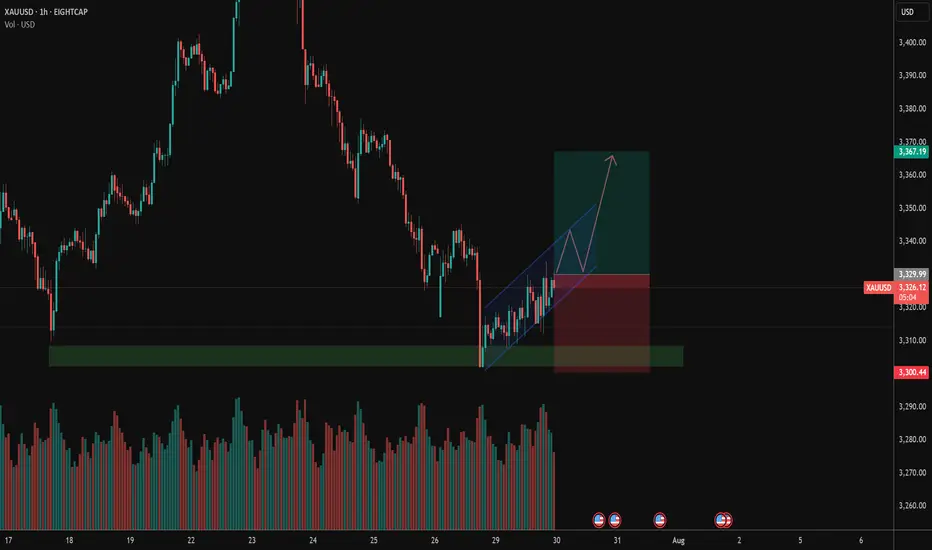
GOLD awaiting confirmation of a bullish zone formation.Gold has confirmed support at 3310, with the price rebounding and returning to the buying side. We are now awaiting confirmation of a bullish zone formation.
Gold remains under pressure ahead of key market-moving events, including the US GDP data release and the Federal Reserve’s interest rate decision. However, the pause in Dollar strength is offering some support to the gold price. As long as the price holds above this level, the bullish scenario remains valid. A sustained move above this zone may open the path toward the next resistances: 3360 / 3385 we can expect Growth more.
You May find more Details in the Chart.
Trade wisely best of Luck Buddies.
Ps: Support with like and comments for more insights Thanks for Supporting.

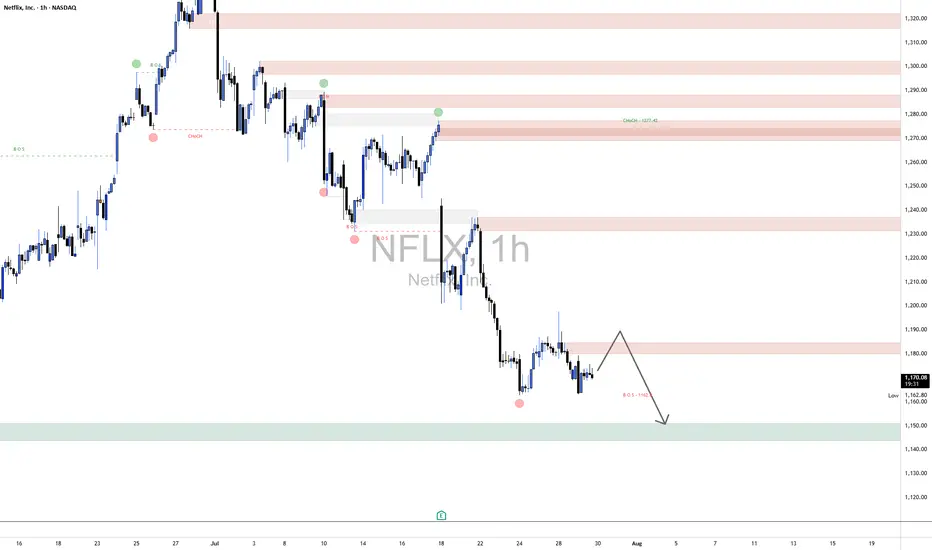
NFLX Short1. Market Structure Overview
The broader market structure has shifted bearish following a Change of Character (CHoCH) around 1277.42, where price broke below a prior higher low, suggesting a possible trend reversal. This was later confirmed by multiple Breaks of Structure (BOS) at lower levels, especially the key BOS at 1162.8, which solidified bearish intent. Each BOS has been followed by continued selling, showing strong bearish momentum and weakening buyer control.
2. Supply and Demand Zones
Several major supply zones (resistance) are present, especially at 1340–1330, 1300–1290, 1277–1260, and most immediately at 1185–1175, where price is currently reacting. These zones have previously shown strong rejections and are likely to cap bullish retracements.
On the demand side (support), the primary demand zone lies at 1130–1110, which acted as a prior accumulation base. A deeper demand area also exists near 1100–1090, which could serve as a last-resort support if price breaks lower.
3. Price Action Within Key Border
Currently, price is hovering around 1173.99, inside the lower supply zone of 1185–1175. The structure suggests a potential short-term retracement to this zone before continuation lower. If price rejects here again, the expectation is for a move toward the 1130–1110 demand zone. However, a strong breakout and hold above 1185 could open the path for retesting higher supply levels like 1225–1245.
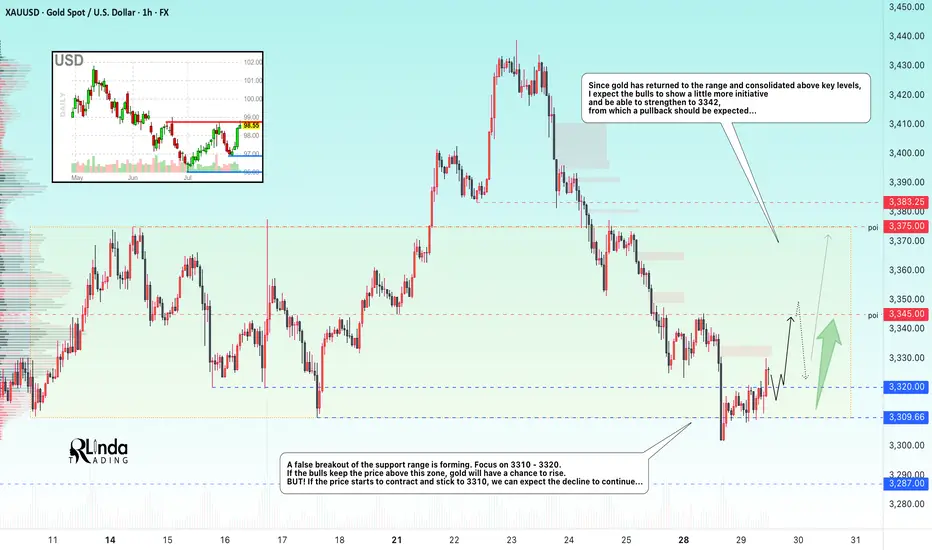
GOLD → Formation of a trading range. 3345?FX:XAUUSD confirms support for the local range. A false breakdown has formed and the price has returned to the buying zone. We are waiting for the bulls to take the initiative...
Gold is trying to recover after falling to $3302, remaining under pressure ahead of key events in the US: the publication of GDP data and the Fed's decision on interest rates. Support is provided by a pause in the dollar's growth, expectations of an extension of the US-China trade truce, and growing demand for safe-haven assets amid a surge in oil prices due to the threat of new sanctions against Russia. However, the sustainability of growth is in question: the dollar may strengthen thanks to optimism about the US economy and progress in negotiations.
A false breakdown of the support range is forming. Focus on 3310-3320. If the bulls keep the price above this zone, gold will have a chance to grow. BUT! If the price starts to contract and stick to 3310, we can expect the decline to continue...
Resistance levels: 3345, 3375
Support levels: 3320, 3310, 3287
The two-day movement has most likely exhausted its potential, or the market has decided to recover slightly due to the unpredictability factor. A false breakdown of support could trigger a pullback to the strong level of 3345, from which a rebound could form (either before growth or before the continuation of the decline; it is necessary to monitor the reaction and the market background...).
Best regards, R. Linda!
Intel looks to want $13Intel looks to be waiting below $24 resistance for $13 support. I wouldn't short it at it's current price, but I would be patient and wait for $13 if you're looking to buy. Good luck!

XAUUSD go for long!Hi all
After hitting the support zone its quite obvious that XAUUSD will increase! and we can go for long!!
Currently its double bottom, but it may go for third!
Note: am new trader and not an expert!! Please stick with your thoughts and analysis if its against mine!
Am sharing my thoughts and all depend on my analysis!
Please let me know if you agree or disagree with me!
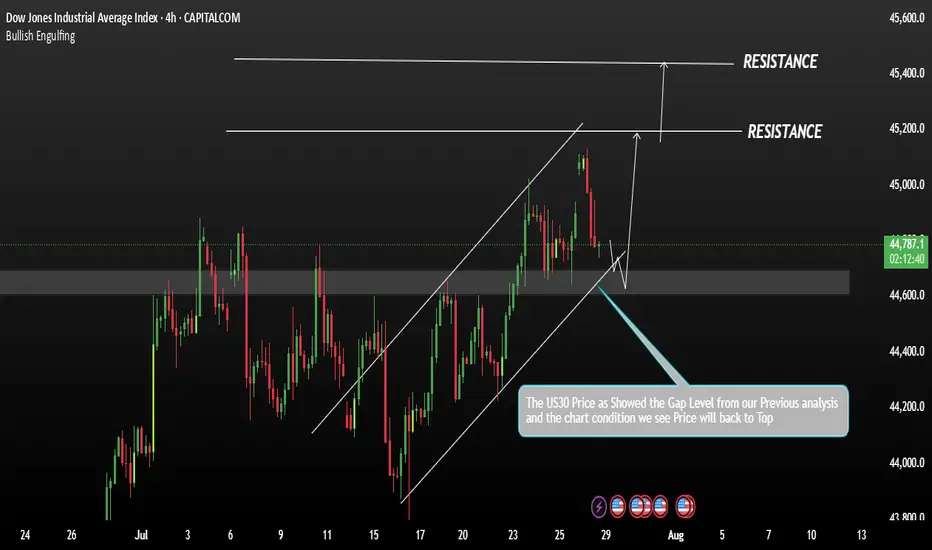
US30 Correction with in a Downtrend ChannelUS30 is currently in a consolidation phase within a broader bullish trend. From our previous analysis, the index has shown strong upward momentum. However, to confirm a potential bearish shift, the price would need to break back below key support levels, potentially leading to a deeper correction.
If the price stabilizes above 44,000 on the 4H timeframe, this would strengthen the bullish momentum. A sustained move above this level could open the path towards the next targets at 45,200 and 45,400.
You May find more details in the chart.
Ps: Support with like and comments for better analysis
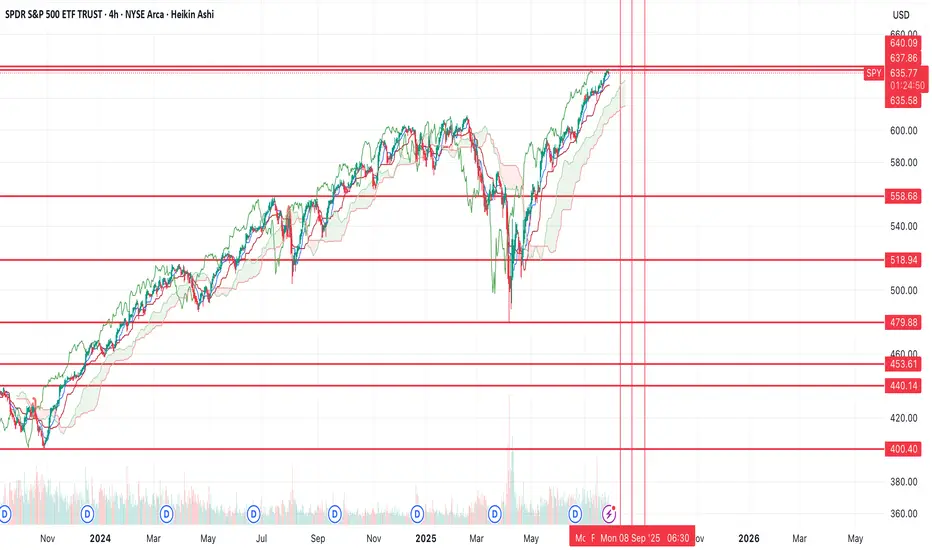
$SPY rolling over, potentially to new lows?While I was early to the idea (like usual), still don't think the thesis will be wrong. I still believe we're going to see a large move down from here.
Yesterday's price action made me pretty confident a top was in (TBD). We had positive news and the market couldn't rally on that positive news and we ended up closing at the lows -- indicating to me there's no more buyers.
Today we have treasuries, the dollar and volatility all rallying while equities selloff, a classic risk off signal. You also have crypto selling off too.
I think we see a large risk off move from here on out, the target is the $440 area (extreme down to $400), but if we find support at one of the other levels above that, there's potential for us to rally from there.
Will have to see how price action plays out over the coming weeks.
Why I Think EURUSD Will Sell This Week...Technical AnalysisHey Rich Friends,
Happy Monday. I think EURUSD will continue to sell this week. This is only my technical analysis so please check the news and cross reference any indicators you have on your own chart. Here is what I am looking at:
- There has been a break of structure to the downside on H4 signaling that price may continue to drop lower.
- After the break of structure, price opened lower and continued to sell.
- Momentum has been picking up for the sellers over the last 12 hours.
- The stochastic is oversold. The slow line (orange) is above the fast line (blue) and one or both lines are below 20.
These are all strong bearish confirmations for me so I will be selling. I took market execution order but I also have sell stops and TPs at previous lows. My SL will be a previous high.
Only take trades that make sense to you, but I hope the market is in our favor this week. Let me know what you think about this idea below.
Peace and Profits,
Cha

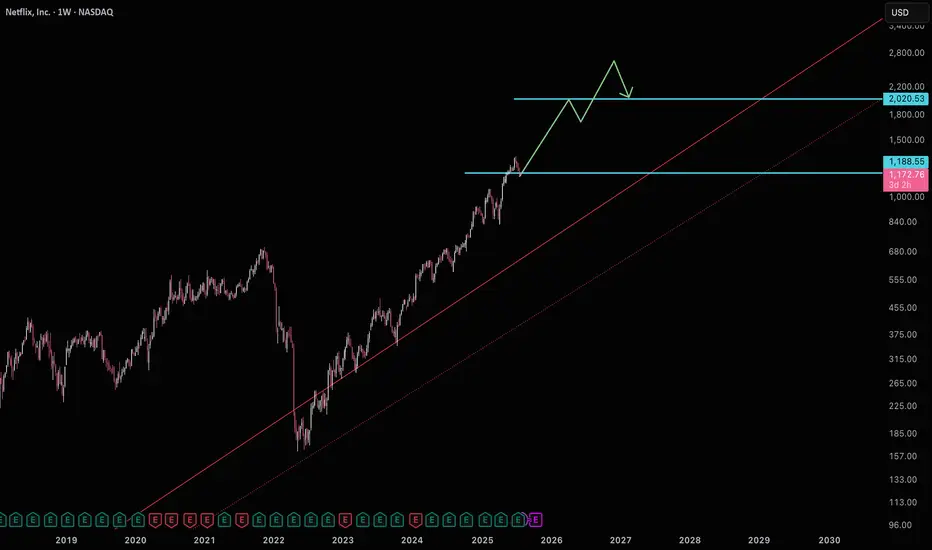
Netflix building support for $2000Netflix is currently sitting on support getting ready for a move to $2000.
Good luck!
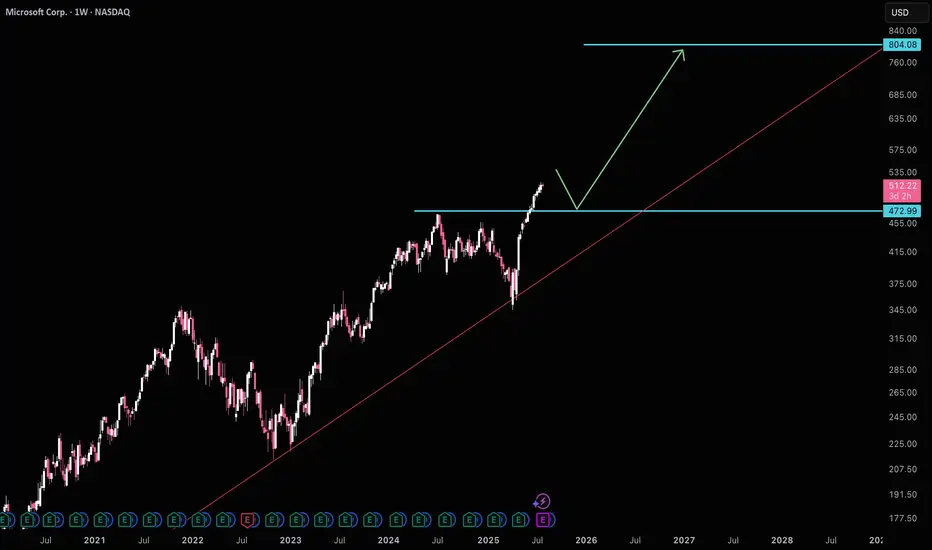
Mircrosoft wants to pullback to $470MSFT is likely to test $470 support before making it's move to $800. Another thing to be weary about is ratio MSFT/AAPL is at historical avg highs, which usually signals a bias towards AAPL. Waiting for $470 is a good idea before getting long again.
Good luck!
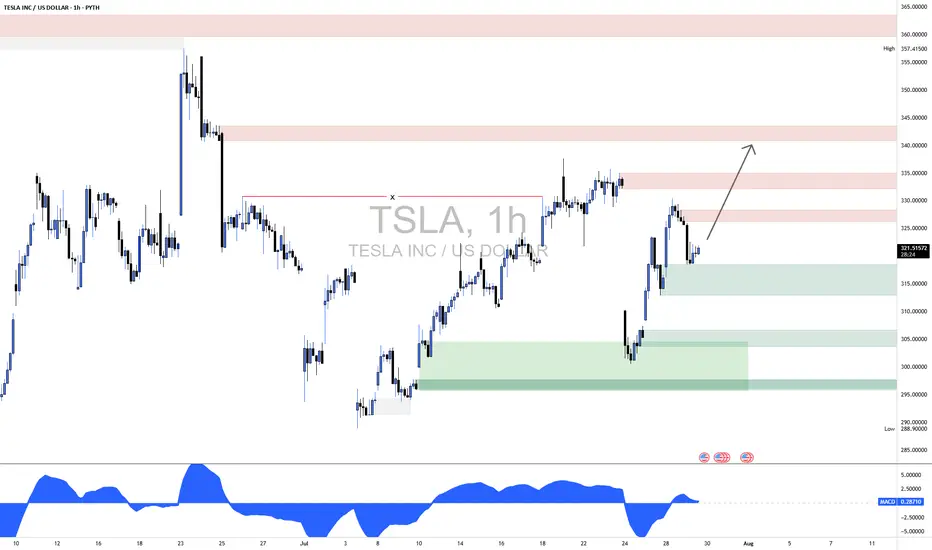
TSLA Long1. Market Structure Overview
1.1 Previous High Sweep (Fakeout) – ~357.41
Price made a strong push above previous highs but was sharply rejected.
Indicates potential liquidity grab and institutional selling.
1.2 Change of Character (CHoCH) – ~333
Price broke below the previous higher low structure, signaling the end of bullish momentum.
Marks a bearish shift after an extended uptrend.
1.3 Break of Structure (BOS) – ~317
Confirms bearish continuation after CHoCH.
Price closed below support, validating the downtrend.
2. Supply & Demand Zones
2.1 Supply Zones (Resistance)
Zone A (343–357)
Major Supply from the last distribution before the drop.
High volume selling occurred; strong resistance expected.
Zone B (328–336)
Local Supply formed after CHoCH.
Price may react here before testing higher levels.
2.2 Demand Zones (Support)
Zone C (315–319)
Price bounced from here twice; active buyer interest.
Critical zone for near-term bullish continuation.
Zone D (299–306)
Strong Demand and origin of the last large impulse up.
Institutional footprints likely; strong support if retested.
3. Price Action Analysis (Inside Bordered Region)
Current Price (~321.68) is rebounding from Zone C.
Price is forming higher lows intraday, showing bullish intent.
Expected Move:
Short-term bounce toward Zone B (328–336).
If sellers overpower, potential reversal from this supply.
If buyers maintain momentum and break above Zone B, move toward Zone A (343–357) is likely.
4. Momentum & Confirmation
MACD on the 1-hour shows a bullish crossover, suggesting short-term buying pressure.
Structure remains bearish to neutral unless price closes above 336.
A break and hold above 336 would shift bias back to bullish continuation.
5. Financial Context Supporting Price Zones
Recent Tesla Catalysts (July 2025):
Earnings Reported July 24: Mixed results. Strong delivery numbers but concerns about margins due to price cuts.
Investor Sentiment: Divided. Some bullish based on long-term EV growth; others cautious due to margin compression.
Macroeconomic Factors:
Fed policy indecision is increasing volatility.
Tech-heavy indexes (like Nasdaq) are pulling back slightly, causing large-cap techs to see choppy moves.
These events support the supply zone near 328–336 acting as resistance until new bullish data or technical breakouts occur.
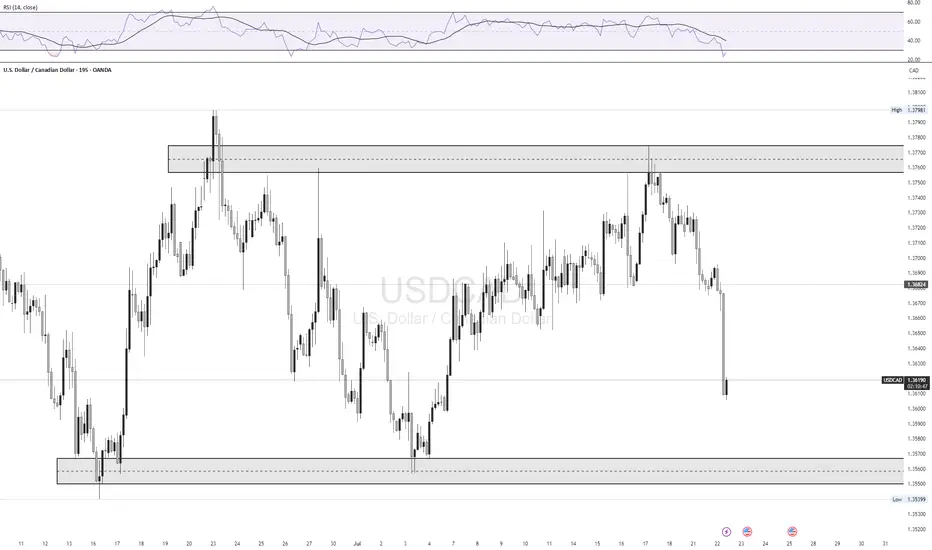
USD/CAD LongLooking for a retest of 1.35600 zone for a bounce back up to 1.37650 supply zone
FX:USDCAD