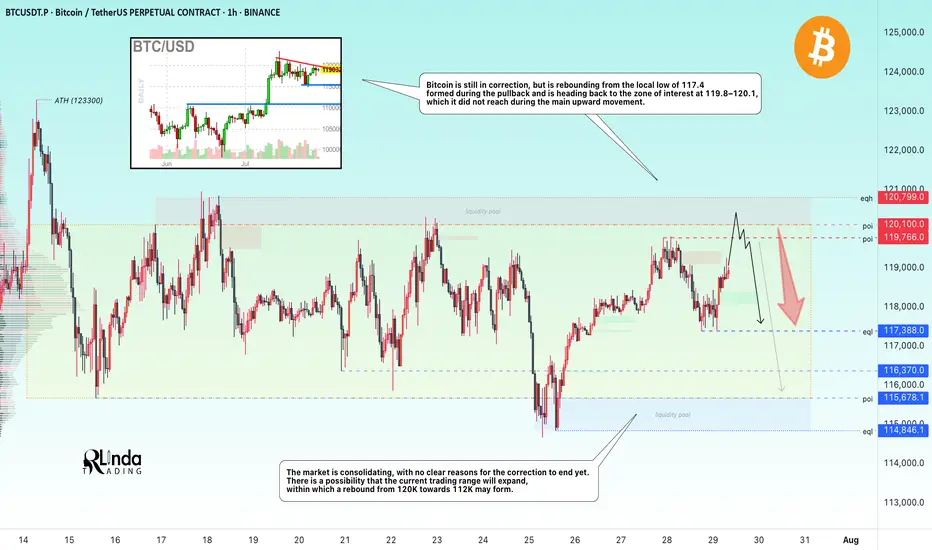
BITCOIN → Hunting for liquidity. Retest resistance before a fallBINANCE:BTCUSDT.P continues to consolidate after a strong rally. There is no strong driver yet, and Bitcoin is reacting weakly to economic data. There is a possibility of a continued correction...
Bitcoin is still in correction, but is rebounding from the local low of 117.4, formed during the pullback, and is heading back up towards the zone of interest at 119.8-120.1, which it did not reach during the main upward movement. I see no fundamental or technical reasons for the correction to end and for growth beyond 121K. I expect a rebound from the resistance zone towards 115-114K. However, in the medium term, I expect the market to attempt to close half or all of the gap between 112K and 114.8K, thereby expanding the key trading range.
Resistance levels: 119.77, 120.1K, 120.8K
Support levels: 117.4, 116.37, 115.68
Technically, a false breakout (liquidity capture) of key resistance and price consolidation in the selling zone could trigger bearish pressure on the market, which in turn would lead to a correction.
Best regards, R. Linda!
Support and Resistance
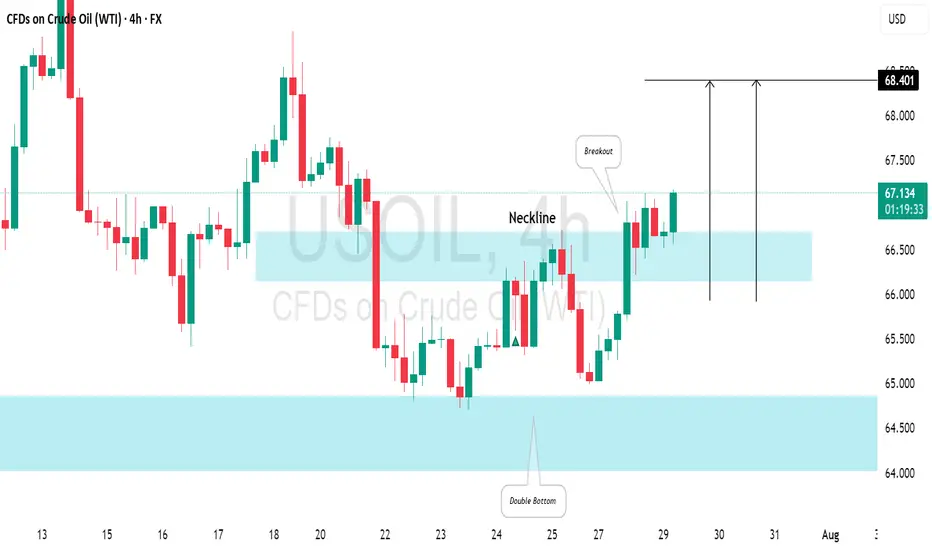
US CRUDE OIL(WTI): Very Bullish Pattern📈USOIL has reached a significant horizontal demand zone on the daily chart, leading to price consolidation and the formation of a double bottom pattern with a higher low.
Yesterday, the market rebounded, creating a new local higher high that broke above the pattern's neckline.
This suggests a typical bullish reversal, and the oil price is expected to rise towards 64.40.
DeGRAM | GOLD broke the rising channel📊 Technical Analysis
● XAU printed a false break above the 3 400 wedge roof, then sliced back through the rising mid-channel, closing under the wedge base at 3 309 - a classic bull-trap that flips that band into resistance.
● Momentum has rolled over, and the break of July’s micro up-trend opens room to the broad triangle floor/May trend-pivot near 3 246; successive lower-highs since 24 Jul confirm bearish control.
💡 Fundamental Analysis
● Hot US Q2-GDP and sticky core-PCE lifted 2-yr yields to one-month highs, reviving the dollar bid, while cautious ECB guidance tempers euro gold demand.
✨ Summary
Sell 3 309-3 335; hold below 3 309 targets 3 246 ▶ 3 200. Invalidate on an H4 close above 3 366.
-------------------
Share your opinion in the comments and support the idea with a like. Thanks for your support!

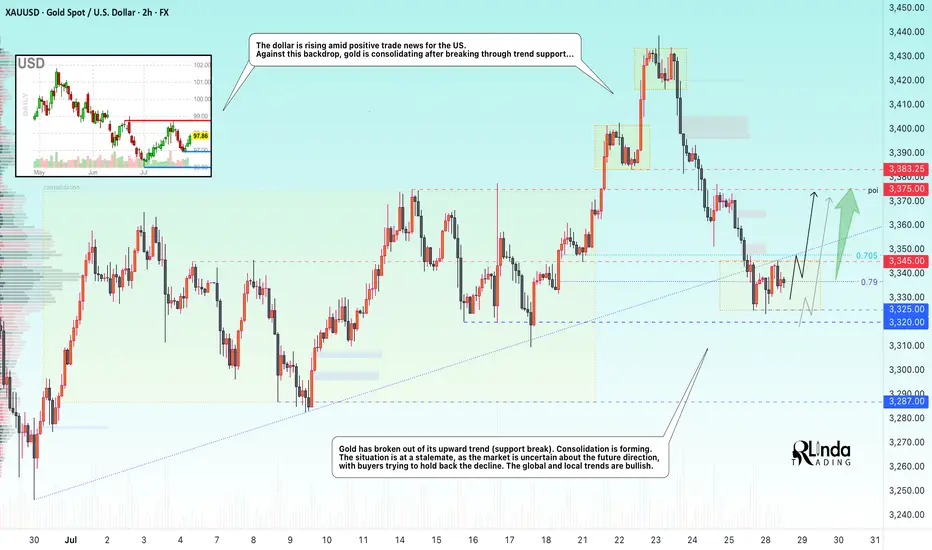
GOLD → Retest of trend support. Consolidation...GOLD is consolidating below the previously broken trend support. On Sunday, Trump announced a trade deal with the EU, which is putting pressure on the market along with the rising dollar...
Gold rebounded from support at $3310 after a week-long low, interrupting a three-day decline amid profit-taking. However, the overall downtrend remains intact as markets brace for a busy week with the release of US GDP data and the Fed's decision. Optimism surrounding US-China trade talks and the US-EU framework agreement is reducing demand for safe-haven assets. Additional pressure on gold is coming from easing geopolitical tensions: Thailand and Cambodia have agreed to ceasefire talks. The metal's recovery may be short-lived.
Technically, we have global and local bullish trends, against which gold is testing support, but as we can see, buyers are trying to hold back the decline due to uncertainty over interest rates. There is a chance that we will see active action by the Fed, behind which lies a rate cut, this week...
Resistance levels: 3345, 3375
Support levels: 3320, 3287
At the moment, I do not see a proper reaction to the support breakout. The price is consolidating after confirming the key trigger at 3345. Thus, if the price starts to return to 3345, test and consolidate above the level, we will have a chance for growth. I do not rule out a liquidity grab from 3325 (false breakout) before the rise.
BUT! The structure will be broken if the price breaks 3325 - 3320 and begins to consolidate below this zone. In this case, gold may fall to 3287
Best regards, R. Linda!
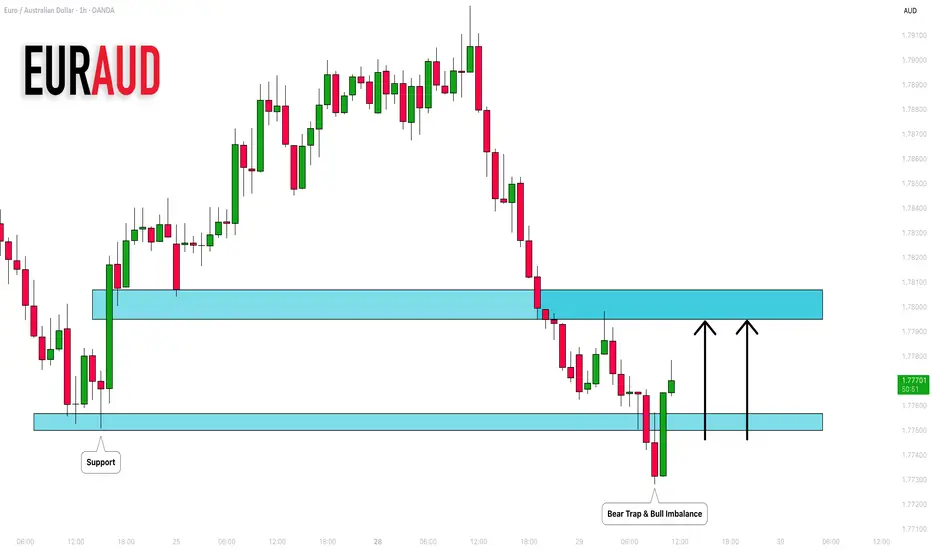
EURAUD: Bullish Move After a Trap 🇪🇺 🇦🇺
There is a high chance that EURAUD will rise from the underlined support.
A confirmed liquidity grab and a consequent bullish imbalance
provide a strong confirmation.
Goal - 1.7794
❤️Please, support my work with like, thank you!❤️
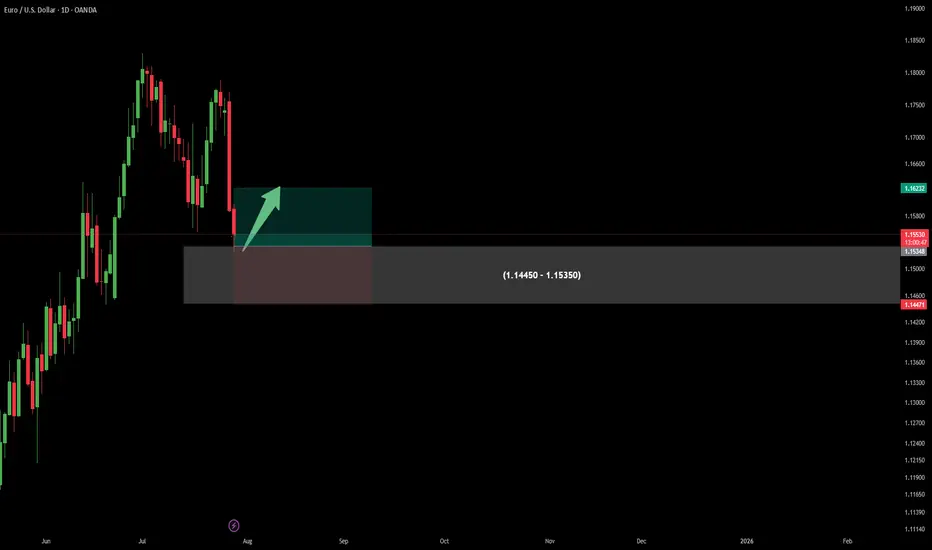
EURUSD Buy OfferThere is a Demand area in Daily time frame which I've specified on the chart.
Can enter right now ...
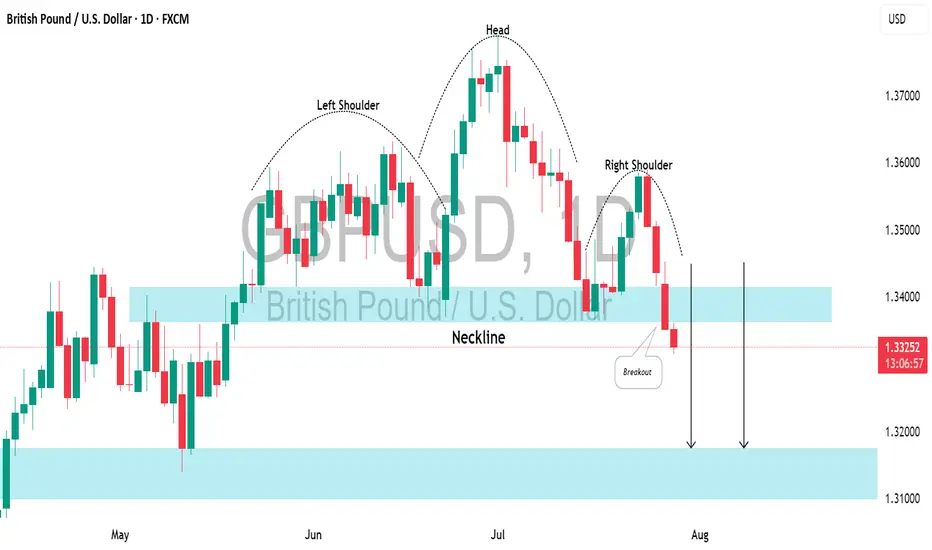
GBPUSD: Bearish Reversal Coming?!The 📉GBPUSD pair formed a significant head and shoulders pattern on the daily chart.
The neckline was violated yesterday, with a daily candle closing below it. I anticipate a downward movement.
With the next support level at 1.3170.
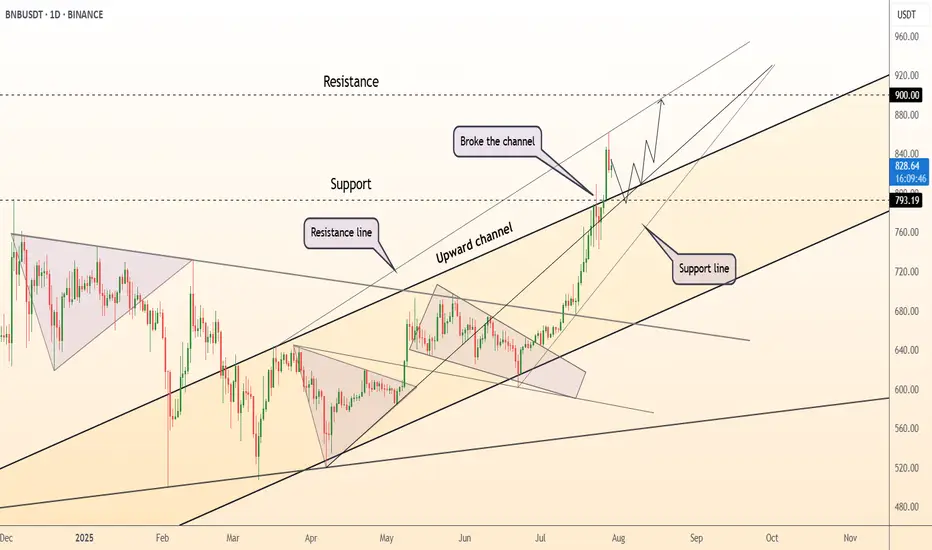
DeGRAM | BNBUSD broke the channel📊 Technical Analysis
● Daily candle closed back above the long-term median of the black rising channel after piercing the May-to-July grey resistance fan — a textbook “break-retest” that shifts the line into support at $793.
● Structure remains a staircase of higher-lows; the present pull-back is finding bids on the steep intraday trend-fan. A measured move of July’s pennant plus channel geometry converge at the round $900 barrier.
💡 Fundamental Analysis
● Binance’s 26ᵗʰ burn on 25 Jul destroyed 2.37 M BNB (~$1.9 B), shrinking circulating supply, while BNB Chain TVL rose another 4 % this week, underscoring persistent on-chain demand.
✨ Summary
Long $795-810; hold above $793 points to $835 → $900. Bull bias void on a daily close below $741.
-------------------
Share your opinion in the comments and support the idea with a like. Thanks for your support!
USDJPY InsightHello to all our subscribers.
Please feel free to share your personal thoughts in the comments. Don’t forget to hit the boost and subscribe buttons!
Key Points
- Prime Minister Shigeru Ishiba reaffirmed during a party meeting held at the LDP headquarters that he has no intention of resigning, stating, "I will do my utmost to ensure there is no political vacuum for the nation and the people."
- Following the U.S.-EU trade agreement, concerns have arisen that it could negatively impact the EU economy, with negative sentiment spreading across Europe.
- On July 28, the third high-level meeting between the U.S. and China began in Stockholm, Sweden. The market widely expects the current “tariff truce” to be extended by another 90 days.
Major Economic Events This Week
+ July 29: U.S. Department of Labor – JOLTS
+ July 30: Germany Q2 GDP, U.S. July ADP Nonfarm Employment Change, U.S. Q2 GDP, Bank of Canada rate decision, FOMC meeting results
+ July 31: Bank of Japan rate decision, Germany July CPI, U.S. June PCE Price Index
+ August 1: Eurozone July CPI, U.S. July Nonfarm Payrolls, U.S. July Unemployment Rate
USDJPY Chart Analysis
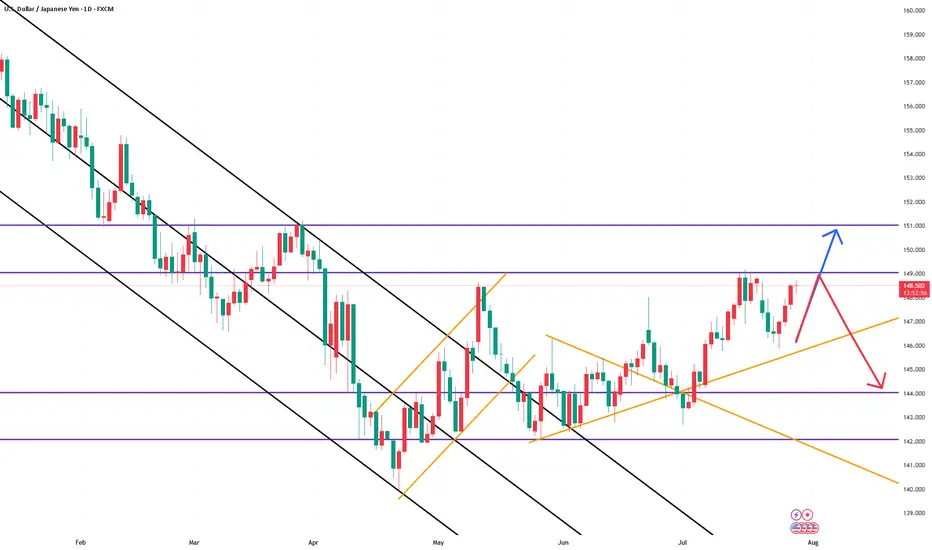
After facing resistance near the 149 level, USD/JPY pulled back but found support around 146, and is now climbing again toward 149. In the long term, a rise toward 151 seems possible. Two potential scenarios are in play:
- The pair hits resistance again at 149, finds support at 146, and then moves up toward 151.
- The pair maintains its current upward momentum and continues climbing directly to 151.
We will determine our strategy based on the price action near the 149 level.
USDJPY – Strap in For the Central Bank Rollercoaster The next 4 trading days could be crucially important for FX markets, with traders bracing for the outcomes of a variety of different events including several central bank meetings, economic data readings and trade deal/tariff negotiations. No currency pair within the majors is likely to feel the impact of these events more than USDJPY, given that both the Federal Reserve (Fed) and Band of Japan (BoJ) interest rate decisions take place within a 9-hour window late on Wednesday evening and early Thursday morning, UK time (Fed 1900 BST Wed, BoJ 0400 BST Thurs).
The first move in USDJPY at the start of this week has been higher. This was in response to the announcement of a trade deal between the EU/US, which sees tariffs of 15% on most EU goods imported into the US and has been taken as a success for President Trump and his trade team. (general USD positive). When coupled with the political uncertainty surrounding Japanese PM Ishiba, who is fighting to keep his job, (potential JPY negative) USDJPY has traded from opening levels at 147.51 on Monday up to a high of 148.71 earlier this morning in Asia.
Looking forward, both the Fed and BoJ are expected to keep interest rates unchanged. This could make what is said at the accompanying press conferences by Fed Chairman Powell (1930 BST Wed) and BoJ Governor Ueda (0730 BST Thurs) on the timing of their next respective interest rate moves potentially pivotal for the direction of USDJPY into the weekend.
Tier 1 US economic data may also be important, with the Fed’s preferred inflation gauge (PCE Index) due for release at 1330 BST on Thursday, and the next update on the current health of the US labour market due on Friday at 1330 BST in the form of Non-farm Payrolls. Sentiment may also be impacted on Friday by any headlines or social media posts from President Trump regarding trade deals and updates on whether he may extend or hold certain countries to his current deadline of August 1st.
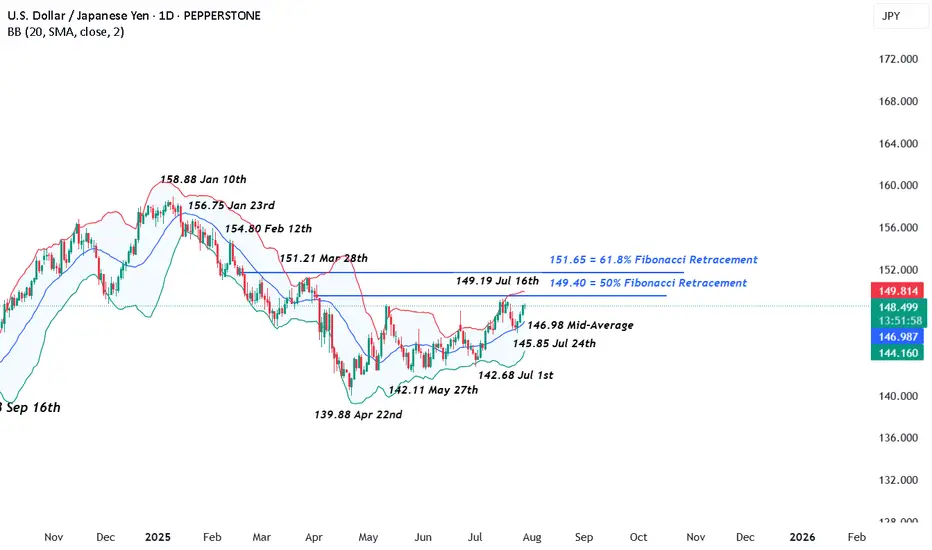
Technical Update: Focus on Fibonacci Retracement Resistance at 149.40
On July 16th 2025, USDJPY traded to a price high of 149.19, nearing what might have been considered a resistance level by traders at 149.40. This level is equal to the 50% Fibonacci retracement of the price weakness seen from 158.88 on January 10th down to 139.88, the April 22nd low. Having been capped by this resistance level, a setback in price developed last week.
However, this phase of price weakness encountered buying support around the Bollinger mid-average, currently at 146.98, from which fresh attempts at price strength have emerged. As a result, it might be argued that this type of price action is more constructive in nature, especially as since the April 22nd low was posted a pattern of higher price lows and higher price highs has so far materialised, as the chart above shows.
That said, with potential for a sustained period of USDJPY volatility in the week ahead let’s consider what may be the important support and resistance levels that could influence the direction of prices moving forward.
Potential Resistance Levels:
Having previously capped price strength, the 149.40 retracement level may prove to be successful in doing so again, meaning closing breaks above 149.40 might now be required to suggest a further period of price strength.
As the chart above shows, if successful breaks above 149.40 do materialise, potential may then turn towards tests of the next resistance at 151.21, the March 28th session high, even 151.65, the higher 61.8% Fibonacci resistance level.
Potential Support Levels:
Having seen it offer support to recent price declines, traders may still be focusing on the 146.98 Bollinger mid-average as an important level that if broken on a closing basis, might lead to a further phase of price weakness.
Closing breaks under the 146.98 support while not a guarantee of further declines, could suggest potential to test 145.85, the July 24th session low and rally point, even towards 142.68, the July 1st low.
The material provided here has not been prepared accordance with legal requirements designed to promote the independence of investment research and as such is considered to be a marketing communication. Whilst it is not subject to any prohibition on dealing ahead of the dissemination of investment research, we will not seek to take any advantage before providing it to our clients.
Pepperstone doesn’t represent that the material provided here is accurate, current or complete, and therefore shouldn’t be relied upon as such. The information, whether from a third party or not, isn’t to be considered as a recommendation; or an offer to buy or sell; or the solicitation of an offer to buy or sell any security, financial product or instrument; or to participate in any particular trading strategy. It does not take into account readers’ financial situation or investment objectives. We advise any readers of this content to seek their own advice. Without the approval of Pepperstone, reproduction or redistribution of this information isn’t permitted.
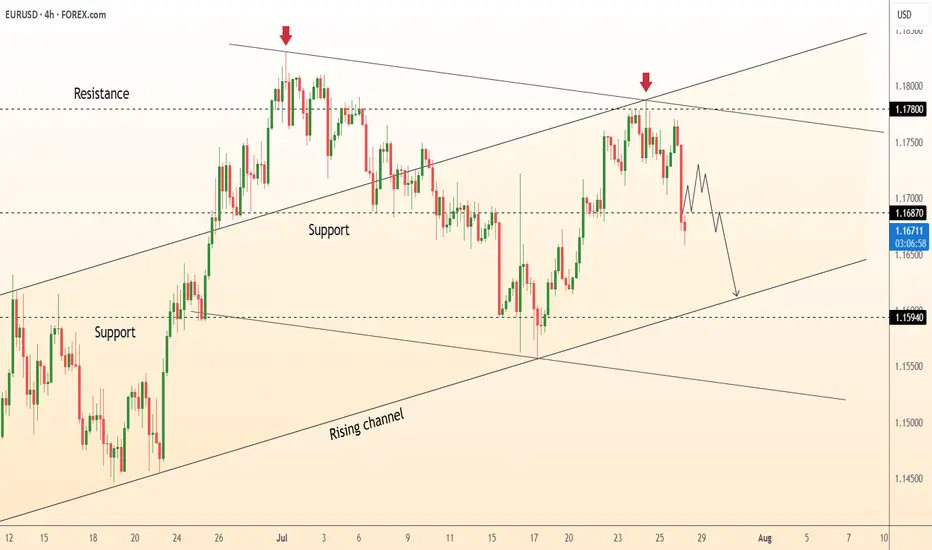
DeGRAM | EURUSD breakout📊 Technical Analysis
● Two successive rejections at the upper-channel/long-term trend-cap (red arrows) printed bearish engulfings; price has slipped back under 1.1687 minor support, breaking the July micro up-trend.
● Momentum now points to the channel mid-line ≈1.1650; clearing it exposes the lower rail / May pivot 1.1594, in line with the projected swing depth.
💡 Fundamental Analysis
● Hot US Q2-GDP and an upside surprise in core-PCE lifted 2-yr Treasury yields, reviving dollar demand, while ECB sources signalled no urgency to hike further after soft July PMIs.
✨ Summary
Short 1.1680-1.1700; hold below 1.1687 targets 1.1650 ▶ 1.1595. Invalidate on a 4 h close above 1.1750.
-------------------
Share your opinion in the comments and support the idea with a like. Thanks for your support!
XAUUSD DEVELOPS MID-TERM BEARISH IMPULSEXAUUSD DEVELOPS MID-TERM BEARISH IMPULSE
Yesterday was the 4th bearish day in a row for gold. The reasons are the same as for the EURUSD: American-European trade agreement. Geopolitical risks got eliminated and market participants get rid of the bullion. "If more ‘trade deals’ are reached, this could help to reduce this source of policy uncertainty that has weighed against the dollar, at least for now. It could also see other factors such as relative yields becoming more influential," said Paul Mackel, global head of FX research at HSBC.
Technically, the price has broke down the former trendline and is currently staying slightly above the local support of 3,300.00. It is expected for rebound to continue, retest of the trendline is possible with further decline towards 3,200.00 support level.

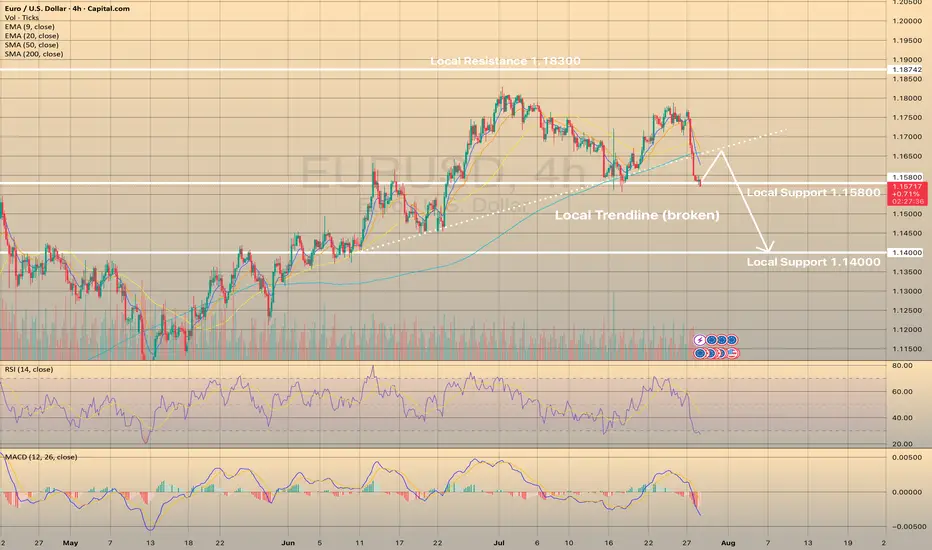
EURUSD - STRONGEST DECLINE FOR THE LAST COUPLE OF MONTHSEURUSD - STRONGEST DECLINE FOR THE LAST COUPLE OF MONTHS
EURUSD has lost 1.32% yesterday on the U.S. - E.U. trade deal. Experts suggest that the relief felt by the United States and the European Union upon reaching a trade agreement has been overshadowed by worries about the potential economic harm caused by a 15% tariff on EU imports. The dollar has recently experienced a positive trend, and this trend could continue if U.S. economic data, including Friday's employment figures, indicates a strong economy. The investors who had previously made substantial bets on the euro's appreciation are now reversing their positions, causing the euro to weaken.
Technically, the asset broke down the local trendline and is currently trying to rebound from the local support level of 1.15800. RSI tells us that the asset is oversold, so the most possible outcome here is the EURUSD to rebound from current level, retest former trendline and continues downwards movement.
CGPT Buy Idea🔥 Hidden Gem Project Analysis – 5x Potential Play (2025-2026) 🔥
Project Name: (CGPT)
📊 Technical Breakdown (Chart Analysis):
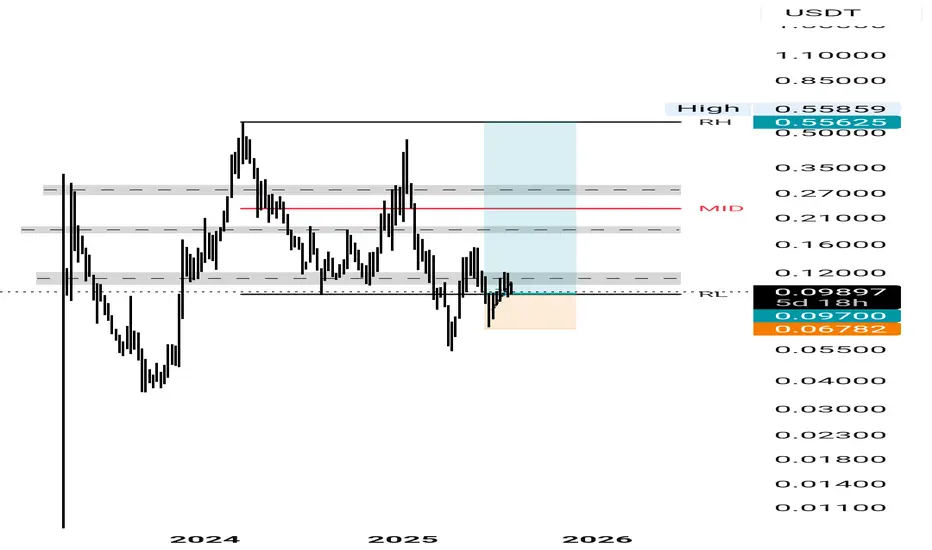
1. Current Price Zone:
Trading at $0.09700.
Critical Support Level (RL): $0.06782 — This is the absolute last line of defense for bulls.
2. Resistance Zones:
Immediate Resistance: $0.12000 (Marked with grey zone)
Mid-Term Target: $0.22000 (MID line) — Historically, price reacts here.
Long-Term Target: $0.55625 - $0.55859 (RH/High) — This is the real breakout zone for a massive rally.
4. Potential Upside:
From current price ($0.097) to High ($0.558) — that’s a 5x - 6x potential rally.
Strong bullish structure forming — Any breakout of $0.12 will trigger fast moves to $0.22 and above.
🔍 Fundamental Narrative (Why This Project?)
Undervalued Gem — Ignored by mainstream, but smart money accumulating.
Major partnerships or exchange listings possible.
Project updates, tech upgrades, or token utility enhancements.
Low Market Cap — Easier for price to pump 3x-5x quickly.
> "🚀 This Coin is Quietly Accumulating Before Exploding 500%+!
Just like how PEPE and FLOKI started slow — this project is gearing up for a monstrous move.
Entry is loading… Don’t regret later when it’s at $0.50+! 📈
DM me for complete research! 📊"
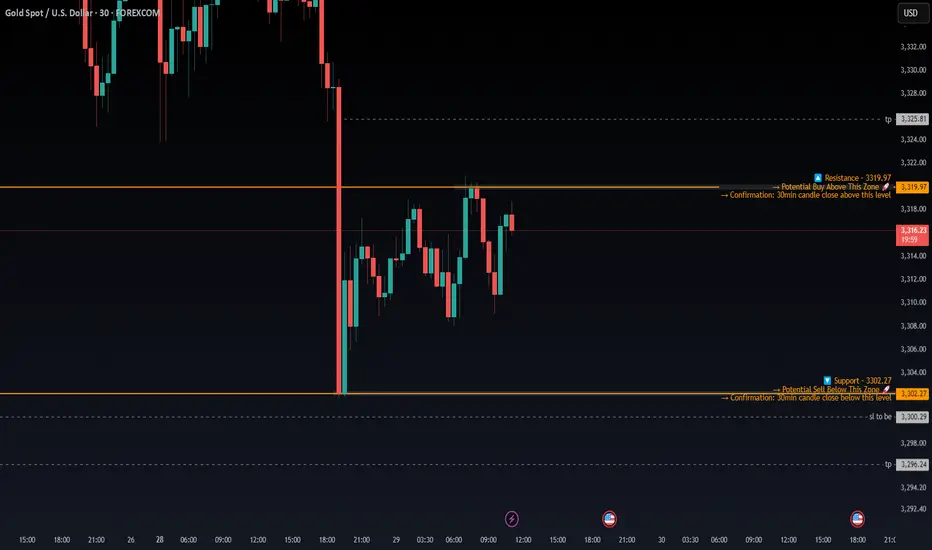
XAUUSD (GOLD) - SCALPING IDEA🧠 Clean Price Action Outlook – Patience Until the Range Breaks
Currently, price is consolidating between 3319.97 (resistance) and 3302.27 (support) a well defined short-term range that’s been respected multiple times. Both levels are holding firmly, with wicks and reactions showing that buyers and sellers are actively defending these zones.
Right now, I'm not interested in trading inside this chop zone there's too much noise and no clear directional conviction. My focus is on waiting for price to break cleanly out of the range with confirmation.
📈 Bullish Scenario (Buy Plan):
If price breaks and closes above 3319.97 on the 30-minute timeframe, that would be the first sign of bullish strength. Ideally, I want to see:
A strong bullish candle close above 3319.97
Follow-through in the next candle (not a fakeout or wick trap)
Volume pickup or price holding above the level during retest
📍 If this happens, I’ll look to enter long trades on confirmation, with a potential target around 3325.81, which is the next minor resistance.
SL would ideally be placed just below the breakout candle or the breakout zone itself depending on the price structure at the time.
📉 Bearish Scenario (Sell Plan):
On the flip side, if price breaks down below 3302.27 and closes below it on the 30-minute chart, that opens the door for shorts.
Here’s what I want to see:
A full candle body close below the level (not just a wick spike)
Possibly a retest + rejection of 3302.27 from below
Weak price action around the level confirming sellers are in control
If that plays out, I’ll consider short entries with an SL above the structure (around 3304+), and a first target around 3296.00, where there’s minor demand.
⚠️ Until Then – No Trade Zone
Until we get a confirmed breakout, I’m staying out. No point guessing which side will win the market will show us.
EURJPY ANALYSISAfter seeing the previous daily candle close as an engulfing and trading below the moving average we could be looking for further sell off but with the fundamentals coming out for the day we could see slowed movement till the news comes out

Japan 225 Unwind Pauses at Known SupportThe Japan 225 contract has spent the past three sessions partially unwinding the sharp rally sparked by Japan’s trade agreement with the United States last week, leaving price resting on a known support level. Near-term price action may determine whether bullish or bearish setups hold the upper hand.
If price holds 40162, longs could be established above with a stop beneath for protection, targeting a move back to last week’s high of 42070. Alternatively, a break and hold beneath 40162 would flip the setup, allowing shorts to be established below with a stop above for protection. Uptrend support sits today at 40000, making that an obvious target.
Momentum indicators remain mildly bullish despite the pullback, favouring upside over downside. However, with this setup, price action should carry more weight.
Good luck!
DS

GBPUSD Week 31 Swing Zone/LevelsPEPPERSTONE:GBPUSD keeps giving and simply does.
Strategy for this week is highlighted; sell at the zone and look for buy around 33683.
Zones/Levels are calculated based previous Week X's difference High & Low (dHL)
Trade Parameters:
sl: 10-15pips
dTP: dynamic TP means because momentum can push fast past say 33683, TP is a soft target. However typically 5-10x
As always price action determines trades.

AMD - Will Buyers Show Up at Longterm VAL???With the markets getting oversold, does AMD, who has been in a long downtrend, finally find buyers at its longterm VAL? This is the area to see if buyers finally show up in my opinion.

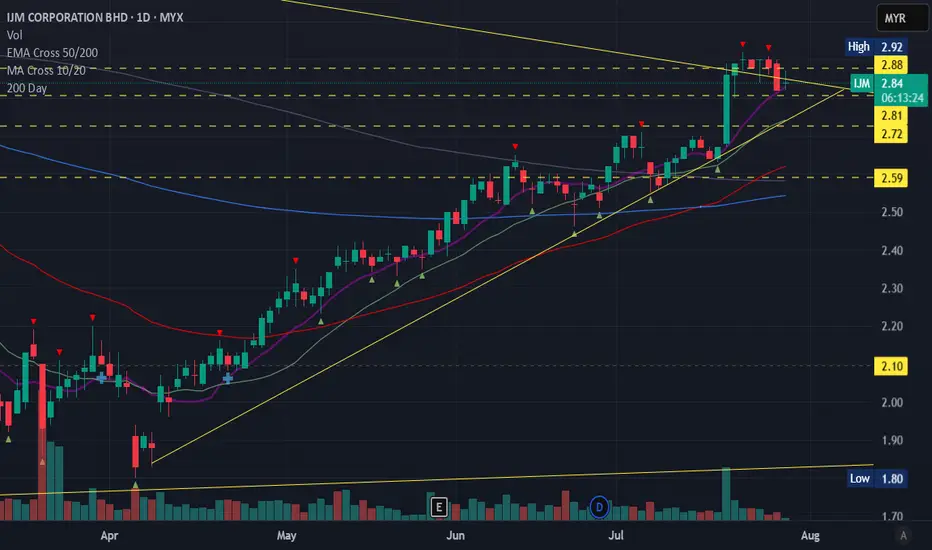
IJM movement had spoken### Technical Analysis of IJM Corporation Berhad (IJM)
**As of July 29, 2025**
---
#### **1. Trend Analysis**
- **Current Price Trend**:
- IJM is in a **bullish trend** on the medium-to-long-term timeframe.
- Key observations:
- **Higher Highs & Higher Lows**: The stock has consistently formed higher peaks and troughs over the past 6 months, indicating sustained buying pressure.
- **Moving Averages**:
- **50-day EMA**: Acting as dynamic support (e.g., ~RM 2.20).
- **200-day EMA**: Upward-sloping, confirming the long-term bullish bias (e.g., ~RM 2.00).
- **Resistance Levels**:
- Immediate resistance at **RM 2.50** (recent high).
- Breakout target: **RM 2.65–2.70** (next psychological barrier).
- **Support Levels**:
- Strong support at **RM 2.10–2.15** (confluence of 200-day EMA and prior swing lows).
- **Conclusion**:
> The trend is **UP**, with bullish momentum intact. A hold above RM 2.10 maintains the upward trajectory.
---
#### **2. MACD Analysis**
- **Current MACD (12, 26, 9) Setup**:
- **MACD Line**: Above the signal line (positive divergence).
- **Signal Line**: Rising but trailing the MACD line.
- **Histogram**: Positive and expanding (green bars), indicating **increasing bullish momentum**.
- Example values (hypothetical):
- MACD Line: **+0.15**
- Signal Line: **+0.10**
- Histogram: **+0.05** (growing).
- **Interpretation**:
- **Bullish Crossover**: MACD crossed above the signal line ~2 weeks ago, triggering a buy signal.
- **Momentum Confirmation**: The expanding histogram suggests acceleration in upward momentum.
- **No Divergence**: Price and MACD are aligned (no bearish reversal signal).
- **Conclusion**:
> MACD confirms **bullish momentum** with room for further upside.
---
#### **3. Combined Outlook**
- **Strengths**:
- Trend + MACD alignment supports continued upside.
- Volume has risen during up-moves, validating buyer conviction.
- **Risks**:
- Overbought RSI (e.g., >70) on shorter timeframes may cause minor pullbacks.
- Market sentiment shifts (e.g., sector-wide profit-taking) could pressure the stock.
- **Tactical View**:
- **Hold/Buy on Dips**: Ideal entry near support (RM 2.10–2.15) if retested.
- **Take-Profit Zones**:
- Short-term: **RM 2.50** (breakout confirmation).
- Medium-term: **RM 2.65–2.70**.
- **Stop-Loss**: Below RM 2.10 (invalidates bullish structure).
---
**Disclaimer**: This analysis is based on technical patterns and historical data. Fundamental factors (e.g., earnings, sector risks) must be evaluated independently. Consult a financial advisor before trading.
ETH eyes on $3431.83: Golden Genesis fib may END this SurgeETH finally got a surge after a long consolidation.
But has just hit a Golden Genesis fib at $3431.83
Like hitting a brick wall, it is now staggering back.
It is PROBABLE that we orbit this fib a few times.
It is POSSIBLE that we reject here to end the surge.
It is PLAUSIBLE that we Break-n-Retest to continue.
We were here at this EXACT spot 8 months ago:
=============================================
.

DKS watch $170-172: Major Support that could mark a BottomDKS earnings report apparently disappointed.
Fell into a major support zone $170.01-172.12
Looking for a bounce to long or break to short.
.
Last Plot with a Perfect Road Map
=================================================

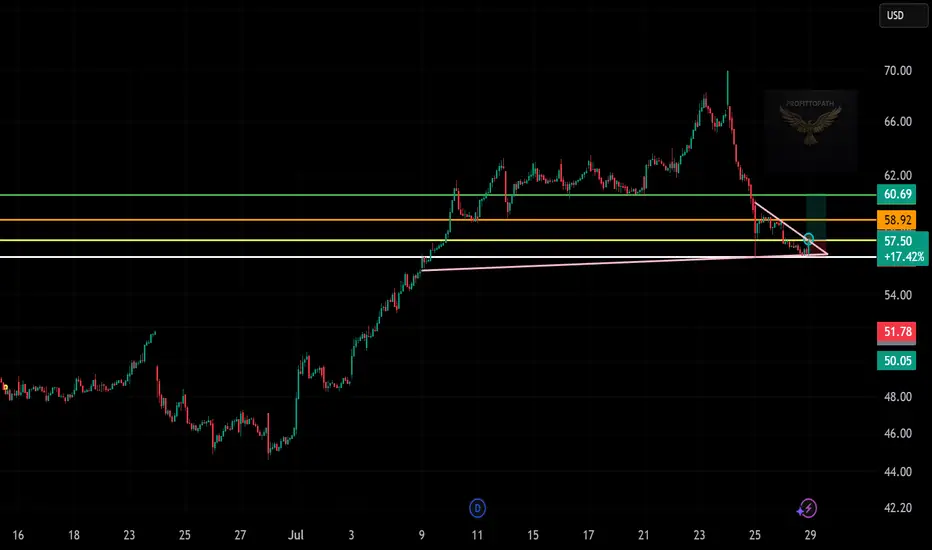
Trade Setup: LONG on AAP!📊
🕰️ Timeframe: 30-minute chart
🔍 Pattern: Falling wedge breakout
📉 Previous Trend: Sharp sell-off
🔁 Setup: Reversal from demand zone with breakout confirmation
🧩 Technical Breakdown:
Support Zone:
Around $57.00 (highlighted with pink & white lines)
Retesting prior breakout + holding demand zone
Resistance / Target Zones:
TP1: $58.92 (orange line – minor resistance)
TP2: $60.69 (green line – major resistance)
Entry:
Ideal near $57.00–$57.50, post-breakout candle (as seen on chart with blue circle)
Stop Loss:
Below recent low: around $56.00 (under pink trendline and horizontal support)
Risk-Reward Ratio:
~1:2+ depending on stop placement and exit at TP2
⚠️ What to Watch:
Volume confirmation on breakout (not shown in image but crucial)
Price retesting wedge breakout and holding above $57.00
Market sentiment and overall sector performance
✅ Summary:
This is a bullish reversal trade off a key support zone with a clean breakout from a falling wedge. Holding above $57 confirms buyers are stepping in. Room to run up to $60.69 if momentum builds.