DeGRAM | GBPUSD is forming the falling wedge📊 Technical Analysis
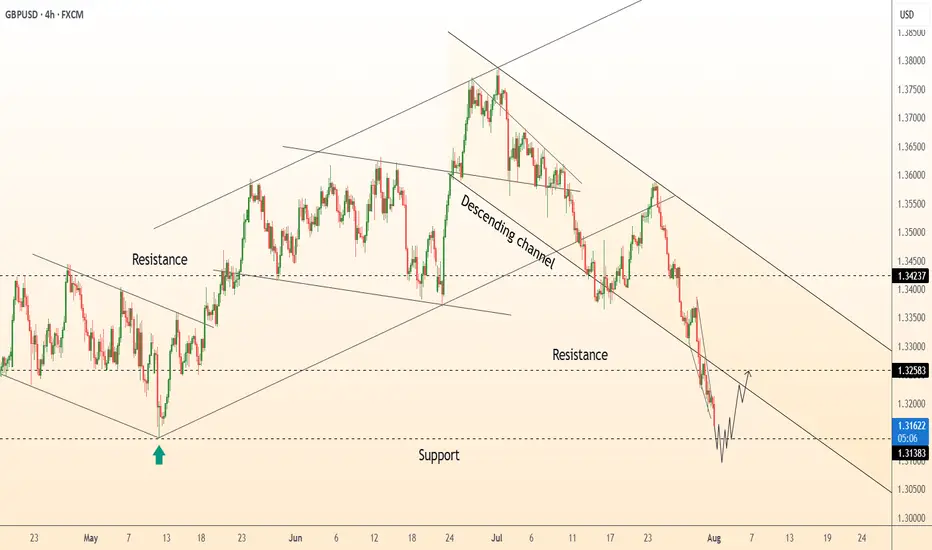
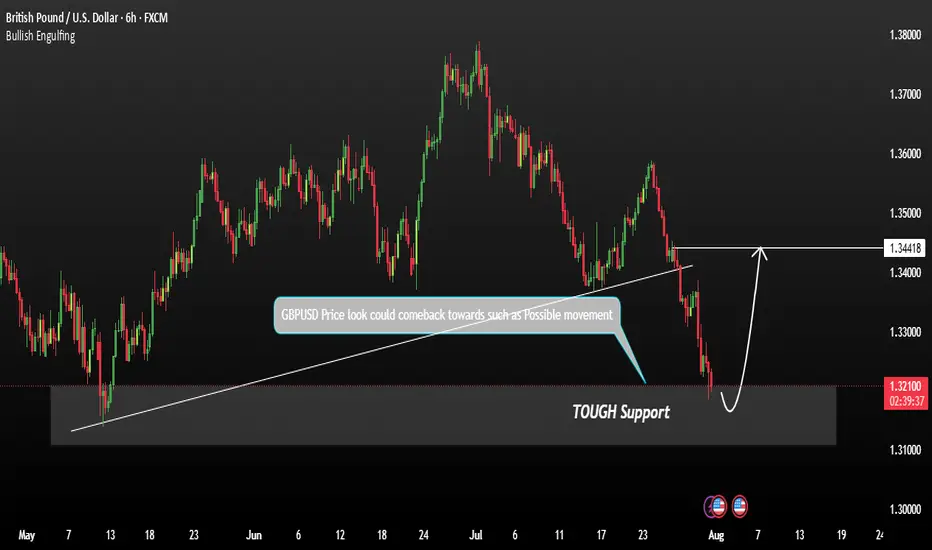
● GBPUSD is attempting a reversal from the lower boundary of a descending channel after forming a short-term double-bottom near 1.3138.
● Price is now climbing toward 1.3258 resistance, supported by bullish divergence and a break of the local falling wedge.
💡 Fundamental Analysis
● The USD is under pressure ahead of key NFP data, as ISM manufacturing misses weighed on Treasury yields.
● Positive UK PMI and consumer lending data have supported GBP, with BoE policy expectations firming above neutral.
✨ Summary
Long bias above 1.3138. Breakout targets 1.3258 ➜ 1.3423. Setup valid while price holds above 1.3110 support.
-------------------
Share your opinion in the comments and support the idea with a like. Thanks for your support!
Support and Resistance
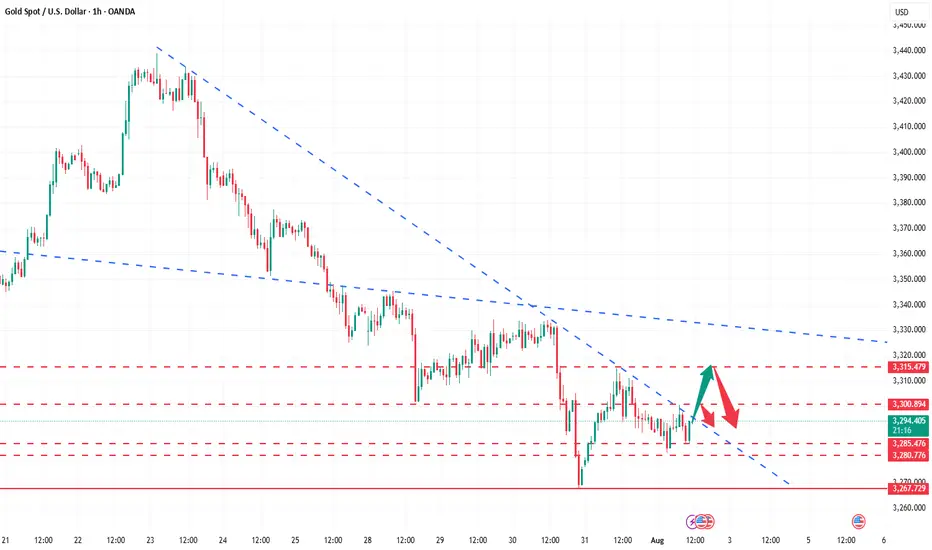
The idea of shorting on rallies below 3315 remains unchanged.Gold remains generally weak, with multiple rebounds showing signs of fatigue. The upward moving average continues to suppress prices, indicating that the bearish trend remains intact, and the short-term market outlook remains bearish. Trading strategies remain bearish today, with a key focus on the 3300-3315 area, a key short-term resistance zone. If the market rebounds before the US market opens and approaches this area, or if a clear topping signal appears near this range, consider entering a short position. Today will see the release of the non-farm payroll data, which may influence the market's trajectory. We recommend prioritizing short-term trading before the release, and reconsidering the market's direction based on market feedback after the release. Structurally, gold continues to exhibit a volatile downward trend, with lower highs and lower lows. Today's low is expected to be lower than yesterday's. Short-term short positions are focused on 3285-3280, with a break below this level potentially allowing for further declines. Please carefully time your entry, strictly implement risk management, and avoid emotional trading.
DeGRAM | USDJPY fixed above the descending channel📊 Technical Analysis
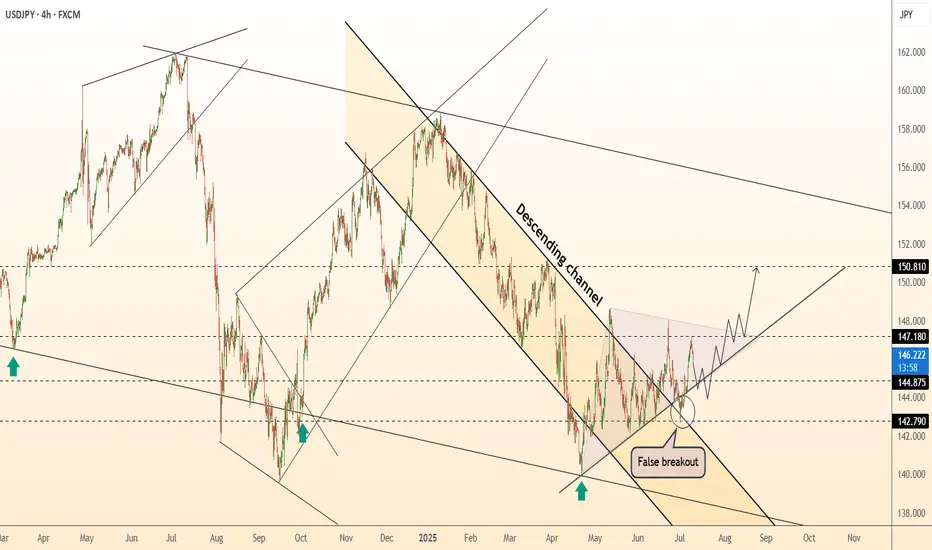
● Dollar-yen has punched through the 16-month descending channel top and twice retested it as support (false-break tags), carving a rising trend line that now guides price away from 144.90.
● Inside the break zone a smaller pennant is forming; a 4 h close above 147.18 completes the pattern and activates the channel-height target at 150.80 near the November swing cap.
💡 Fundamental Analysis
● US 2-yr yields pushed to a three-month high after hotter CPI core-services and Barkin’s “inflation progress has stalled”, while the BoJ July minutes flagged only “gradual” QT—widening the policy gap and reviving carry demand for yen shorts.
✨ Summary
Long 145.2-146.2; pennant break >147.18 targets 150.80. Bias void on a 4 h close below 142.80.
-------------------
Share your opinion in the comments and support the idea with like. Thanks for your support!
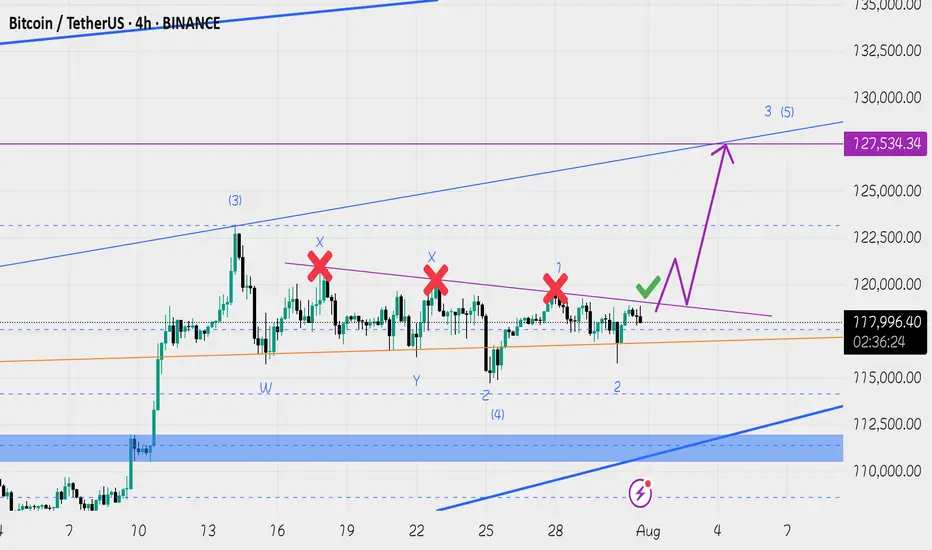
Bitcoin: New All-Time High — What’s Next?Bitcoin had an incredible run, breaking the old all-time high ($111,980) with strong bullish momentum and setting a fresh ATH at $123,218 (Binance). We just witnessed the first major corrective move of ~6% and a decent bounce so far — but the big question is:
What’s next? Will Bitcoin break higher over the summer or form a trading range here?
Let’s dive into the technicals.
🧩 Higher Timeframe Structure
May–June Range:
BTC was stuck between $110K–$100K, forming an ABC corrective pattern. Using trend-based Fib extension (TBFE) from A–B–C:
✅ C wave completed at $98,922 (1.0 TBFE)
✅ Upside target hit at $122,137 (-1 TBFE)
Full Bull Market TBFE:
➡️ 1.0 → $107,301 → previously rejected
➡️ 1.272 → $123,158 → recent rejection zone
Pitchfork (log scale):
➡️ Tapped the upper resistance edge before rejecting.
Previous Bear Market Fib Extension:
➡️ 2.0 extension at $122,524 hit.
2018–2022 Cycle TBFE:
➡️ 1.618 at $122,011 tapped.
Macro Fibonacci Channel:
➡️ Connecting 2018 low ($3,782), 2021 ATH ($69K), 2022 low ($15,476) →
1.618–1.666 resistance band: $121K–$123.5K.
✅ Conclusion: Multiple fib confluences mark the $122K–$123K zone as critical resistance.
Daily Timeframe
➡️ FVG / Imbalance:
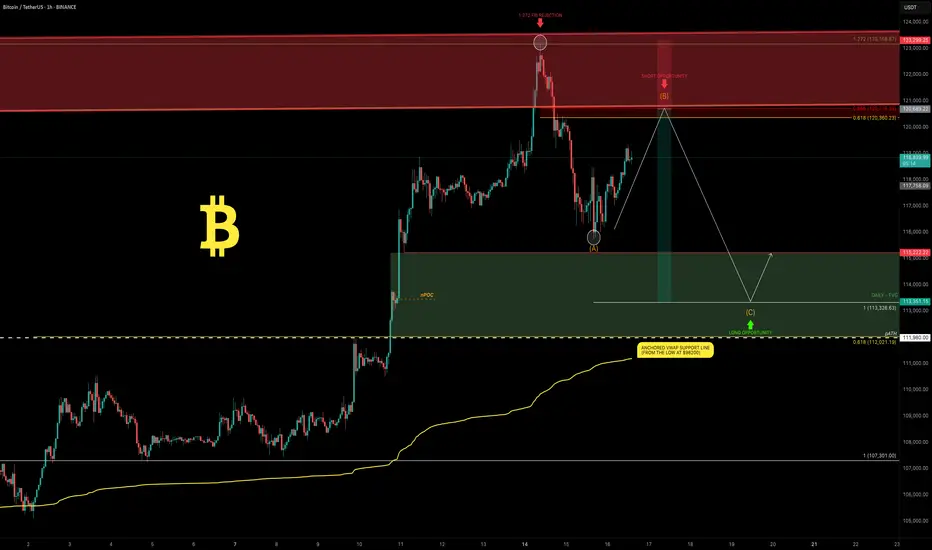
Big daily Fair Value Gap between the prior ATH and $115,222 swing low.
BTC broke the prior ATH (pATH) without retest → a pullback to this zone is likely.
Lower Timeframe / Short-Term Outlook
We likely saw a completed 5-wave impulse up → now correcting.
The -6% move was probably wave A, current bounce = wave B, next leg = wave C.
➡ Wave B short zone: $120K–$121K
➡ Wave C target (1.0 TBFE projection): ~$113,326
➡ Confluence at mid-FVG + nPOC
Trade Setups
🔴 Short Setup:
Entry: $120,300–$121,000
Stop: Above current ATH (~$123,300)
Target: $113,500
R:R ≈ 1:2.3
🟢 Long Setup:
Entry: Between Prior ATH and $113,000
Stop: Below anchored VWAP (~$110,500)
Target: Higher, depending on bounce confirmation.
🧠 Educational Insight: Why Fibs Matter at Market Extremes
When markets push into new all-time highs, most classic support/resistance levels disappear — there’s simply no historical price action to lean on. That’s where Fibonacci extensions, channels, and projections become powerful tools.
Here’s why:
➡ Fibonacci extensions (like the 1.272, 1.618, 2.0) help estimate where trend exhaustion or profit-taking zones may appear. They are based on the psychology of crowd behavior, as traders anchor expectations to proportional moves from previous swings.
➡ Trend-Based Fib Extensions (TBFE) project potential reversal or continuation zones using not just price levels, but also the symmetry of prior wave moves.
➡ Fibonacci channels align trend angles across multiple market cycles, giving macro context — like how the 2018 low, 2021 ATH, and 2022 low project the current 1.618–1.666 resistance zone.
In short:
When you don’t have left-hand price history, you lean on right-hand geometry.
That’s why the $122K–123K zone wasn’t just random — it’s a convergence of multiple fib levels, cycle projections, and technical structures across timeframes.
⚡ Final Thoughts
Bitcoin faces major resistance around $122K–$123K backed by multiple fib and structural levels. A retest of the prior ATH zone (~$112K–$113K) looks probable before the next big directional move. Watch lower timeframe structure for signs of completion in this corrective phase.
_________________________________
💬 If you found this helpful, drop a like and comment!
Want breakdowns of other charts? Leave your requests below.
Solana coin Long setupIn this video I go through the current price action and talk about how the 126$ target level was recently reached for a clean long entry and on the daily timeframe we printed a higher low .
I expand on my thoughts for a continuation to the upside and to retest some higher levels of resistance 180$s and time will tell if we print a higher high at the 180$s before retesting the $200 zone .

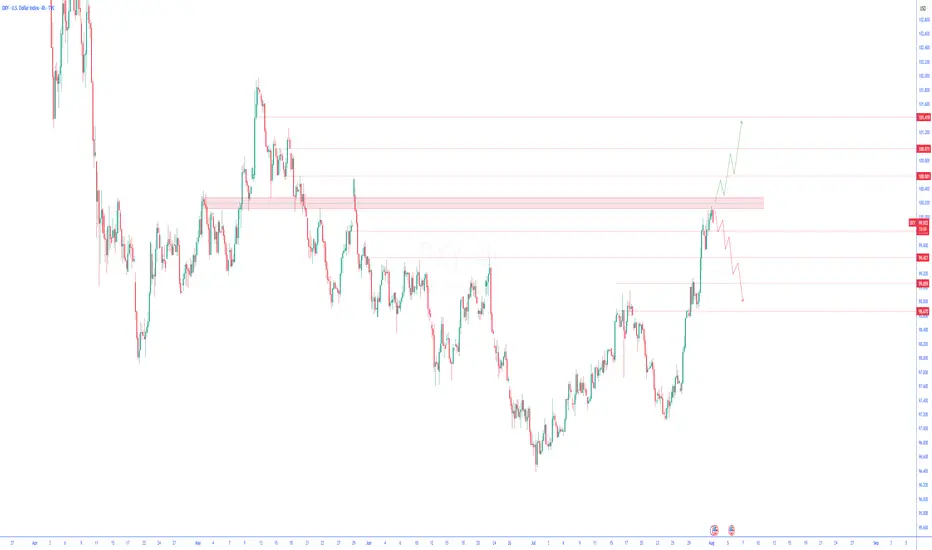
U.S. Dollar Index (DXY) Technical Analysis – 4-Hour TimeframeU.S. Dollar Index (DXY) Technical Analysis – 4-Hour Timeframe
Following yesterday’s economic data from the United States, which included stronger-than-expected GDP growth and consumer confidence figures, the U.S. Dollar Index (DXY) has continued its upward trend with strength. These developments have reinforced expectations for continued monetary tightening—or at least keeping interest rates elevated—which in turn has boosted demand for the dollar.
On the 4-hour chart, after a strong bullish rally, the dollar index has now reached a key resistance zone that previously acted as a major barrier.
Bullish Scenario:
If the current resistance zone is decisively broken and price stabilizes above it, the bullish momentum could extend further toward higher technical levels. This scenario would gain additional strength if upcoming economic data continues to support the dollar.
Bearish Scenario:
However, if the price fails to break through the resistance and signs of buyer weakness begin to emerge, a corrective pullback toward previous support levels may occur. This scenario could be further intensified if weaker economic data is released or if the Federal Reserve signals a more dovish stance.
At the moment, traders are advised to closely monitor the price reaction to the current zone and wait for confirmation before committing to the next move.
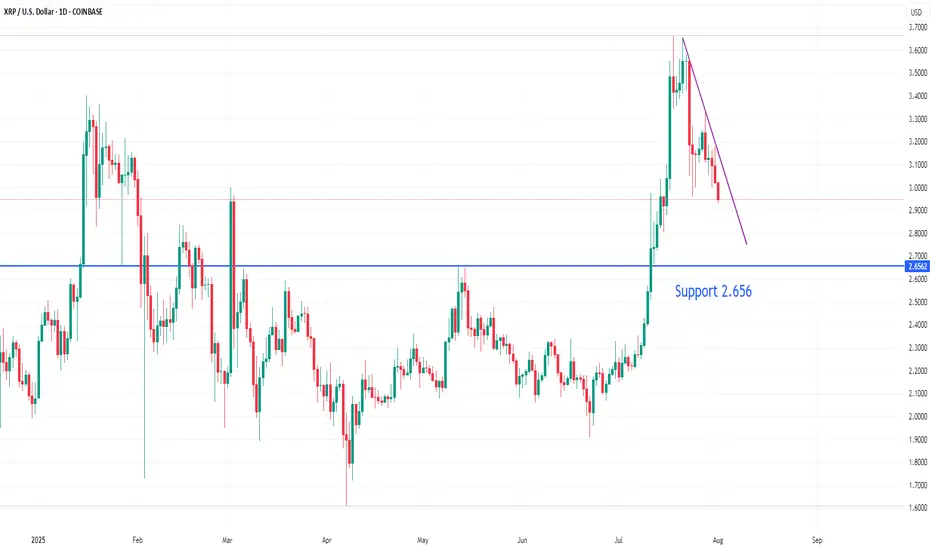
XRPUSD downside target 2.656On the daily chart, XRPUSD has retreated from its highs, with short-term bears dominating. Currently, the price is in a downward trend, so shorting near the downtrend line resistance is recommended, with a target around 2.656.
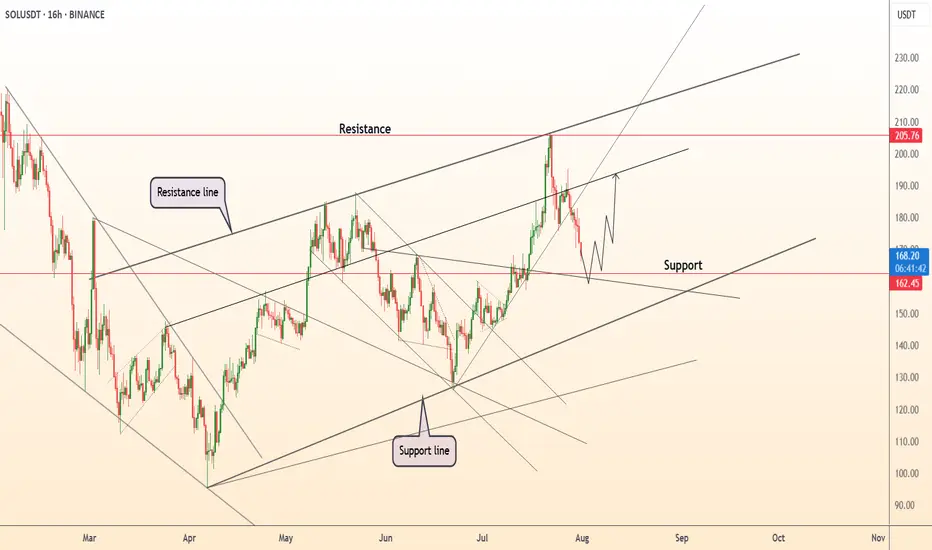
DeGRAM | SOLUSD will test the support level📊 Technical Analysis
● SOLUSD is pulling back after testing the upper resistance channel near 205 and is now approaching key support at 162.5, aligning with the breakout zone.
● Structure remains bullish as price respects the midline of the ascending channel, and upside continuation toward 205 remains likely if 162 holds.
💡 Fundamental Analysis
● Solana remains a top performer in weekly ETP inflows, per CoinShares, and continues to dominate in NFT volume and developer activity.
● Funding remains positive across major derivatives platforms, signaling sustained bullish sentiment despite short-term volatility.
✨ Summary
Long bias above 162. Breakout target remains 205 ▶ 220. Setup remains valid while above key structure support.
-------------------
Share your opinion in the comments and support the idea with a like. Thanks for your support!
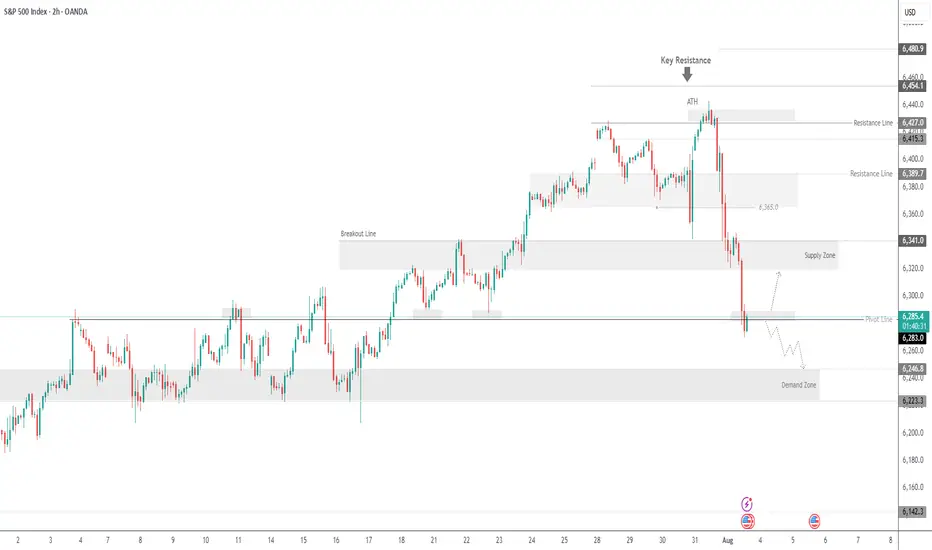
SPX500 Dips Ahead of NFP as Tariff Risks RiseSPX: S&P 500 Dips to Close July — Still Positive for the Month Amid Tariff Tensions & Fed Uncertainty
The S&P 500 retreated in the final session of July, weighed down by renewed tariff concerns and lingering uncertainty around the Fed’s next move. Despite the late pullback, the index remains positive for the month overall.
Looking ahead, non-farm payrolls (NFP) and U.S. jobs data are expected to have a strong impact on market direction. In addition, August 1st marks a key date for potential tariff developments, which could trigger further volatility.
Technical Outlook – SPX500
The index has dropped approximately 2.5% since yesterday and maintains a bearish bias as long as it trades below 6283. If the price continues to slide, the next downside target is 6246, with further support at 6223.
However, if the price manages to close above 6289 on the 1H timeframe, it could trigger a bullish recovery toward 6320 and 6341.
Pivot Line: 6283
Support Levels: 6246 • 6223
Resistance Levels: 6320 • 6341
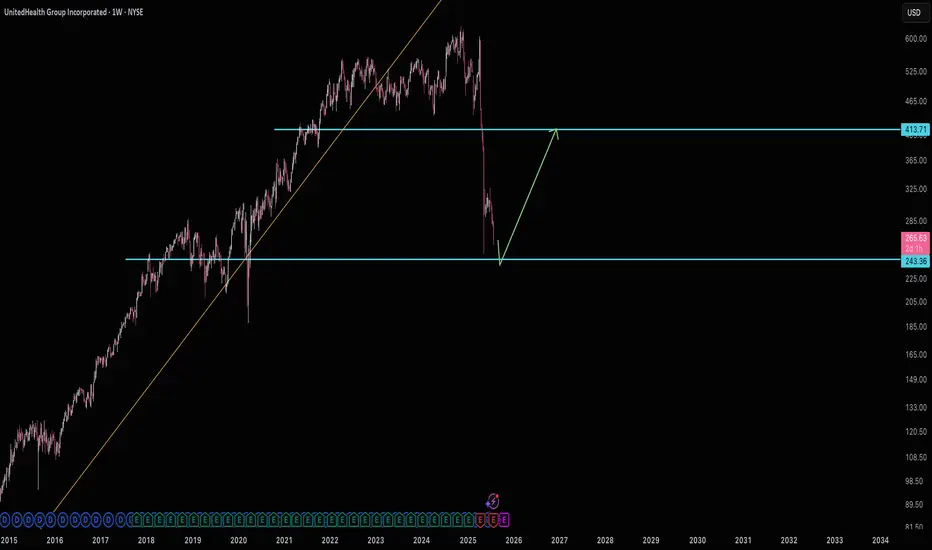
Waiting for $243 United HealthUNH has obviously taken a beating. It's managed to get so close to support many a few times now, yet hasn't hit yet. So if $243 does hit, then plan on targeting $410.
Good luck!
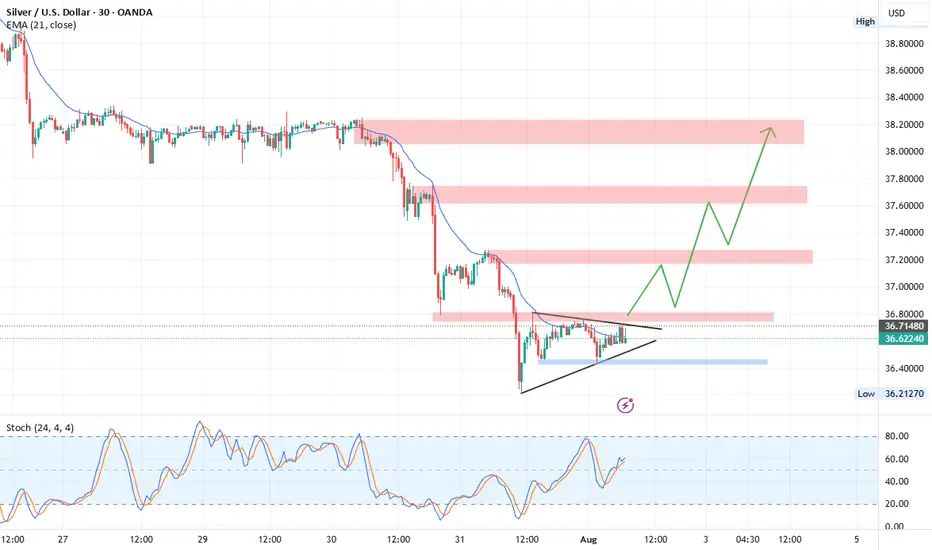
XAGUSD Technical Outlook (Silver/USD)Currently, Silver is trading inside a symmetrical triangle formation , signaling a potential breakout.
Upside Scenario:
A breakout above 36.80 resistance may trigger strong bullish momentum. The next target zone lies at 37.18 – 37.30, which is a relatively weak resistance and could potentially form a Head and Shoulders pattern . If momentum continues, Silver could extend gains toward 37.75 and 38.00 resistance levels.
Downside Scenario:
If the triangle breaks to the downside, we may see a short corrective move toward 3 6.25 – 36.20 support zone before any possible rebound.
Overall, the chart structure currently favors an upside breakout with continuation toward higher resistance zones.
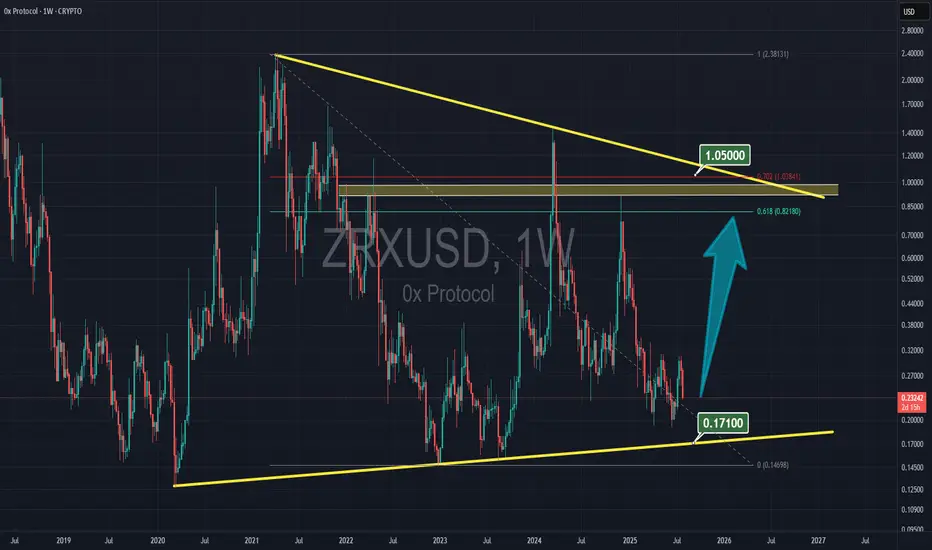
ZRX to $1 ZRX is consolidation at the very bottom price, and with alt-season hopefully get a rally to $1
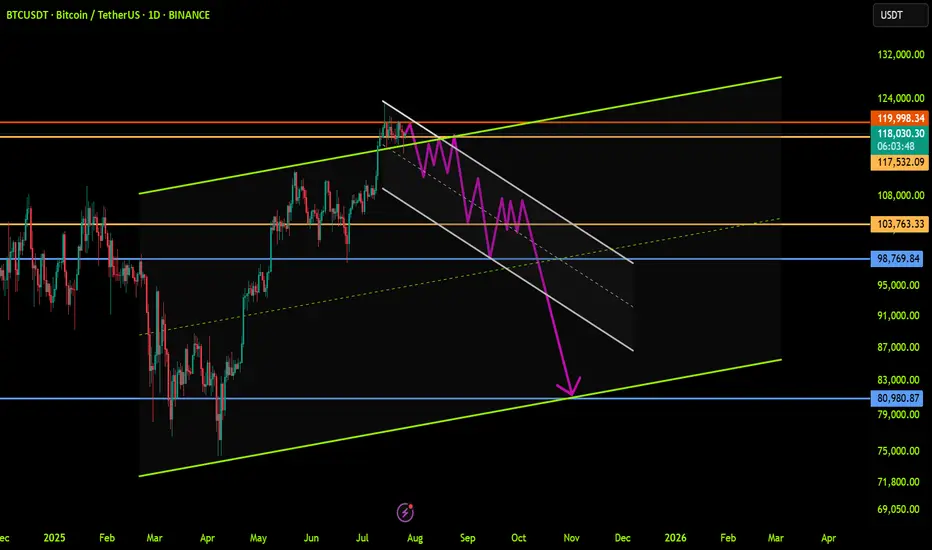
BTCUSDT: Trend in daily time frameThe color levels are very accurate levels of support and resistance in different time frames.
A strong move requires a correction to major support and we have to wait for their reaction in these areas.
So, Please pay special attention to the very accurate trend, colored levels, and you must know that SETUP is very sensitive.
BEST,
MT
XRPUSDT → Range formation. Retest of resistanceBINANCE:XRPUSDT.P , after a false breakout of the daily resistance level of 3.352 and the elimination of traders, has entered a correction phase. The trading range shown below has been formed, with an emphasis on resistance...
XRP previously formed a false breakout of the daily resistance level of 3.352, as indicated in the idea above. After changing its market character, the price entered a correction phase. Focus on the range of 3.00 - 3.264. A retest of resistance (zone of interest and liquidity) is possible before falling to 3.161, 3.05 or to the liquidity zone of 3.00. There are no technical or fundamental reasons for exiting the consolidation; most likely, a retest of the zone of interest may end in manipulation and a pullback to support...
Resistance levels: 3.1609, 3.264, 3.352
Support levels: 3.05, 3.00
I do not rule out the fact that a retest of the 3.264 resistance level may have a breakout structure and the price will continue to rise, but based on the price behavior pattern on D1, the market structure, and market stagnation, I conclude that at the moment, the chances of seeing a correction from resistance are higher. Further developments will need to be considered after the retest of key zones on the chart...
Best regards, R. Linda!

GBPUSD shows signs of a potential recoveryGBPUSD shows signs of a potential recovery towards the resistance zone. This price action indicates a possible short-term reversal or consolidation phase. We are currently observing for confirmation signals such as:
These could signal a build-up for a move back toward the key resistance at 1.34400. Traders should stay alert for price behaviour near this level as it may act as a turning point or breakout trigger.
You may find more details in the chart.
Trade wisely best of luck buddies.
Ps: Support with like and comments like for better analysis.
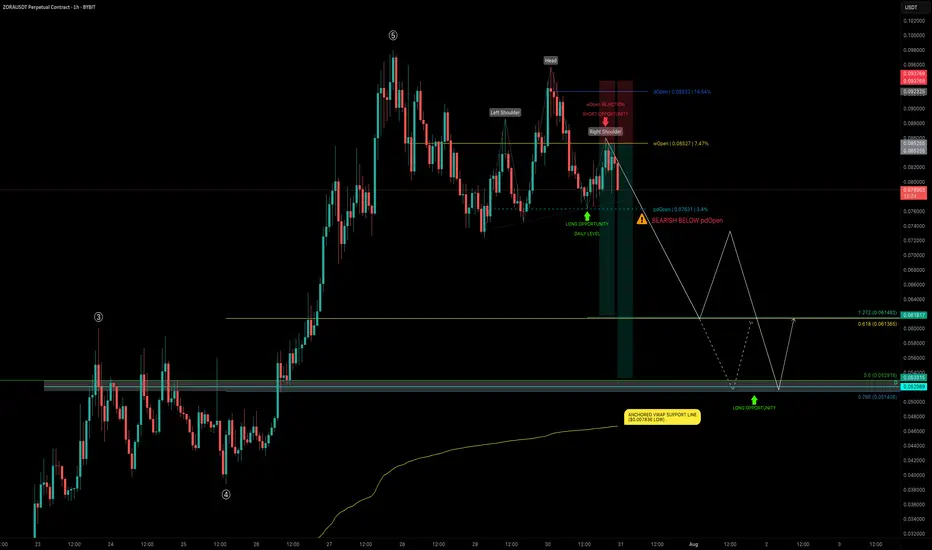
ZORA 5-Wave Completion — 30% Crash Incoming?After exploding +1150% in just 20 days and completing all 5 waves, ZORA is now consolidating — trading sideways just under the $0.10 psychological level for the past 4 days.
📉 Current Market Structure
The current structure shows signs of a developing Head & Shoulders pattern, with price:
Trading below the daily open (dOpen) and weekly open (wOpen) → Bearish signs
Hovering near the prior daily open (pdOpen) → a breakdown here would confirm bearish continuation
🔴 Short Setup - Bearish Scenario
If ZORA breaks below pdOpen, we’re likely heading for:
0.618 Fib retracement at $0.06137 of the final wave 5
Confluence with 1.272 Trend-Based Fib Extension (TBFE) at $0.06148
This zone marks the next high-probability reaction point and a potential long opportunity if price shows a bounce or reversal.
📉 Overall Short Trade Target
The full retracement target sits between $0.0529 and $0.0514, offering multiple layers of confluence:
0.5 Fib retracement of the full 1150% move
0.786 Fib retracement of the final wave 5
Aligned with an old trading range and daily level
This makes it an ideal demand zone for patient bulls but only once price confirms.
💡 Educational Insight
This setup highlights an example of Elliott Wave Theory in action — after a strong 5-wave impulse move, markets often enter a corrective phase. The completion of wave 5, especially near key psychological levels like $0.10, often marks a local top, where price corrects toward key Fibonacci retracement zones.
Combining wave structure with confluence factors like Fib levels, VWAP, and prior trading ranges helps traders identify high-probability reversal zones — allowing for better timing, risk management, and trade planning. Always wait for confirmation before jumping into any trades.
Summary
Bearish continuation confirmed on pdOpen breakdown
First support zone: $0.0613–$0.0614
Final downside target: $0.0529–$0.0514
Look for long opportunities only on reaction + confirmation
_________________________________
💬 If you found this helpful, drop a like and comment!
Want breakdowns of other charts? Leave your requests below.
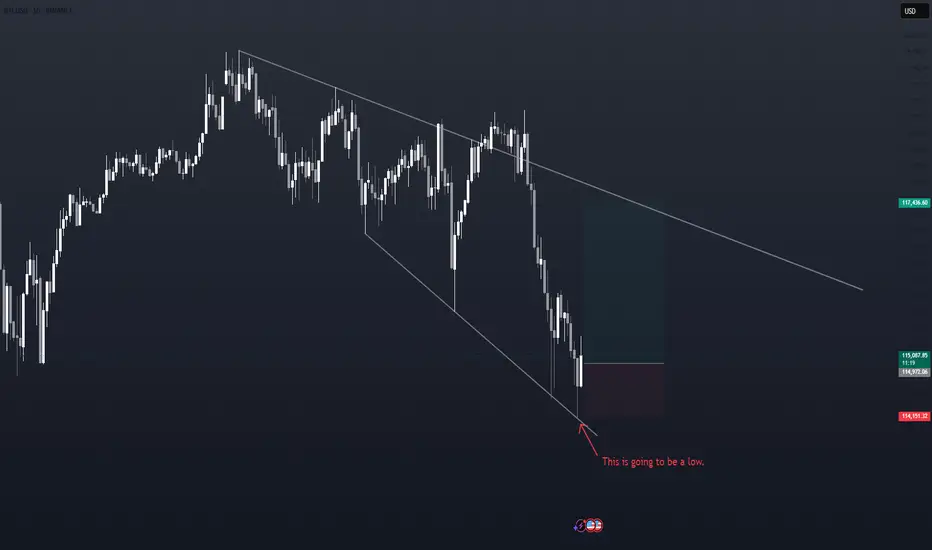
127-128k incoming ( altcoins round ? )Hi, Bitcoin seems to have completed its short term Elliott wave 4 correction and the price action analysis also confirms that this time Bitcoin will be able to break the 120-119 resistance, I predict Bitcoin to make a new high around 127-128. Altcoins have not grown that much yet and if the price can make a reliable consolidation above 120k, altcoins will start to rise.
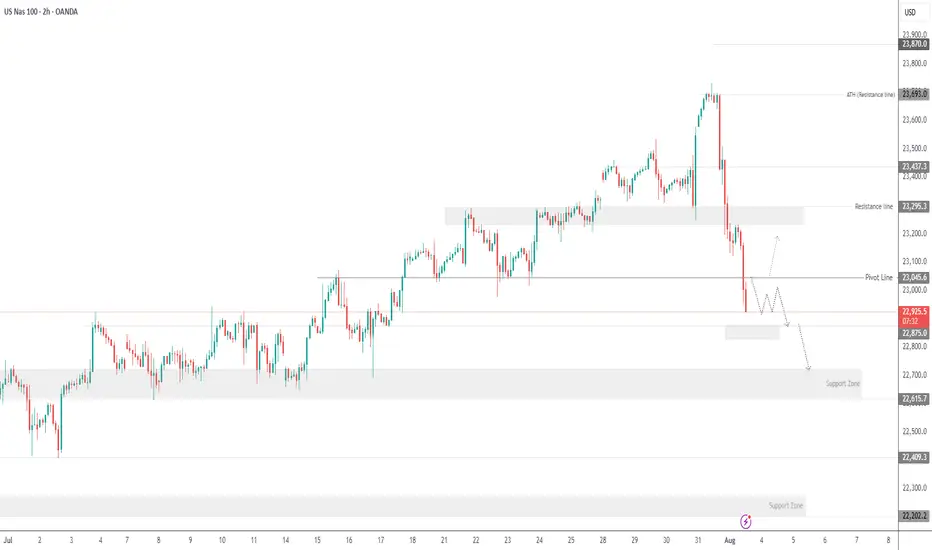
USNAS100 - Tech Weakness & Tariffs Drag NASDAQ LowerTariff Day Pressure Builds as Amazon Miss Weighs on Markets
Markets were hit by a wave of risk-off sentiment on Friday as renewed tariff headlines, weakness in pharma stocks, and a disappointing earnings report from Amazon clouded investor confidence. All this comes just ahead of the U.S. jobs report, which is expected to challenge the market's already diminished expectations for Fed rate cuts.
While macro markets appeared resilient earlier in the week, Wall Street futures and global equities turned cautious as sentiment deteriorated.
NASDAQ – Technical Outlook
The NASDAQ has dropped nearly 850 points from its recent all-time high of 23690, as anticipated in previous updates. The index remains under bearish pressure.
For today, the market is expected to remain sensitive due to recent macro and earnings-driven volatility.
If the price breaks below 22875, the decline is likely to extend toward 22710, with a deeper support zone at 22615.
To shift back to a bullish bias, the index must break and close above 23045 on the 1H chart.
Support Levels: 22875 • 22710 • 22615
Resistance Levels: 23140 • 23240 • 23320
Bias: Bearish while below 23045
Bullish confirmation: 1H close above 23045
DXY LONGi am looking to go long on DXY from this level of breaker block.. a possible pullback to this level we will engage on the buy and use itr as cross reference for our dollar pairs ..

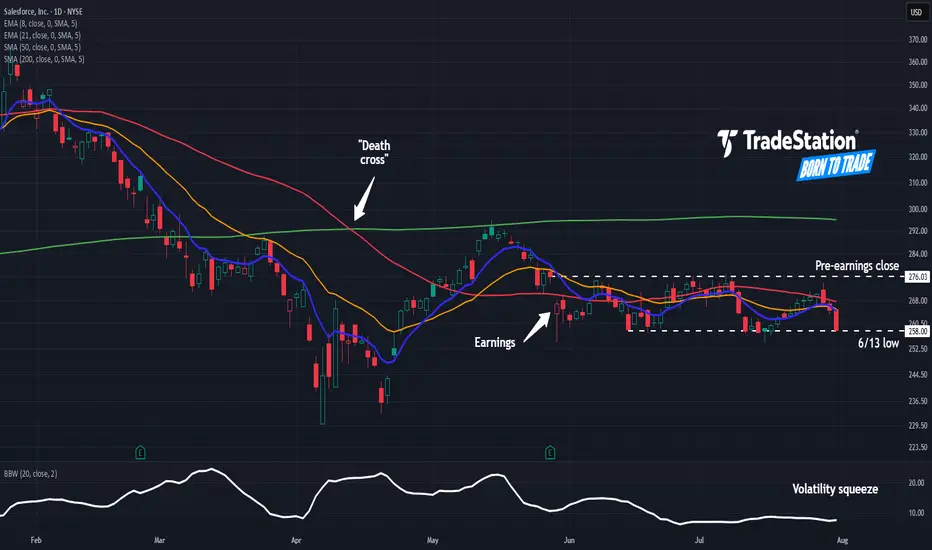
Salesforce May Face DistributionSalesforce has limped as other tech stocks hit new highs, and some traders may think it’s going into distribution.
The first pattern on today’s chart is the bearish price gap on May 29 despite better-than-expected quarterly results. That may reflect waning enthusiasm about the software company’s fundamentals.
Second is the pre-earnings closing price of $276.03. CRM has remained trapped below that level, which may suggest it’s become resistance.
Third is the June 13 low of $258. The stock bounced there in mid-July but may now be at risk of breaking it.
Next, Bollinger Bandwidth has narrowed as the stock formed a tight range between the two levels. Could price movement expand following that period of compression?
Last, the 50-day simple moving average (SMA) had a “death cross” below the 200-day SMA in April. The 8-day exponential moving average (EMA) is also below the 21-day EMA. Those patterns may be consistent with bearishness in the long and short terms.
TradeStation has, for decades, advanced the trading industry, providing access to stocks, options and futures. If you're born to trade, we could be for you. See our Overview for more.
Past performance, whether actual or indicated by historical tests of strategies, is no guarantee of future performance or success. There is a possibility that you may sustain a loss equal to or greater than your entire investment regardless of which asset class you trade (equities, options or futures); therefore, you should not invest or risk money that you cannot afford to lose. Online trading is not suitable for all investors. View the document titled Characteristics and Risks of Standardized Options at www.TradeStation.com . Before trading any asset class, customers must read the relevant risk disclosure statements on www.TradeStation.com . System access and trade placement and execution may be delayed or fail due to market volatility and volume, quote delays, system and software errors, Internet traffic, outages and other factors.
Securities and futures trading is offered to self-directed customers by TradeStation Securities, Inc., a broker-dealer registered with the Securities and Exchange Commission and a futures commission merchant licensed with the Commodity Futures Trading Commission). TradeStation Securities is a member of the Financial Industry Regulatory Authority, the National Futures Association, and a number of exchanges.
TradeStation Securities, Inc. and TradeStation Technologies, Inc. are each wholly owned subsidiaries of TradeStation Group, Inc., both operating, and providing products and services, under the TradeStation brand and trademark. When applying for, or purchasing, accounts, subscriptions, products and services, it is important that you know which company you will be dealing with. Visit www.TradeStation.com for further important information explaining what this means.
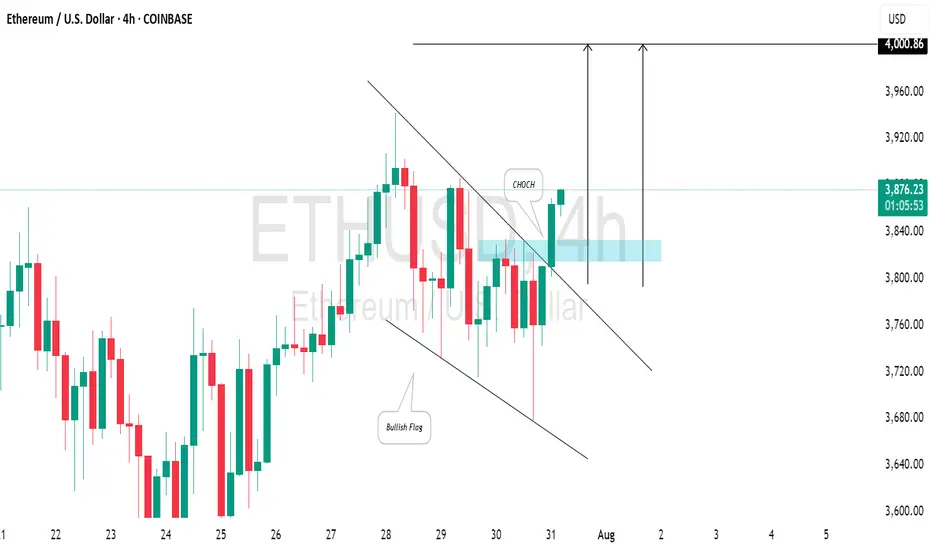
ETHEREUM (ETHUSD): Strong Bullish SignalsI spotted 2 important price action confirmations on 📈ETHEREUM:
The price has surpassed a resistance line of a bullish flag and established a confirmed change of character (CHoCH) on the 4-hour chart.
I believe the market will maintain a bullish trend, with the next resistance at the 4000 level.
How to accurately grasp the gold trading opportunitiesGold was greatly affected by the positive non-farm payroll data, and it rose strongly, with the increase completely covering all the losses this week. The current gold trend has completely reversed the previous bull-short balance. After breaking through the 3300 level and rising to around 3355, it maintains strong upward momentum, and the possibility of further testing the 3360-3375 area cannot be ruled out. Due to the strong positive data, if everyone fails to chase the long position or set a breakout long position in time in the first wave of the market, the subsequent pullback opportunities may be relatively limited, so it is necessary to maintain an active strategy in operation. It is recommended to continue to be bullish when it retreats to the 3335-3320 area, and the upper target is the 3360-3375 pressure range.
