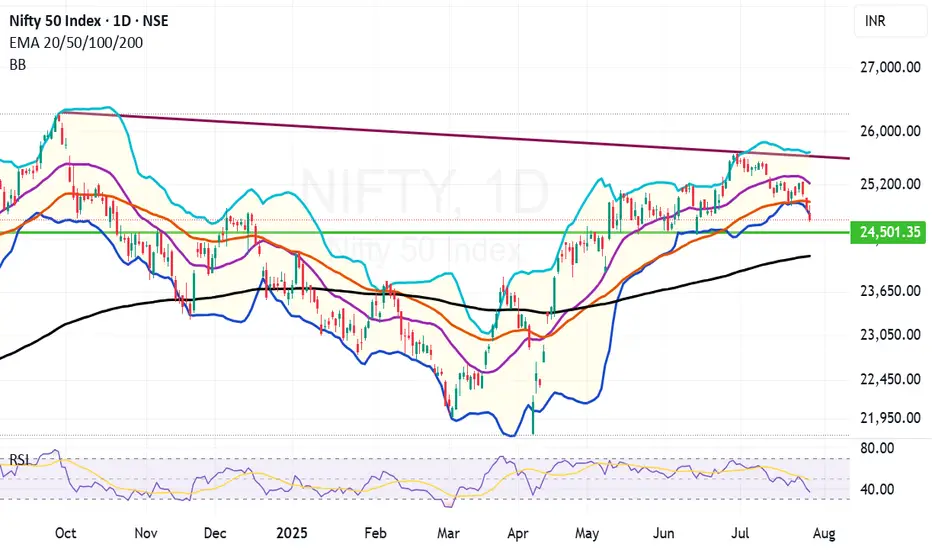
Bollinger band indicates that we might see a recovery soon. Bollinger band in a beautiful tool of Technical analysis. There are three lines in it. The upper bandwidth line, the middle line and the lower band width line.
As you can see in the chart. Whenever the stock or an index price touches or crosses the upper line the indication it gives is that the market is overbought and there is an imminent selling pressure.
Middle line indicates either resistance or support depending on the position of the candle within the band. It further indicates that Middle line will be support when the price is above it. It also indicates that middle Bollinger band will be a resistnace when the candles are below it.
Lower bandwidth line indicates a support zone. When the candles touch or cross it the indication it gives is that the market is oversold and there can be an imminent up move once this phenomenon happens.
Bollinger band in like a channel or a parallel chanel but a more accurate one and a more asymmetric one.
Currently you can see in the chart that Bollinger band has not only touched but also crossed the bottom bandwidth. This is an indication of an over sold market. Thus the indications we get from this tool are that there are very high chances for a short covering recovery or relief rally.
The indication is in sync with Tariff deadline which is tomorrow. Thus any positive announcement on that front can also initiate a strong or mild recovery rally. Thus we might see a bottom formation and recovery rather sooner than later.
Current Nifty closing is at:24680.
Upper band width is at: 25683 (This zone will work as strong resistance zone).
Mid Bandwidth is at: 25217 (This zone will be a Strong resistance).
Mother Line: 24942 (Strong Resistance).
Lower band width is at: 24750 (Weak Resistance).
Nearby support: 24501 (Support).
Father Line: 24157 (Strong Support).
It is a good time to reshuffle your Portfolios and initiate fresh buying in the blue-chip stocks which might be available at a good valuation.
Disclaimer: The above information is provided for educational purpose, analysis and paper trading only. Please don't treat this as a buy or sell recommendation for the stock or index. The Techno-Funda analysis is based on data that is more than 3 months old. Supports and Resistances are determined by historic past peaks and Valley in the chart. Many other indicators and patterns like EMA, RSI, MACD, Volumes, Fibonacci, parallel channel etc. use historic data which is 3 months or older cyclical points. There is no guarantee they will work in future as markets are highly volatile and swings in prices are also due to macro and micro factors based on actions taken by the company as well as region and global events. Equity investment is subject to risks. I or my clients or family members might have positions in the stocks that we mention in our educational posts. We will not be responsible for any Profit or loss that may occur due to any financial decision taken based on any data provided in this message. Do consult your investment advisor before taking any financial decisions. Stop losses should be an important part of any investment in equity.
Support and Resistance
SUI to $5.31? Chart Says It’s 22% Away!SUI is shaping up beautifully on the daily chart. After spending weeks in a consolidation zone, the price has finally broken out with strong momentum and reclaimed bullish territory. The CM_EMA TrendBars are showing green, which confirms a positive directional shift. This indicates the bulls are now back in control.
The most recent breakout has pushed SUI above a key structure level near $3.93, turning previous resistance into new support. What’s impressive is that price didn’t just break this level — it retested it and bounced sharply, suggesting strong buyer interest. This kind of price action is typically seen before continuation moves.
Currently, the setup shows a clean bullish structure. Price is holding firmly above the moving average and is supported by recent higher highs and higher lows. If this momentum continues, SUI could be on its way toward the next major resistance zones, clearly marked on your chart as Profit Target 1 ($5.014) and Profit Target 2 ($5.312).
Volume seems steady, not explosive, but enough to support a sustainable climb — which is ideal for swing setups. This gives the chart a healthy look, especially in the context of the wider altcoin recovery theme.
Now, let's talk about risk. The Stop-Loss is logically placed at $3.602, just below the most recent breakout level and the prior base structure. If the price breaks below this zone, it would likely invalidate the current bullish setup.
🎯 Trading Idea Based on Chart Setup:
• Entry: $4.213 (current zone)
• Stop-Loss: $3.602
• TP1: $5.014 — near-term resistance
• TP2: $5.312 — full extension target
• Risk-to-Reward: ~2.36 on TP2 💹
This is a favorable setup for swing traders with clear levels and a clean chart structure. The EMAs are aligned bullishly, and the breakout has followed a strong trend resumption. If the market conditions continue supporting altcoins, SUI has the potential to outperform in the coming weeks.
In summary, SUI is in a confirmed uptrend, riding strong momentum after a clean breakout. As long as price holds above $3.93 and especially above the stop at $3.60, the path of least resistance remains upward.

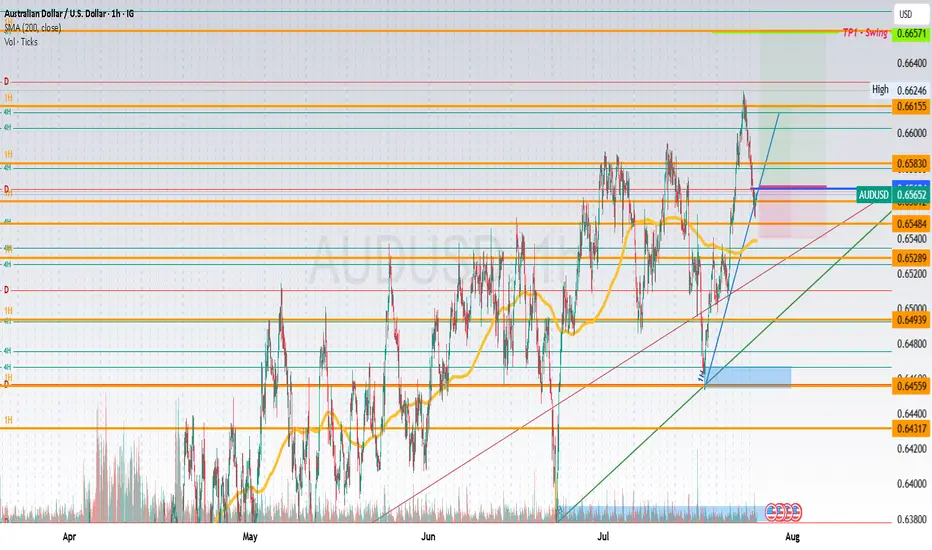
AU LongAUDUSD Entry
Entry @ break and retest of minor support/resistance and trendlines minor and 1H
TP1 where 1H and 4H PRZ share @ 0.66155 TP2 @ 0.66584
which also -27 on major structure fib
HH and HL showing on major structure, continuing the uptrend
Price retraced to 38.2, retesting 1H trendline
XAUUSD Technical Analysis – Educational Insight Key Observations:
🔴 Strong Support Zone (3,278 – 3,299 USD)
This zone has been highlighted as a key institutional level where buyers have consistently stepped in.
It aligns with previous Breaks of Structure (BOS), confirming its historical significance.
📉 Recent Price Action:
Price is retracing from the highs of around 3,439 USD and is approaching the strong support zone again.
A possible liquidity grab near the support is anticipated before a bullish reversal.
🔄 Break of Structure (BOS):
Multiple BOS marked indicate shifts in market direction and the presence of aggressive buying/selling phases.
These BOS events help identify trend continuation or reversal points.
🟢 Bullish Fair Value Gap (FVG):
A bullish FVG is present, indicating imbalance in price movement where institutions may look to fill orders.
Price previously reacted positively to this zone, indicating unfilled demand.
📈 Target Area:
A clearly marked target at 3,440.487 USD, which aligns with Buy-Side Liquidity, suggests a potential liquidity run.
This implies smart money may drive price upwards after collecting liquidity below support.
Volume Profile (VRVP):
The horizontal volume bars show the highest traded volume areas, providing confirmation for key support zones and BOS reactions.
🧠 Educational Insights:
BOS (Break of Structure) is used by institutional traders to spot shifts in trend. It typically signals continuation or reversal when aligned with liquidity concepts.
Liquidity Zones (like buy-side or sell-side liquidity) often serve as magnets for price; smart money aims to trigger orders and trap retail traders.
Fair Value Gaps represent imbalances where price moved too fast; institutions may return to these zones to execute pending orders.
Volume Profile Analysis helps in understanding where the most buying/selling occurred—confirming support and resistance zones.
📌 Strategy Suggestion (For Learning Only):
Entry Idea: Wait for price to tap the strong support (ideally sweep liquidity slightly below).
Confirmation: Look for bullish engulfing or BOS on lower timeframe to confirm reversal.
Target: 3,440 area where buy-side liquidity resides.
Stop Loss: Below the strong support (near 3,270 level) to protect against deeper liquidity grabs.
📢 Disclaimer (Educational Use Only):
This analysis is for educational purposes and not financial advice. Trading involves significant risk; always do your own research or consult a financial advisor.

EU sell on minor structureEntry @ break and retest of minor support and trendlines minor and 1H
TP1 where 1H and 4H POC share @ 1.1693
which also -27 on minor fib
LH and LL showing on 1H structure,
On minor structure, price retraced 50%, retesting 1H trendline

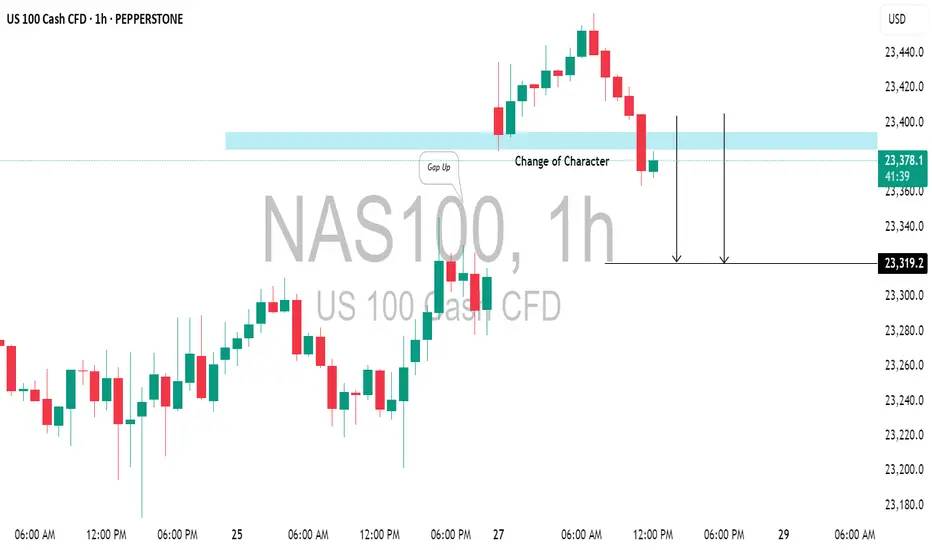
NASDAQ INDEX (US100): Another Gap For Today?I anticipate another gap up opening on the 📉US100 Index, which I believe will be filled today.
The formation of an intraday bearish change of character(CHOCH) on the hourly chart
This indicates a strong likelihood of continued bearish movement, with a target of 23319.
GOLD (XAUUSD)GOLD Market Outlook........
📍 Price broke daily trendline and is now retesting it.
📍 You marked a Break of Structure (BOS) — suggesting a shift in direction.
📍 Price is in a consolidation zone (range) with possible accumulation.
What to Expect:
- If price breaks above the range, expect a bullish push upward to the next supply level.
- If it rejects the upper box, it may return to fill imbalance or test previous lows again.
What You Should Do:
1. Wait for breakout confirmation from the consolidation zone.
2. For buys: Enter on a clear break and retest of the upper range box.
3. For sells: If price rejects the top and breaks back below, look for short entries toward support.

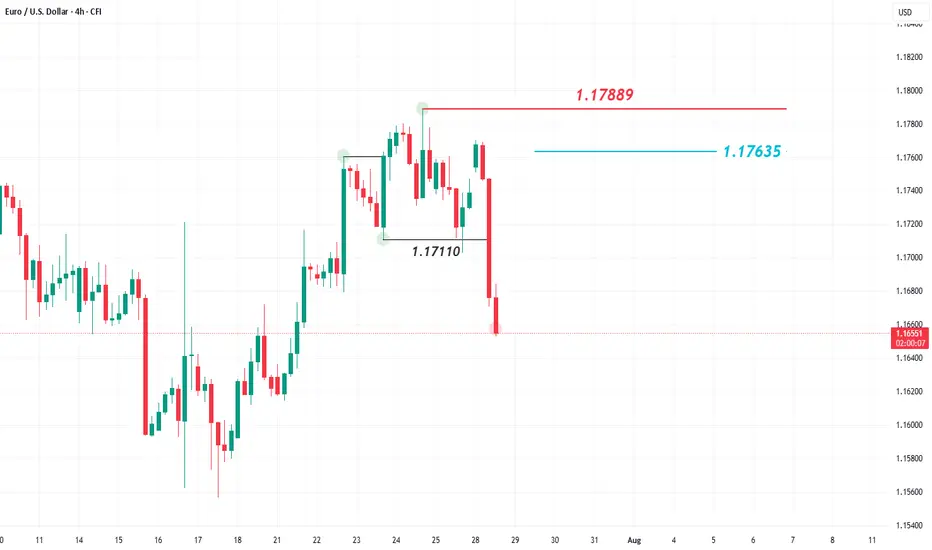
Euro takes a hit as trade deal with the US sparks a market rallyTrading this week kicked off with a trade agreement between the United States and the European Union, which pushed both the US and European indices to open in the green.
However, this development had a negative impact on the euro, which is experiencing a significant decline during today's session, Monday, July 28, 2025. Meanwhile, the US dollar is making a strong comeback, rising by 0.60% ahead of the US session open.
This recent decline has reversed the euro’s upward trend that it had maintained since the beginning of this month. The EUR/USD pair dropped again, hitting a new low below the 1.17110 level, which represents the last lower high of the bullish trend.
What is the likely upcoming scenario?
A price increase for the pair to the 1.17635 level would be considered a corrective move within the ongoing bearish trend. The negative outlook would not change unless the price records a higher high above the 1.17889 level on the 4-hour timeframe.
However, the EUR/USD is heading into an important week filled with key economic data and news, particularly from the US. This includes the US Non-Farm Payrolls set to be released on Friday, August 1, 2025, and the Federal Reserve meeting on Wednesday, July 30, 2025. The later will cover interest rate decisions and upcoming economic projections. The outcomes of these events are expected to have a direct impact on both the US dollar and the EUR/USD pair.
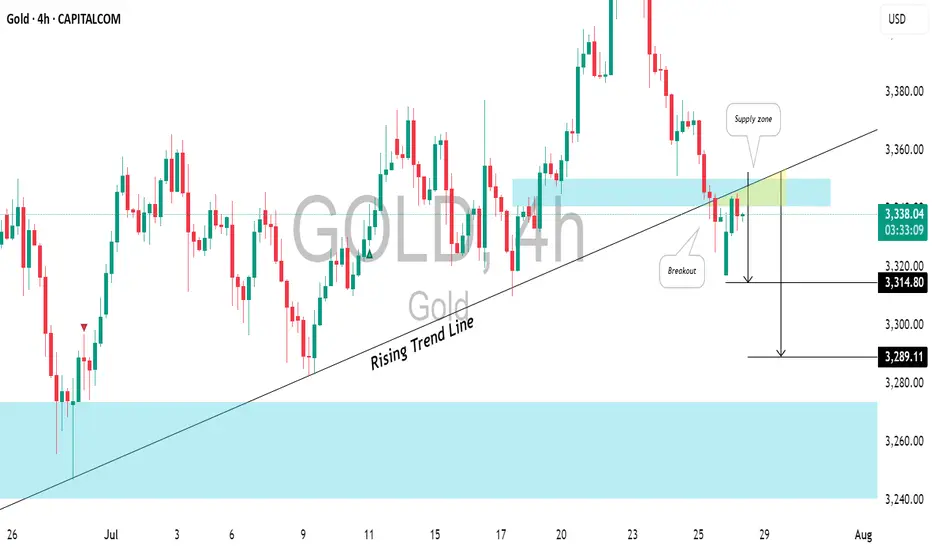
GOLD (XAUUSD): Important BreakoutsI've identified two significant breakouts on 📉GOLD.
The price violated a crucial intraday horizontal support and a major rising trend line.
These broken levels now form a contracting supply zone, suggesting that the price could continue to decline.
Target levels are 3314 and 3289.
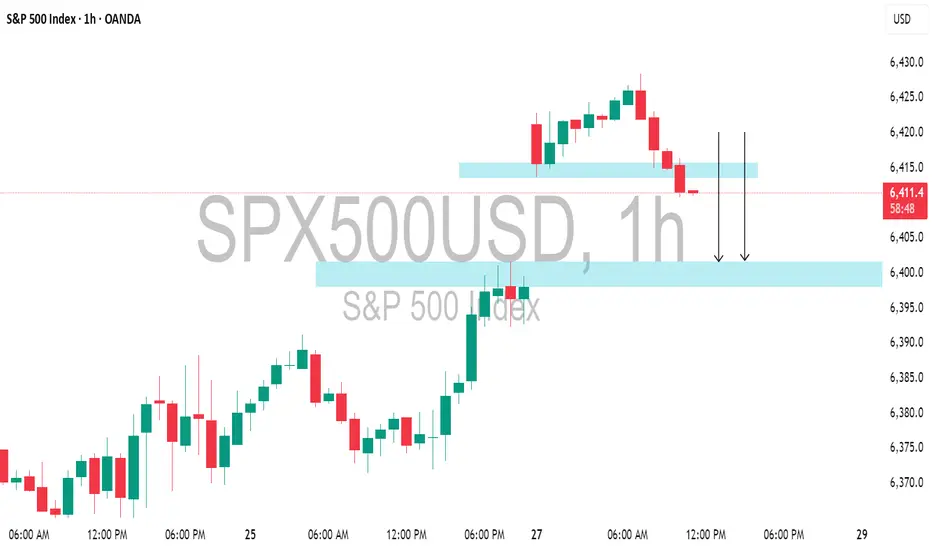
S&P500 INDEX (US500): Classic Gap Opening TradeI noticed a classic gap up opening on 📉US500 Index and believe it will be filled today.
The formation of an intraday bearish change of character (CHoCH) on the hourly chart indicates a strong likelihood of continued bearish movement.
Target - 6400.
Crypto VC Sees Resurgence — Satsuma Raises $135M, QCEX Secures $Amid persistent market volatility and macroeconomic uncertainty, venture capital is once again flowing into the crypto sector — and doing so with conviction. In recent weeks, two major players, Satsuma and QCEX, closed significant funding rounds, raising a combined $247 million. These deals signal a renewed appetite for Web3 and decentralized finance (DeFi) solutions, even as the broader market remains cautious.
Satsuma, a blockchain analytics and infrastructure startup, secured $135 million in its Series B round. According to insiders, leading investors include a16z Crypto, Polychain Capital, and Paradigm. The company focuses on developing high-performance tools for DeFi monitoring, on-chain risk management, and data analysis — solutions increasingly demanded by institutional clients.
Meanwhile, QCEX raised $112 million in a Pre-Series A round to accelerate the launch of its next-generation hybrid exchange. Targeting institutional traders, QCEX offers a dual-layer trading model that combines custodial infrastructure with decentralized security mechanisms. Investors include Galaxy Digital and several venture groups from the Middle East.
Why Do These Deals Matter?
Analysts say the return of venture capital to crypto is no longer driven by hype, but by fundamentals. Investors are now focusing on scalable, revenue-generating business models and robust technology stacks. After the fallout from FTX and the 2022–2023 market correction, due diligence is far more rigorous — and both Satsuma and QCEX meet these higher standards.
These funding rounds also create secondary market opportunities. Historically, successful VC deals have often preceded token launches or public offerings — opening the door for profitable early-stage investments. At BBDelta, we anticipate Satsuma may issue a utility token by 2026, while QCEX is already in talks with exchanges about potential listings.
The Bigger Picture
Crypto VC funding grew by 22% quarter-over-quarter, signaling the early stages of a new investment cycle. What’s notable is the shift in capital allocation: investors are moving away from purely speculative projects and into Web3 infrastructure, analytics, and compliance-focused platforms.
BBDelta believes this signals the arrival of "smart capital" — institutions betting not on short-term returns, but on long-term infrastructure that will underpin the next phase of crypto adoption.
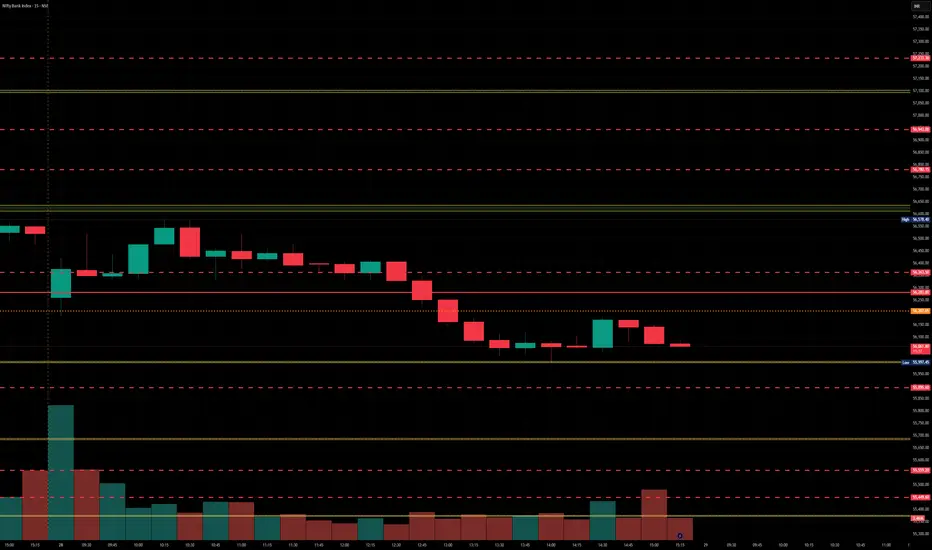
BankNifty levels - Jul 29, 2025Utilizing the support and resistance levels of BankNifty, along with the 5-minute timeframe candlesticks and VWAP, can enhance the precision of trade entries and exits on or near these levels. It is crucial to recognize that these levels are not static, and they undergo alterations as market dynamics evolve.
The dashed lines on the chart indicate the reaction levels, serving as additional points of significance. Furthermore, take note of the response at the levels of the High, Low, and Close values from the day prior.
We trust that this information proves valuable to you.
* If you found the idea appealing, kindly tap the Boost icon located below the chart. We encourage you to share your thoughts and comments regarding it.
Wishing you successful trading endeavors!
Nifty levels - Jul 29, 2025Nifty support and resistance levels are valuable tools for making informed trading decisions, specifically when combined with the analysis of 5-minute timeframe candlesticks and VWAP. By closely monitoring these levels and observing the price movements within this timeframe, traders can enhance the accuracy of their entry and exit points. It is important to bear in mind that support and resistance levels are not fixed, and they can change over time as market conditions evolve.
The dashed lines on the chart indicate the reaction levels, serving as additional points of significance to consider. Furthermore, take note of the response at the levels of the High, Low, and Close values from the day prior.
We hope you find this information beneficial in your trading endeavors.
* If you found the idea appealing, kindly tap the Boost icon located below the chart. We encourage you to share your thoughts and comments regarding it.
Wishing you success in your trading activities!

USDCAD 1H buyHello friends. If the price in USDCAD returns to the specified area on the 1h timeframe, it is suitable for a buy position.
This is just a theory

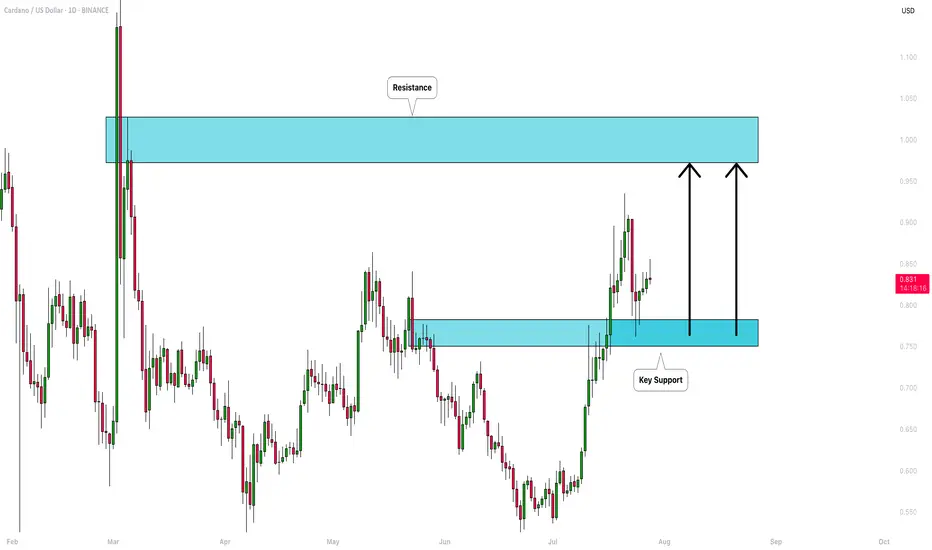
CARDANO (ADAUSD): Bullish Move Ahead!
ADA is testing a key daily support cluster.
I think the market is going to bounce from that
and continue growing.
Next resistance - 0.97
❤️Please, support my work with like, thank you!❤️
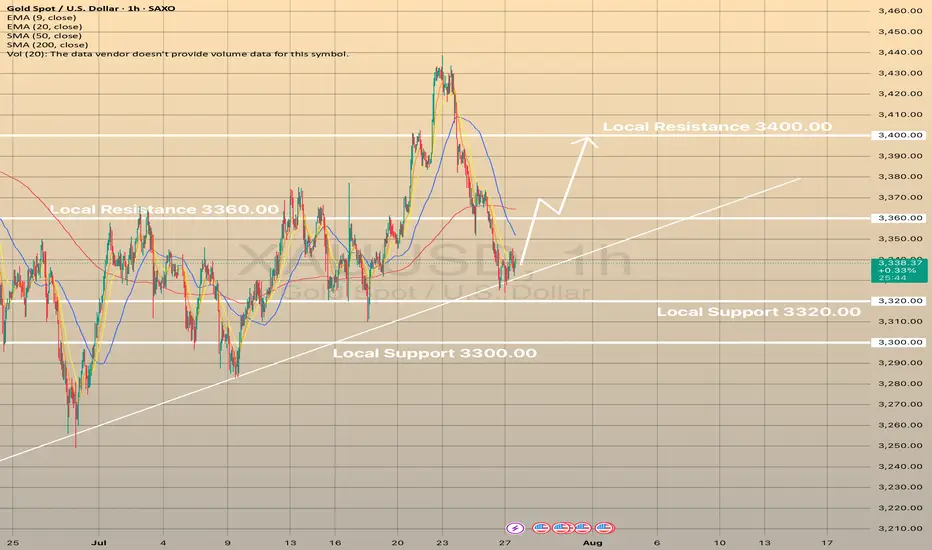
XAUUSD REBOUNDED FROM CURRENT TRENDLINE. WHAT'S NEXT?XAUUSD REBOUNDED FROM CURRENT TRENDLINE. WHAT'S NEXT?
Gold had successfully rebounded from the trendline, still showing mid-term bullish trend despite recent news on U.S. - E.U. and U.S. - Japan trade deals. Currently price is attempting to hold above the EMA20 on 1-h chart timeframe.
If this occurs and the asset develops another short-term bullish impulse, we may expect the price to reach 3,360.00 resistance level with further possible impulse towards 3,400.00 level.
Solana (SOL) Revs Up Again — Fresh Breakout Above $200 in Sight?After months of consolidation, Solana (SOL) is once again showing signs of bullish momentum, trading near $176 and rapidly approaching a potential breakout level of $200. Investors and analysts alike are paying close attention, as on-chain activity and ecosystem development provide a compelling case for a renewed upward trajectory.
With growing demand for high-throughput blockchain infrastructure and new institutional integrations, Solana is positioning itself as more than just an Ethereum alternative—it’s emerging as a core infrastructure layer for high-performance Web3 applications.
Institutional Momentum Gathers Pace
In the last three weeks, several high-profile announcements have bolstered confidence in the Solana ecosystem. Fidelity Digital Assets revealed it is piloting tokenized bond products on Solana’s network, citing its fast settlement time and composability.
Meanwhile, Visa expanded its USDC settlement pilot on Solana across five countries, reinforcing the blockchain’s real-world financial use cases.
“Solana is no longer just retail-driven,” said Karla Nunez, digital asset strategist at ApexBridge. “Institutions are beginning to build directly on it—and that changes the dynamic.”
Ecosystem Growth and Developer Activity
The number of active developers on Solana has surged 38% quarter-over-quarter, according to Electric Capital’s Developer Report. Projects in DeFi, gaming, and NFTs continue to attract users, helped by extremely low transaction costs and sub-second finality.
Notably, the Solana Foundation recently launched a $100 million grant fund for AI-integrated crypto applications, which could catalyze the next wave of user adoption.
Technical Indicators Support Breakout Narrative
SOL has outperformed major altcoins this month, rising 21% in July. The token is now trading above its 50-day and 100-day moving averages, and momentum indicators suggest a potential breakout above the key psychological barrier at $200.
A confirmed break would likely open the door to $240–$260, with minimal historical resistance in that zone.
Macro Factors Provide Tailwind
The broader crypto market is recovering as inflation metrics cool and expectations for central bank easing rise. Solana, with its high beta to market movements, often leads altcoin rallies during bullish pivots.
Furthermore, the recent dip in Ethereum gas prices has had limited impact on Solana’s user base, suggesting its appeal is increasingly based on performance, not cost arbitrage.
Conclusion
While risks remain—from network outages to broader market volatility—Solana’s resurgence appears fundamentally supported. With institutional interest rising, technical signals aligning, and ecosystem momentum building, a clean break above $200 could mark the beginning of a new cycle for SOL.
For investors seeking exposure to high-speed smart contract platforms with real-world traction, Solana may be nearing another defining moment.
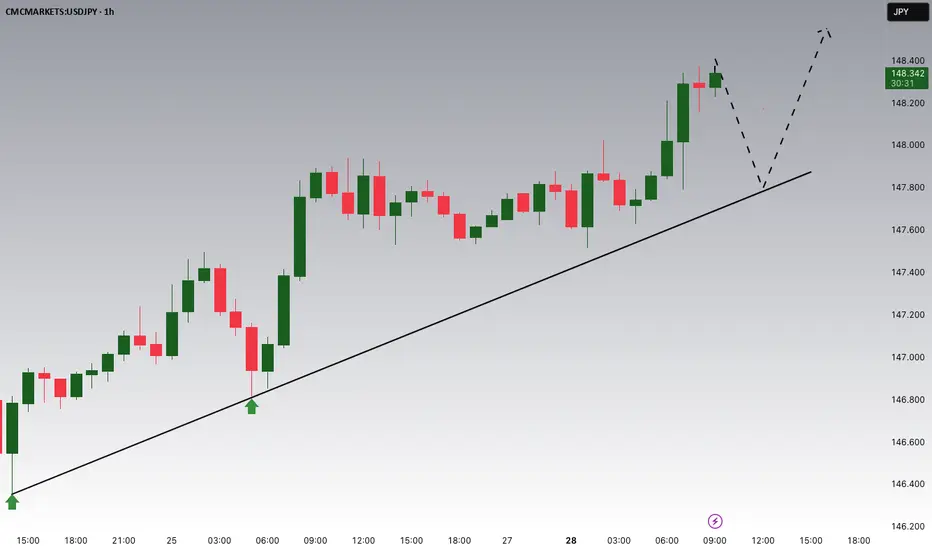
USDJPY Potential UpsidesHey Traders, in today's trading session we are monitoring USDJPY for a buying opportunity around 147.800 zone, USDJPY is trading in an uptrend and currently is in a correction phase in which it is approaching the trend at 147.800 support and resistance area.
Trade safe, Joe.
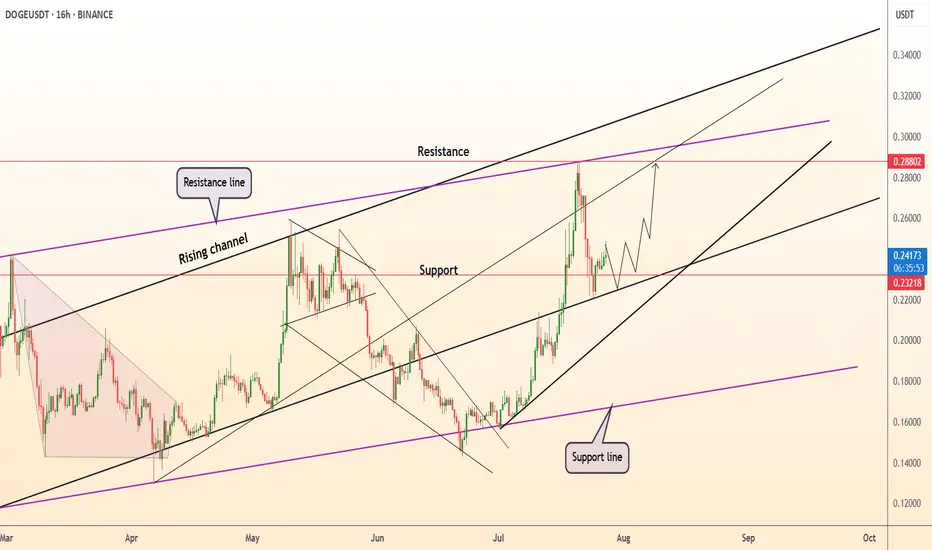
DeGRAM | DOGEUSD above the support level📊 Technical Analysis
● DOGE keeps printing higher swing-lows inside the 5-month rising channel; the latest pull-back bounced precisely at the mid-band/0.232 support, turning May’s flag roof into demand.
● A fresh micro bull-flag is unfolding above that rail; its pole height and channel geometry project follow-through toward the upper red supply 0.288-0.300 where the purple macro cap meets the channel crest.
💡 Fundamental Analysis
● Binance confirmed its late-July quarterly burn will include >150 M DOGE trading-fee tokens, trimming float, while reports of X testing DOGE micro-payments boosted social volume this week.
✨ Summary
Long 0.232-0.245; hold above 0.232 targets 0.272 → 0.288. Invalidate on a 16 h close below 0.214.
-------------------
Share your opinion in the comments and support the idea with a like. Thanks for your support!
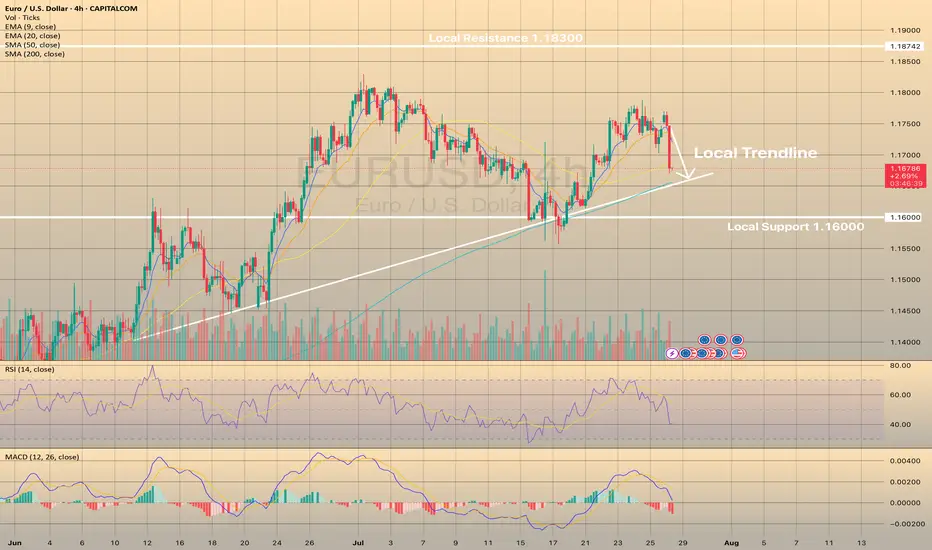
EURUSD LOSSES BULLISH MOMENTUM. WHERE TO GO?EURUSD LOSSES BULLISH MOMENTUM. WHERE TO GO?
The asset didn't reach the local resistance of 1.18300 and started to consolidate before reaching this level. RSI shows weakness of the impulse on 4-h chart, as well as MACD is in the red zone. Therefore, we expect the price to slowly decline towards local trendline, where SMA200 is situated.
GBPUSD ANALYSIS After seeing the weekly find support at the low of the previous bullish candle we could be looking for a push up on this pair but waiting to see how the pair trades for the London session today and if there will be a break of resistance on the 4hr timeframe

EURUSD Did Not Like the EU–US DealThe heavily one-sided EU–US deal has put negative pressure on EURUSD. Ahead of a crucial week filled with major events, including GDP data from both the Eurozone and the US, the PCE report, payrolls, and meetings from the FOMC and BOJ, EURUSD has broken a short-term head and shoulders formation. The pattern's target is near 1.1610.
A retest of the broken support is possible and could even extend to 1.1725. However, unless sentiment changes due to some news, this move may offer only a selling opportunity. The downward trend could also continue without pause.
Options market activity suggests that the 1.16 to 1.18 range is viewed as a "safe zone," with large players likely aiming to keep EURUSD within this band for the week. If the head and shoulders target is reached, EURUSD might stabilize and bounce around the 1.16 level.

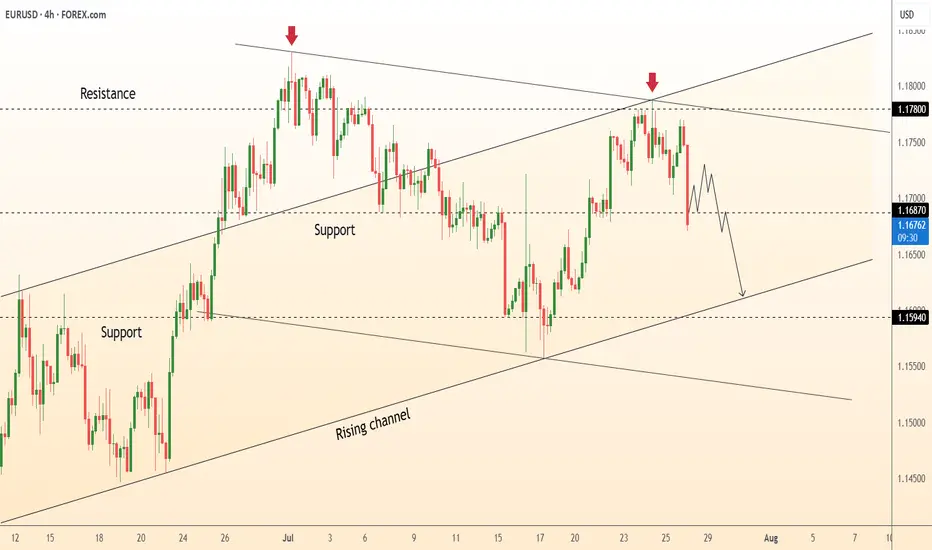
DeGRAM | EURUSD is correcting from the channel boundary📊 Technical Analysis
● A second rejection at the upper channel/1.1780 supply (red arrows) signals overextension; price is retracing toward the mid-July demand cluster where the rising-channel floor and prior swing base intersect near 1.1600.
● Momentum remains positive on higher-time-frame: each pull-back since May has held the channel support, and the current decline is unfolding as a corrective ABC that projects into 1.1585-1.1620 — a historically bid zone.
💡 Fundamental Analysis
● Softer US Q2-GDP deflator cooled 2-yr yields, while July Euro-area CPI flash is expected to stay sticky, trimming the Fed–ECB policy gap and limiting EUR downside.
✨ Summary
Buy 1.1585-1.1620; hold above 1.1594 targets 1.1687 → 1.1780. Long view invalidated on an H4 close below 1.1530.
-------------------
Share your opinion in the comments and support the idea with a like. Thanks for your support!