EURJPY → Retest support before growthFX:EURJPY has been correcting since the opening of the European session. The movement was triggered by yesterday's news related to the trade deal between the US and Europe...
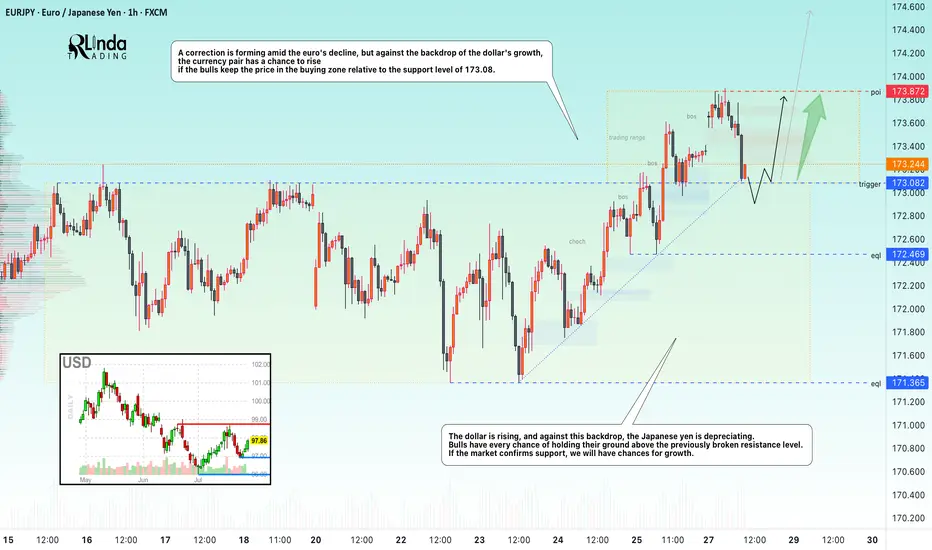
EURJPY is reacting to news related to the deal between the US and Europe. A correction is forming amid the fall of the euro, but against the backdrop of the dollar's growth, the currency pair has a chance to rise if the bulls keep the price in the buying zone relative to the support level of 173.08.
The dollar is rising, and against this backdrop, the Japanese yen is falling. Bulls have every chance of holding their ground above the previously broken resistance. If the market confirms support, we will have chances for growth.
Resistance levels: 173.87
Support levels: 173.082, 172.47
The currency pair may form a liquidity trap relative to the previously broken consolidation resistance. A false breakdown of support and price consolidation in the buying zone (above 173.1) could trigger further growth.
Best regards, R. Linda!
Support and Resistance
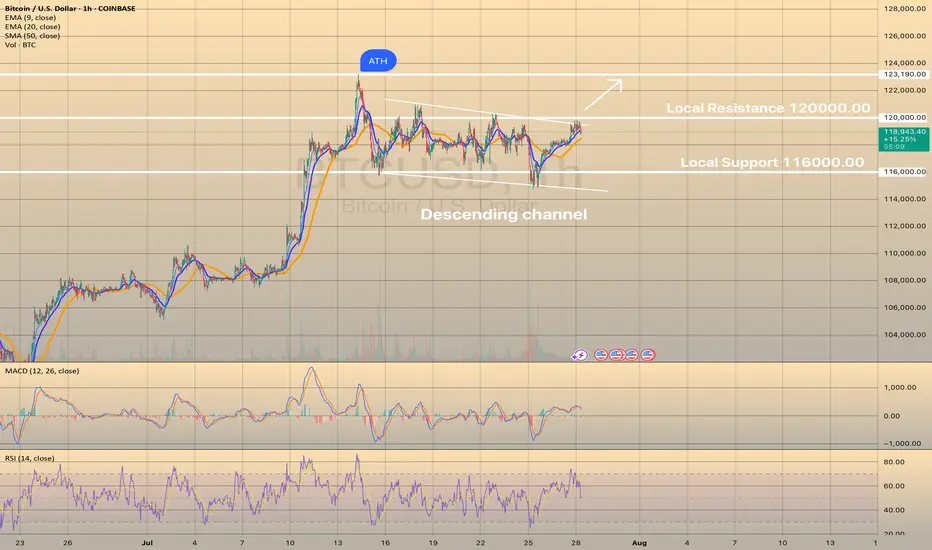
BTCUSD IS READY TO BREAK THE DESCENDING CHANNELBTCUSD IS READY TO BREAK THE DESCENDING CHANNEL
In our latest report we wrote down that the asset may rebound from lower border of the descending channel and head toward local resistance level of 120,000.00. The forecast has successfully worked out, so what's next?
Currently the price consolidates slightly below the upper border of the descending channel and local resistance level of 120,000.00. Although, the RSI and MACD confirm bullish impulse and, in general, the asset is in mid-term bullish trend, still would be safer for long trade to wait for a breakout of the resistance with first target of 123,190.30 (ATH).
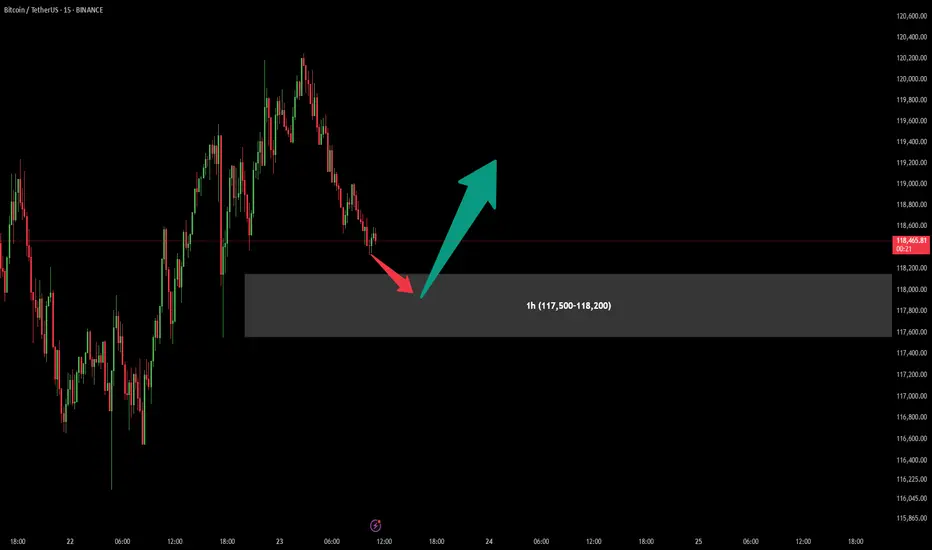
BitCoin BUY OfferAfter previous signal which have given us a good profit (more than 1:10 Risk to Reward), There is another chance for one more Buy position in specified are (117,500-118,200).
Attention : In my chart areas Stop Loss would be under the area (Over the area in Sell positions) and first Take Profit sets for at least R:R = 1:1
Let's see what will happen...
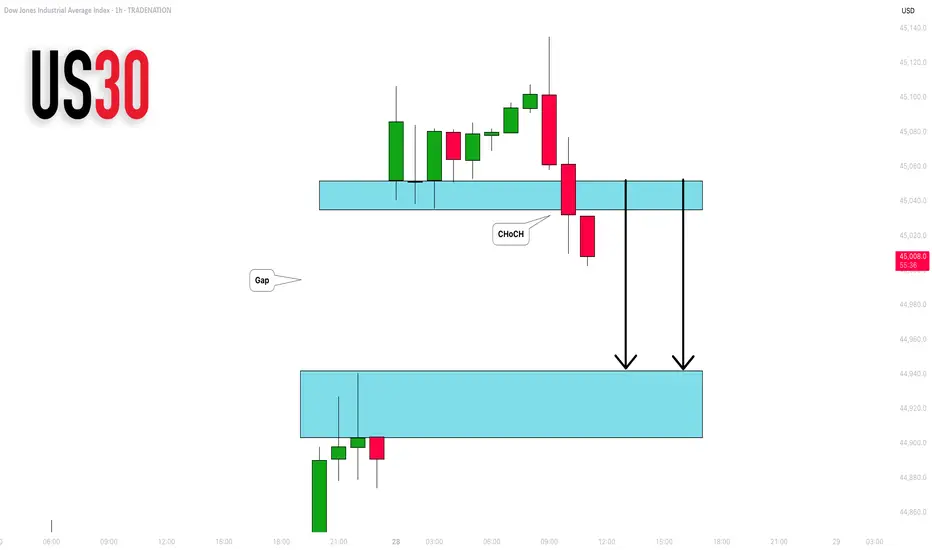
DOW JONES INDEX (US30): Another Gap For Today?
I see another gap up opening on US30 Index.
I think it will be filled today. A formation of an intraday
bearish CHoCH on an hourly time frame suggests
a highly probable bearish continuation.
Goal - 44943
❤️Please, support my work with like, thank you!❤️
I am part of Trade Nation's Influencer program and receive a monthly fee for using their TradingView charts in my analysis.
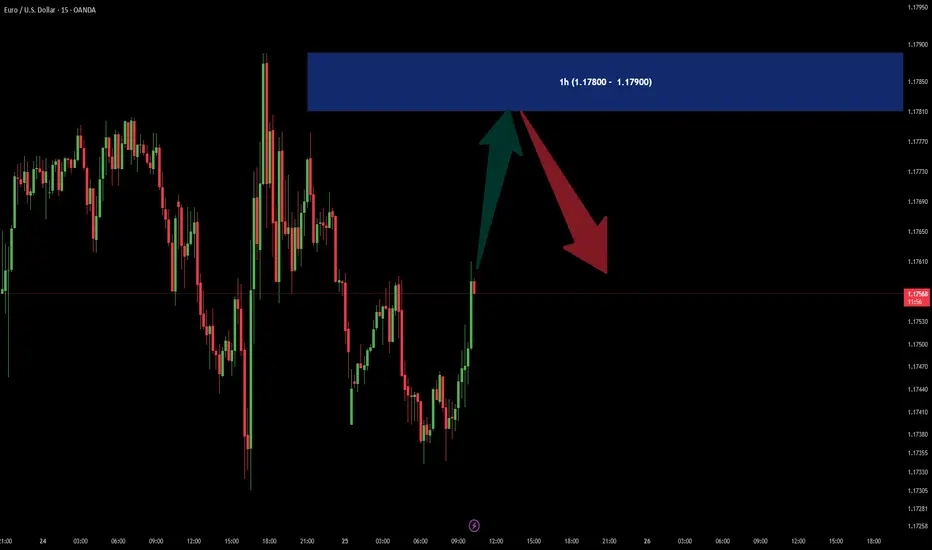
EURUSD SELL OFFERIn 1h time frame there is a SUPPLY area in (1.17800 - 1.17900) price zone.
It could be good for a SELL scalpers.
DeGRAM | BNBUSD above the support📊 Technical Analysis
● BNB is climbing a steep micro-channel nested in the long-term purple up-trend; the last dip stopped exactly at the $775 breakout shelf and printed a fresh higher-high, showing buyers still protect every pull-back.
● The old March resistance line has been broken and retested as support; its extension, plus the channel ceiling, converge at $835-840—matching the 1.618 flag-pole projection from July’s consolidation.
💡 Fundamental Analysis
● On-chain activity is surging: Yahoo Finance reports BNB Chain daily transactions and DEX volume just reached multi-month highs, underpinning spot demand.
✨ Summary
Long $775-790; hold above the green shelf targets $835 → $840. Invalidate on a 4 h close below $741.
-------------------
Share your opinion in the comments and support the idea with a like. Thanks for your support!

ETHUSD HEADS TOWARDS WEEKLY RESISTANCEETHUSD HEADS TOWARDS WEEKLY RESISTANCE
ETHUSD has broken local resistance of 3,850.00 and is currently heading towards weekly resistance of 4,100.00, the level, established in 2021. Last time the asset came close to this level at the end of last year and reversed from it afterwards. Same situation is expected here.
Price may retest the level of 3,850.00 and then head towards 4,100.00 level. No reversal signs on RSI or MACD. Vice a versa, RSI shows local strength of the asset, MACD is in the green zone. Buying volume highlights current bullish impulse.


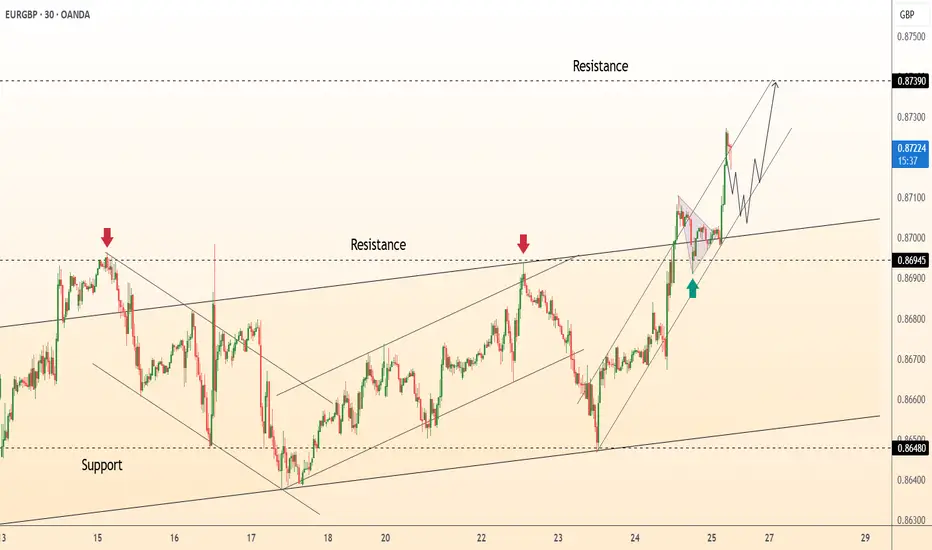
DeGRAM | EURGBP exited the channel📊 Technical Analysis
● Breakout: price burst from the July descending wedge, reclaimed 0.8695 former cap, and is now riding a steep intraday channel of higher-highs; the channel mid-line aligns with the broken wedge roof, adding fresh support.
● A pennant is consolidating just above 0.8695; its measured pole and the outer channel top converge at the next horizontal barrier 0.8739.
💡 Fundamental Analysis
● Softer UK July composite-PMI (47.9 vs 50.2 prior) revived BoE cut bets, while ECB speakers flagged “premature to talk easing,” narrowing the rate gap in the euro’s favour.
✨ Summary
Long 0.8695-0.8705; pennant break targets 0.8739. Bias void on a 30 m close below 0.8648.
-------------------
Share your opinion in the comments and support the idea with like. Thanks for your support!
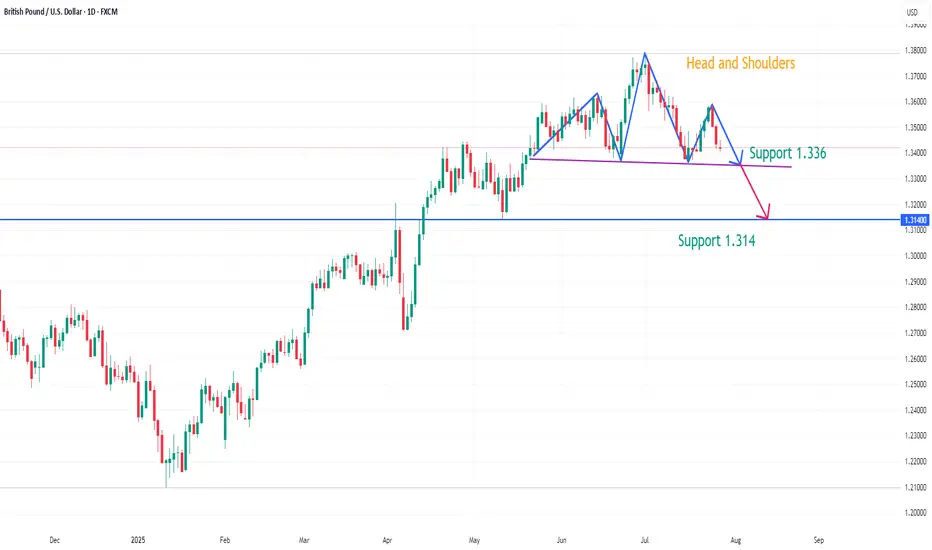
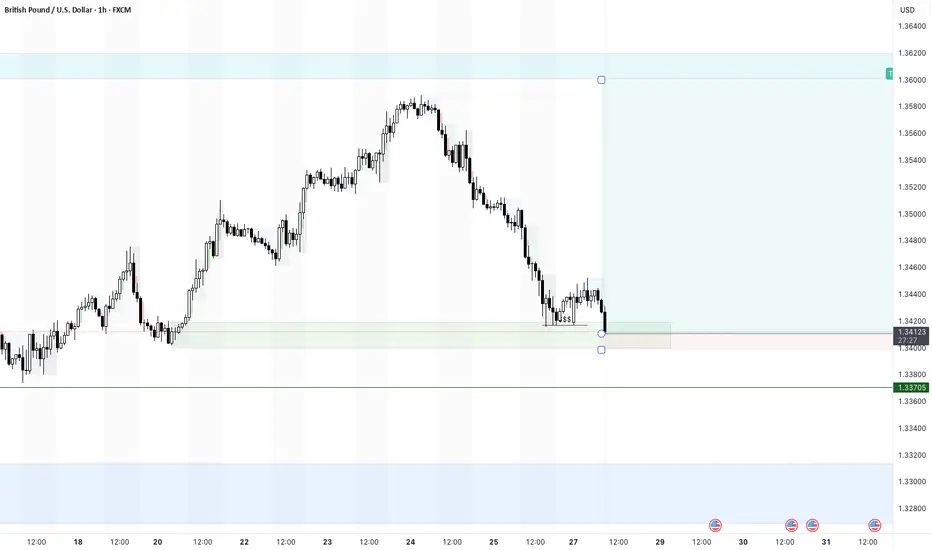
GBPUSD has formed a potential head and shoulders patternOn the daily chart, GBPUSD has formed a head and shoulders top pattern. The current support below is around 1.336. If it falls below, it is expected to continue to fall, with the downside target around 1.314. At present, you can pay attention to the short-selling opportunities around 1.345.
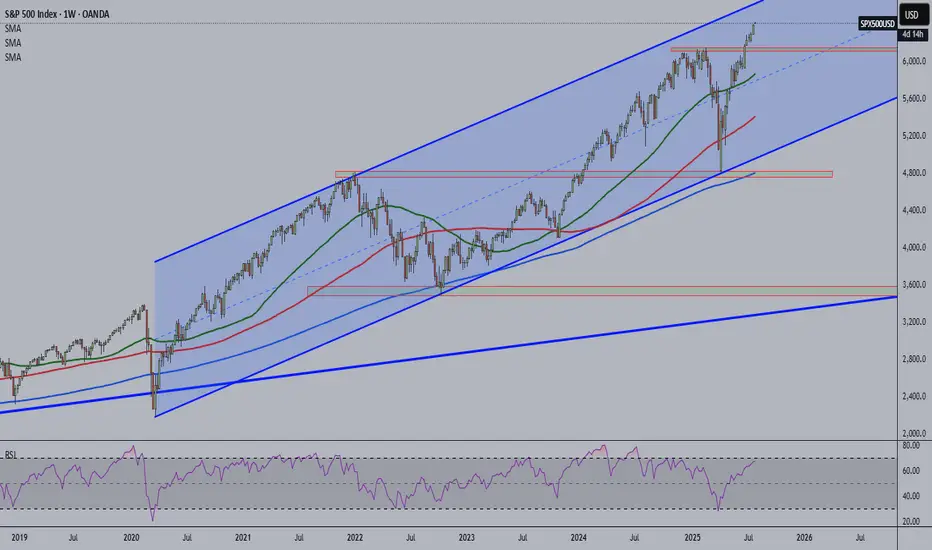
Overbought alert? The S&P500 is nearing weekly and monthly bullish channel resistance. Price has remained within this channel since 2020.
PEPPERSTONE:US500 VANTAGE:SP500
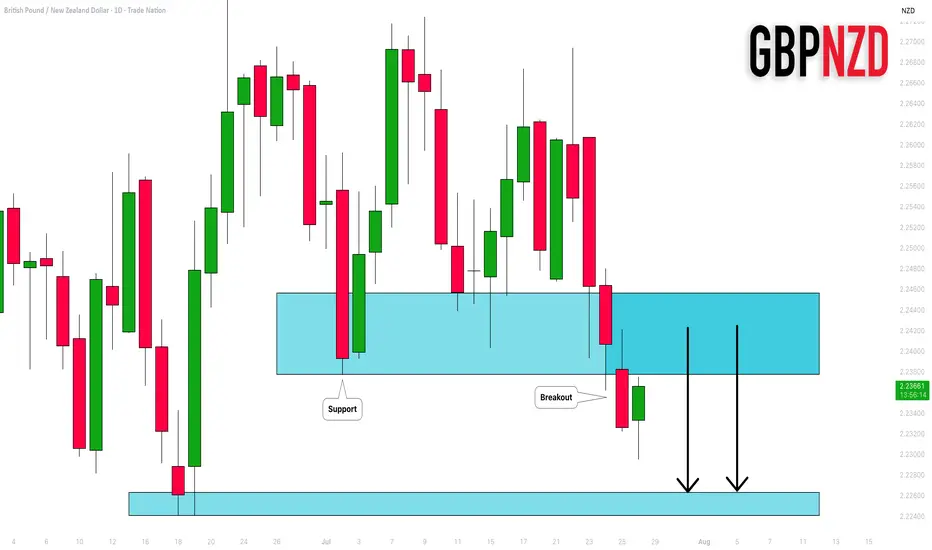
GBPNZD: Important Breakout 🇬🇧🇳🇿
GBPNZD broke and closed below a significant support cluster on a daily.
The broken structure turned into a strong resistance.
I will expect a bearish move from that.
Next support - 2.2264
❤️Please, support my work with like, thank you!❤️
I am part of Trade Nation's Influencer program and receive a monthly fee for using their TradingView charts in my analysis.
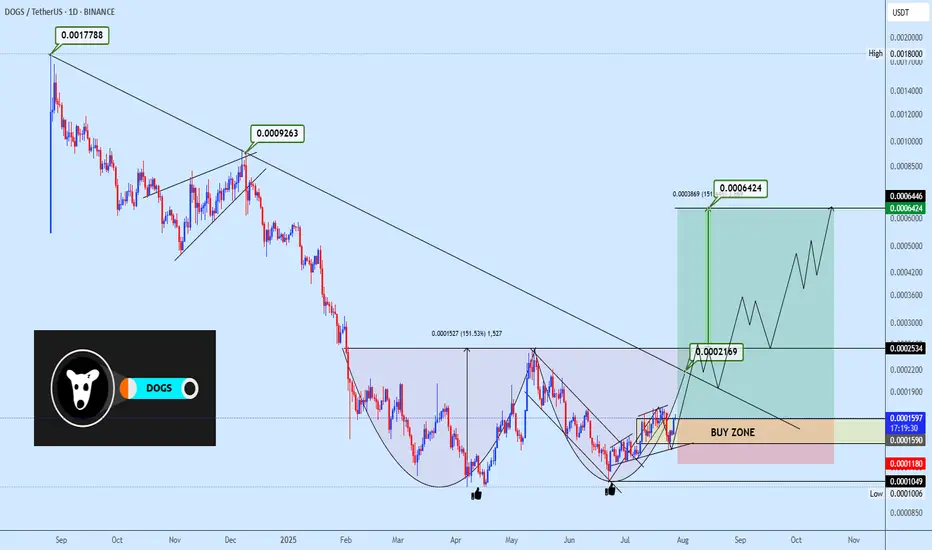
Dogsusdt double bottom formationDOGSUSDT is exhibiting a micro double bottom formation, with price rebounding from a previous support zone. The strategy is to accumulate within the highlighted area and monitor the neckline reaction around 0.0002534. A breakout above this level would validate the entire double bottom structure and set the stage for a move toward the projected targets. Enjoy.
Tesla Stock in Bearish Trend - Further Downside ExpectedTesla Stock in Bearish Trend - Further Downside Expected
Tesla's (TSLA) stock price continues to display a clear bearish trend structure, characterized by the formation of consistent lower lows and lower highs on the price chart. This technical pattern suggests sustained selling pressure and indicates the downtrend will likely persist in upcoming trading sessions.
Key Technical Observations:
- Established Downtrend: The consecutive lower highs and lows confirm the bearish price structure remains intact
- Weak Momentum: Each rally attempt has failed to gain traction, meeting selling pressure at progressively lower levels
- Critical Price Levels: The stock has established well-defined resistance and support zones for traders to monitor
Price Projections:
- Downside Target at $272: The bearish momentum could drive TSLA toward the $272 support level, representing a potential 15% decline from current levels
- Key Resistance at $370: Any recovery attempts will likely face strong selling pressure near the $370 level, which now serves as a major resistance barrier
Market Implications:
1. Bearish Continuation Expected: The prevailing trend structure favors further downside unless a significant reversal pattern emerges
2. Breakdown Risk: A decisive move below current support levels could accelerate selling momentum toward $272
3. Short-Term Rally Potential: While the overall trend remains down, temporary rebounds toward $370 may present selling opportunities
Trading Considerations:
- Short Positions: Consider maintaining bearish exposure while price remains below the $370 resistance level
- Stop Loss: A sustained break above $370 would invalidate the immediate bearish outlook
- Profit Targets: $272 serves as the primary downside objective, with potential support levels to watch along the way
Risk Factors to Monitor:
- Market sentiment shifts in the EV sector
- Changes in Tesla's production/delivery outlook
- Broader market conditions affecting tech/growth stocks
The technical setup suggests Tesla shares remain vulnerable to further declines, with $272 emerging as the next significant downside target. Traders should watch for either confirmation of the bearish continuation or potential reversal signals near key support levels. As always, proper risk management remains essential when trading in trending markets.

GBPUSD 28/7/25- Sweep and bullishI highlighted the equal liquidity zone and places a buy limit order.
This has been triggered and now will see if it holds.
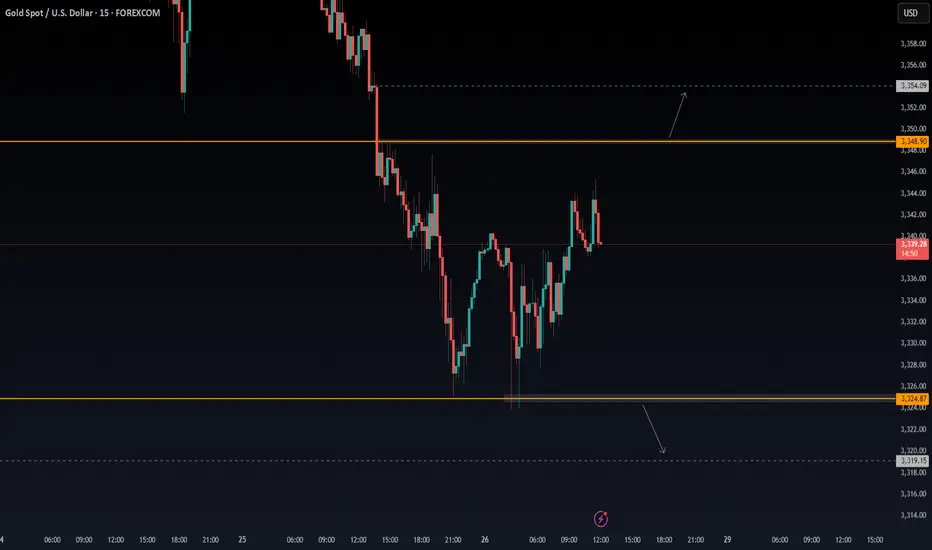
XAUUSD - Scalping ideaPrice is stuck in a range between 3348.90 and 3324.87.
📌 Looking for a clean breakout to take action:
Buy above 3348.90 → Targeting 3354.09
Sell below 3324.87 → Targeting 3319.15
Not interested in any trades inside the range only jumping in once we break out and close outside either level. Waiting for confirmation to avoid getting chopped up.
Let’s see where it goes. 📉📈
No rush, just reacting.
EURCHF: Classic Gap Trade 🇪🇺🇨🇭
There is a huge gap up opening on EURCHF.
The price tested a key intraday resistance with that and formed
a strong bearish imbalance candle then.
Probabilities will be high that the market will fill the gap today.
Goal - 0.9338
❤️Please, support my work with like, thank you!❤️

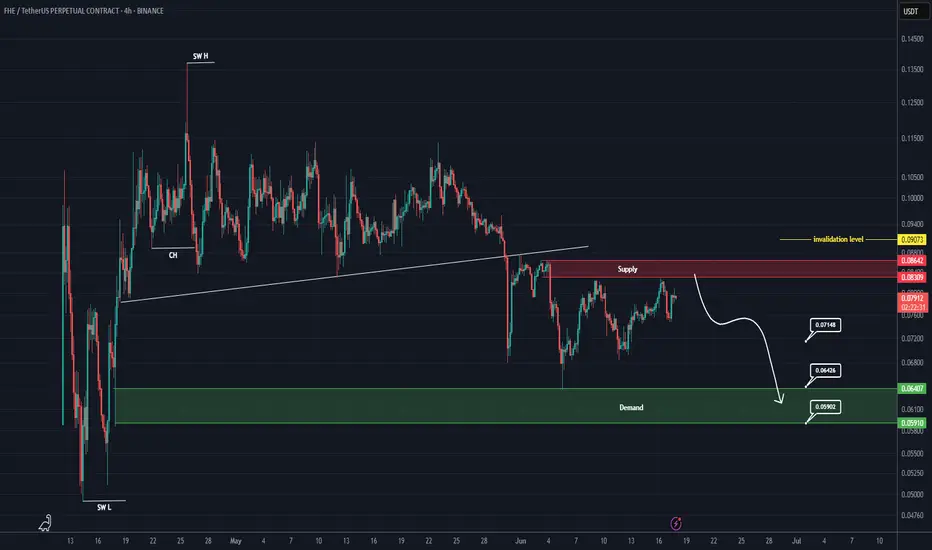
FHE Analysis (4H)A major structure in FHE has turned bearish, and the price is currently pulling back to a fresh and untouched order block. Additionally, the price is trading below supply zones on higher timeframes.
A drop toward the specified targets and the green zone is expected, as long as the red box is maintained.
A daily candle closing above the invalidation level will invalidate this analysis.
For risk management, please don't forget stop loss and capital management
When we reach the first target, save some profit and then change the stop to entry
Comment if you have any questions
Thank You
My UNH Thesis: Betting on a Healthcare Giant's Come BackThe healthcare sector has been in decline, which creates interesting opportunities. I recently talked about a few pharma plays - Eli Lilly, Novo Nordisk, and Pfizer.
Here's why I'm investing in NYSE:UNH :
UnitedHealth Group (UNH) has tanked ~50% in the past year, but the July 29 (VERY SOON) earnings could flip the script. As a historically dominant player, UNH is now undervalued amid sector weakness, offering massive upside if regulatory fears ease.
Here's my full bull case. 👇 FUNDAMENTAL ANALYSIS
Why the Sell-Off? A Perfect Storm of Bad News
UNH crushed the market for 15 straight years (2009-2023) with positive returns, predictable EPS growth, and 134% gains over the last decade.
But 2024 brought chaos:
Feb: Massive cyber attack caused a one-time EPS hit (non-recurring).
Ongoing: DOJ antitrust probe, criminal fraud investigation, rising Medicare costs, and Optum losses.
April: Disastrous Q1 earnings miss + lowered guidance.
Leadership drama: CEO death.
This erased gains (down 7% over 5 years), amplified by healthcare sector outflows—the biggest since 2020. But is this overblown? Signs point to yes. The markets almost always overreact to bad news.
Bullish Signals: Insiders Betting Big
The tide is turning:
Insider Buying Boom: $32M+ in 2024 (vs. $6.6M in 2019), including new CEO/CFO—highest in 15 years.
Congress Buying: Q2 2024 saw net purchases for the first time in 5 years (vs. historical selling).
DOJ Shift: Probe refocusing on pharmacy benefits (PBM) unit, dropping acquisition/monopoly scrutiny—implies no major findings. Great news!
Sector Tailwinds: Healthcare is one of 3 S&P sectors below historical valuations. Super investors (usually tech-obsessed) are piling in, despite the sector's -10% YTD vs. S&P's +13%.
Plus, UNH's dividend yield is at a record ~3% (vs. 1.5% avg), with 16%+ historical growth and 100%+ free cash flow conversion. Rare combo of yield + growth!
Valuation: Screaming Buy?
UNH trades at PE ~11.9 (vs. 10-year avg 23)—a steal.
Analysts project 16.7% EPS CAGR through 2029.
Conservative Scenario: 16.5% EPS growth + PE to 16.5 = $780/share by 2030 (173% total return, 18% CAGR ex-dividends).
Optimistic: PE back to 23 = $1,084/share (280% return).
Models confirm:
DCF (8% FCF growth): ~$484/share (70% upside).
DDM (7% div growth): ~$607/share (112% upside).
Blended Fair Value: ~$545/share (75-90% upside from ~$300). Buy below $436 for 20% safety margin.
Still, there is fear of DOJ uncertainty—investors hate unpredictability and that's why the stock is so low.
Key Catalyst: July 29 Earnings
This could be UNH's "most important report ever." Watch for:
Regulatory/legal updates (DOJ progress).
Full-year guidance revisions.
Metrics like medical loss ratio and PBM performance.
Positive news = potential rocket 🚀. Expectations are low (20 bearish EPS revisions vs. 0 bullish), so a beat could spark volatility... upward.
Risks: Not Without Bumps
Regulatory escalation (e.g., PBM issues) could tank it further.
Short-term headwinds: Medicare costs, sector selling.
Mitigants: DOJ de-risking, strong FCF buffer, insider confidence. Enter cautiously—size positions small.
TECHNICAL ANALYSIS
I also did a little technical analysis:
UNH price is at a resistance level
My EVaR indicator tells me we are in a low-risk area
RSI says the stock is oversold
I added the different price targets for better visualization
THE PLAN
My plan:
Later today, I will allocate 1% to 1.5% of my portfolio to the stock. If it drops, I will continue to DCA. The stock is already really beaten down, and I think a company this large cannot drop much more.
Quick note: I'm just sharing my journey - not financial advice! 😊

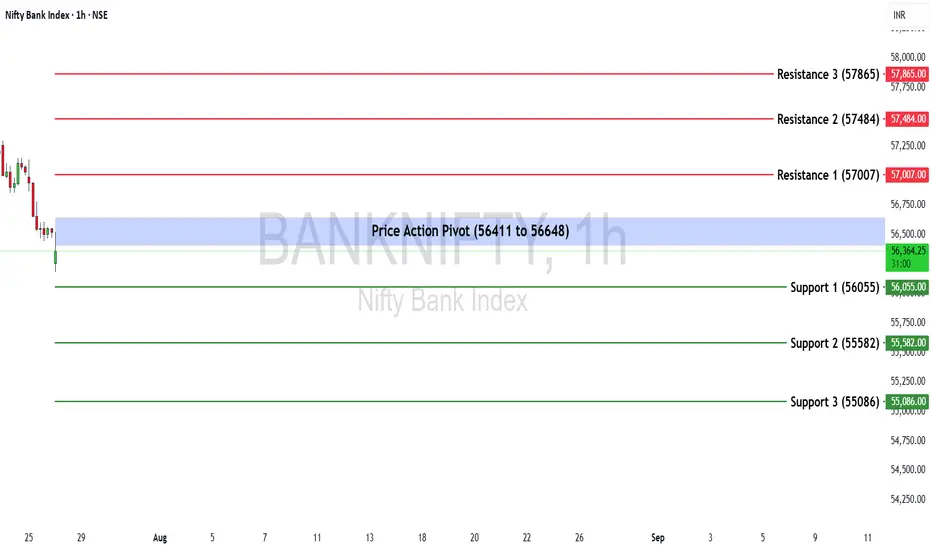
Bank Nifty Weekly Insights: Key Levels & TrendsBank Nifty ended the week at 56,528.90, registering a marginal gain of +0.44%.
🔹 Key Levels for the Upcoming Week
📌 Price Action Pivot Zone:
The critical zone to monitor for potential trend reversals or continuation lies between 56,411 and 56,648.
🔻 Support Levels:
Support 1 (S1): 56,055
Support 2 (S2): 55,582
Support 3 (S3): 55,086
🔺 Resistance Levels:
Resistance 1 (R1): 57,007
Resistance 2 (R2): 57,484
Resistance 3 (R3): 57,865
📈 Market Outlook
✅ Bullish Scenario:
If Bank Nifty sustains above the pivot zone (56,648), it may trigger renewed buying interest, potentially pushing the index toward R1 (57,007) and higher levels like R2 (57,484) and R3 (57,865).
❌ Bearish Scenario:
A breakdown below the lower end of the pivot zone at 56,411 may attract selling pressure, dragging the index towards S1 (56,055) and possibly lower levels like S2 (55,582) and S3 (55,086).
Disclaimer: lnkd.in
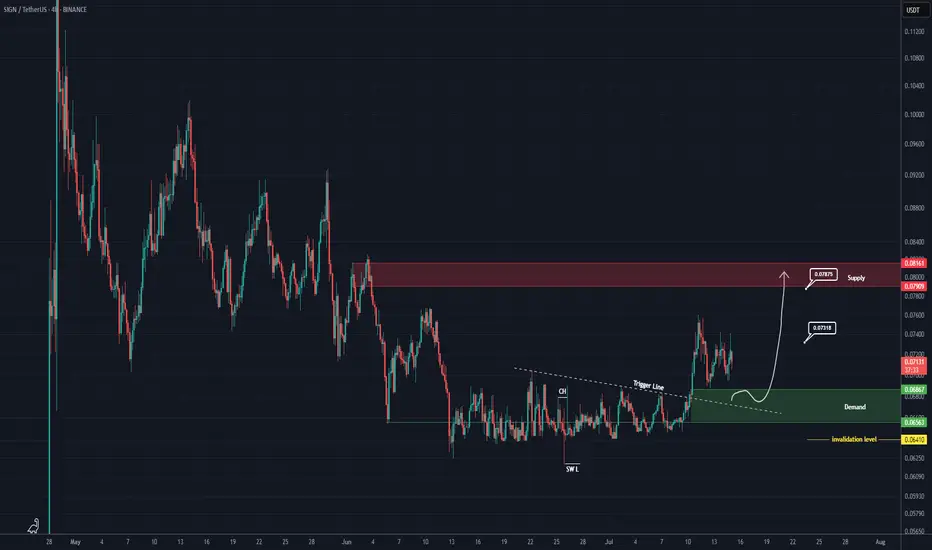
SIGN buy/long setup (4H)A tight consolidation range has been broken to the upside, and price has not yet pulled back to it.
On the chart, we have a trigger line breakout and the formation of a bullish change of character (CH).
When the price reaches the green zone, we can look for buy/long positions.
Targets are marked on the chart.
For risk management, please don't forget stop loss and capital management
Comment if you have any questions
Thank You
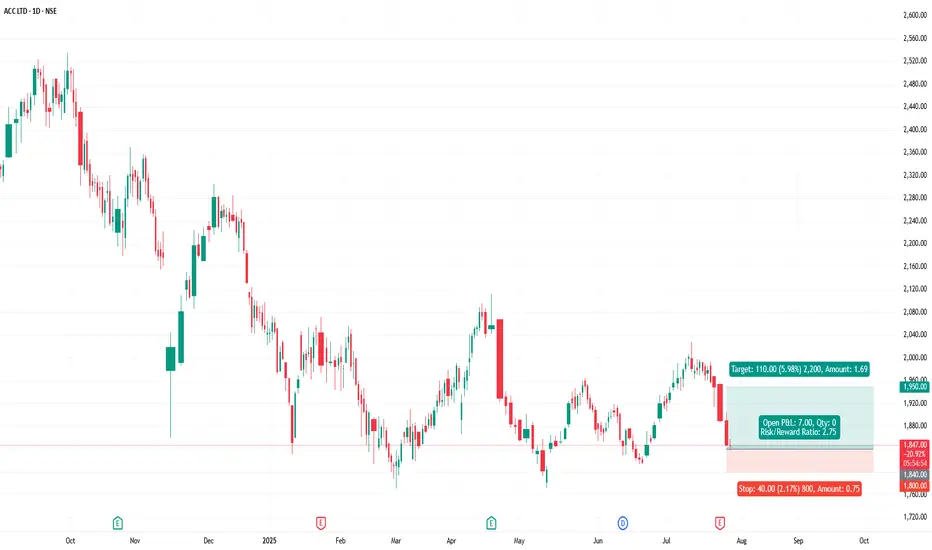
ACC - ACC Ltd (Daily chart, NSE) - Long PositionACC - ACC Ltd (Daily chart, NSE) - Long Position
Risk assessment: Medium {support structure integrity risk}
Risk/Reward ratio ~ 2.75
Current Market Price (CMP) ~ 1848
Entry limit ~ 1845 to 1835 (Avg. - 1840) on July 28, 2025
Target limit ~1950 (+5.98%; +110 points)
Stop order limit ~ 1800 (-2.17%; -40 points)
Disclaimer: Investments in securities markets are subject to market risks. All information presented in this group is strictly for reference and personal study purposes only and is not a recommendation and/or a solicitation to act upon under any interpretation of the letter.
LEGEND:
{curly brackets} = observation notes
= important updates
(parentheses) = information details
~ tilde/approximation = variable value
-hyphen = fixed value