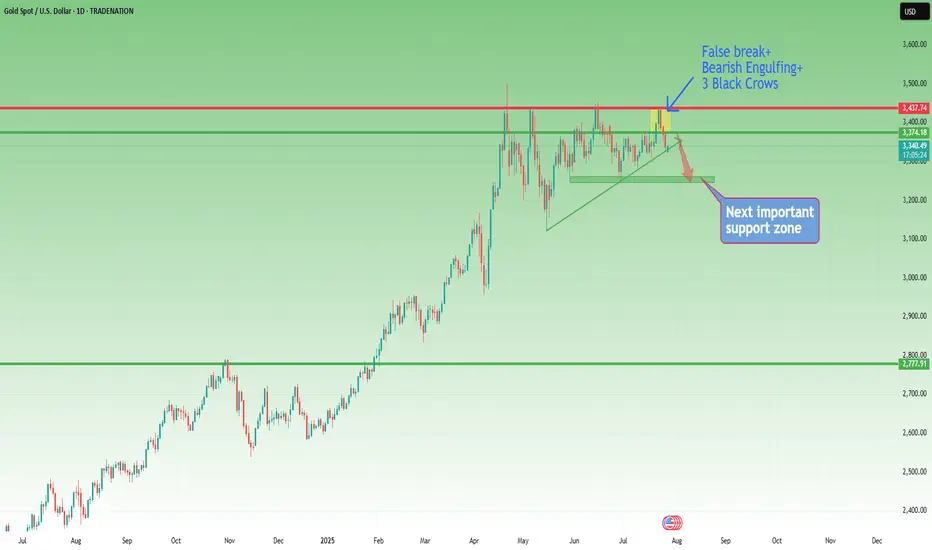
Gold Breakout Failed – Bearish Reversal in Play?Last week was both interesting and revealing for Gold.
After breaking above the key $3375 resistance—which also marked the upper boundary of a large triangle—price quickly accelerated higher, reaching the $3440 resistance zone.
However, instead of a bullish continuation, we witnessed a false breakout and sharp reversal. What initially looked like a healthy pullback turned into a full bearish rejection by week’s end.
________________________________________
📉 Current Technical Picture:
• On the daily chart, we now see a clear Three Black Crows formation
• On the weekly chart, a strong bearish Pin Bar confirms rejection
• And if we add the failed breakout above 3375, the bias tilts decisively bearish
________________________________________
📌 Key Zones and Trading Plan:
• Gold is currently bouncing from the ascending trendline zone, which is natural after dropping more than 1,000 pips in just 3 days
• The $3375–3380 area has regained importance as a key resistance zone, and that’s where I’ll be looking to sell rallies
• A bullish invalidation would only come if price manages to stabilize above $3400
Until then, this remains a bear-dominated market, and a drop below $3300 is on the table.
________________________________________
🧭 Support levels to watch:
• First support: $3280
• Major support: $3250 zone
________________________________________
📉 Conclusion:
The failed breakout, bearish candle formations, and current price structure all point to a market that's shifting in favor of sellers.
I’m looking to sell spikes into resistance, with a clear invalidation above $3400.
Disclosure: I am part of TradeNation's Influencer program and receive a monthly fee for using their TradingView charts in my analyses and educational articles.
Support and Resistance
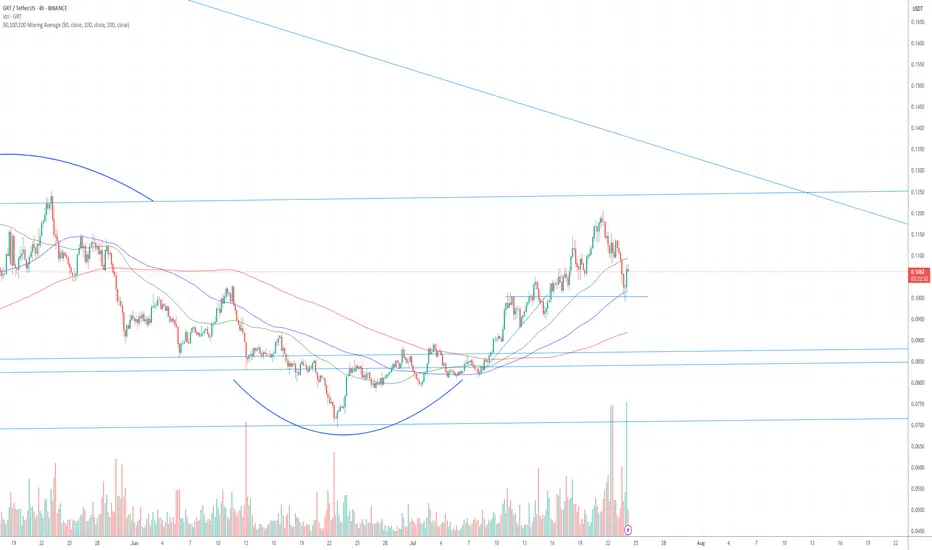
Nice Bounce for GRT - What's next? *4 Hour Charting*I re-entered a trade at the 50ma (on the 4-hour) for a significantly smaller position than my previous trade where I went 40x long. There is no leverage here - not because I lack confidence in the trade, but because risk management is the single most important think you can do to protect yourself... and the best way to risk manage is to POSITION SIZE CORRECTLY.
I bought a traunch (about 1/6 the size of my 40x trade), using all of the profits from from my prior trade. I entered at .102 and feel pretty confident we won't go lower. Thus far we have seen a 7% bounce off the 100ma retest.
If we go lower, the 200ma will act as major support around 0.092 ... If that happened, I would probably re-enter on leverage knowing that this is going to re-test the .12-.13 level again.
Something to note... other coins got crushed much harderr and have yet to rebound...
GRT's rebound shows relative strength - and the higher than normal volume supports his thesis.
Short-Term capitulation likely occurred today with people taking profits and avoiding additional risk.
I will exit this trade on a retest of .12, but as you all know, the more we re-test, the higher the probability we break through it, so I might not actually exit the trade depending on the price action. The longer it takes to hit .12, the less likely I am to close the trade. If we see a re-test to the upside in the next 72-hours, I would likely exit this particular trade.
I have a large core position here that I've been holding since 2021 that I don't intend to sell until we see alt-season in full bloom
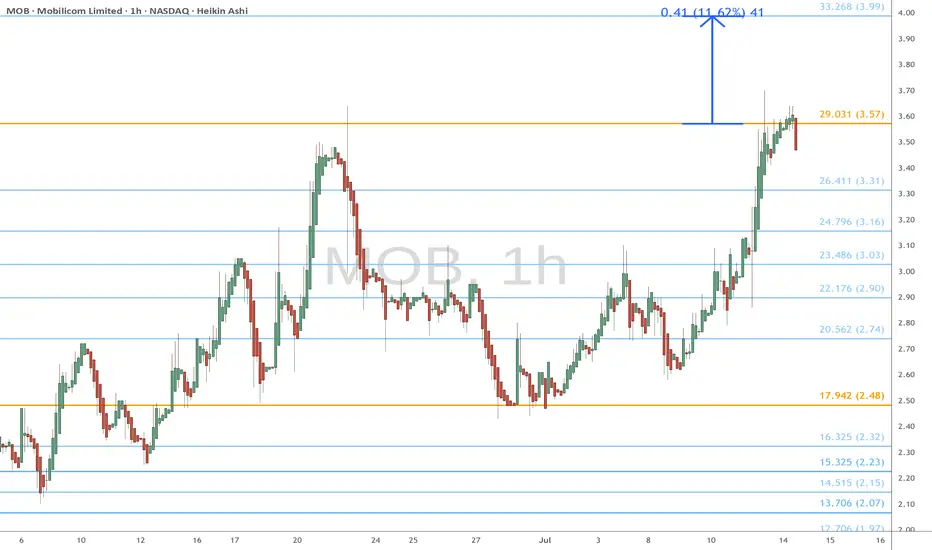
MOB eyes on $3.57: Break should POP and run OR Double TopMOB with a nice recovery from much needed retrace.
Once again testing the proven Golden Genesis fib at $3.57
If/when it breaks it should be a quick pop and then some.
EURUSD InsightWelcome, everyone.
Please share your personal opinions in the comments. Don’t forget to hit the boost and subscribe buttons.
Key Points
- The U.S. and the EU have reached a trade agreement to impose a 15% tariff on EU goods, including automobiles. However, President Trump stated that pharmaceuticals, steel, and aluminum would be exempt from the 15% tariff. Both sides also agreed to mutually waive tariffs on "strategic items" such as aircraft and semiconductor equipment. Additionally, the EU has agreed to purchase $750 billion worth of U.S. energy and to invest an additional $600 billion in the U.S.
- High-level trade talks between the U.S. and China will be held on July 28–29, with the market expecting an extension of the current trade truce.
- Ahead of the FOMC meeting scheduled for July 29, markets are projecting an interest rate cut more likely in September rather than July.
Key Economic Events This Week
+ July 29: U.S. Department of Labor JOLTS
+ July 30: Germany Q2 GDP, U.S. July ADP Non-Farm Employment Change, U.S. Q2 GDP, Bank of Canada interest rate decision, FOMC meeting outcome
+ July 31: Bank of Japan interest rate decision, Germany July CPI, U.S. June Core PCE Price Index
+ August 1: Eurozone July CPI, U.S. July Non-Farm Payrolls, U.S. July Unemployment Rate
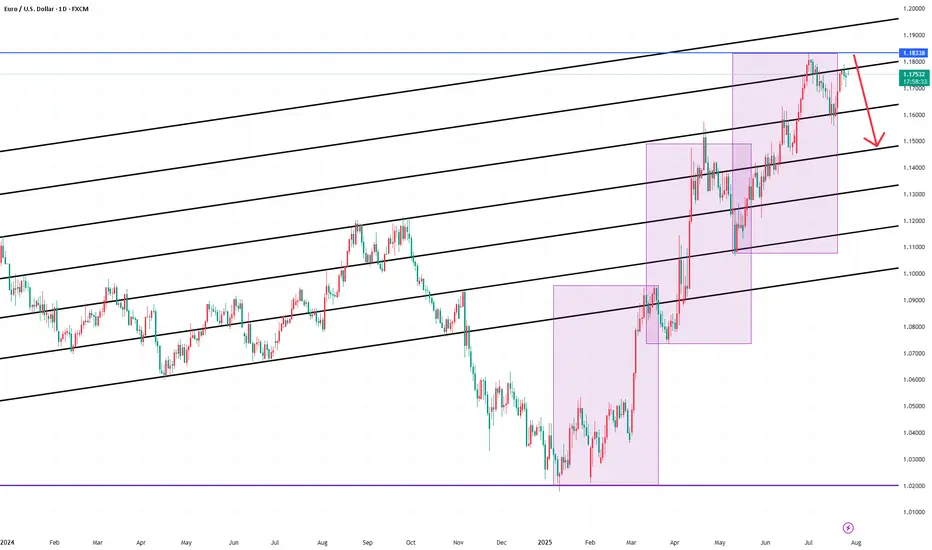
EURUSD Chart Analysis
The pair is showing an upward trend after finding support near the 1.16000 level. However, with resistance at the 1.18000 level—where the price previously faced rejection—the overall bias still appears bearish. That said, a breakout above this resistance line could signal a continuation of the uptrend, warranting close monitoring. For now, the outlook remains bearish toward the 1.15000 level. Should a breakout be confirmed, we will promptly revise our strategy.
GBP/CAD 4H Setup – Bearish Rejection at Key ZonePrice retested the 1.8420–1.8437 supply zone and showed a clear rejection, aligning with the previous trendline break. We're now seeing lower highs forming with bearish momentum.
🔻 Entry: Around 1.8410 – 1.8400
🎯 Target: 1.8313 (previous demand zone)
🛑 Stop Loss: 1.8437 (above structure)
Bias: Bearish below 1.8437 zone
If momentum continues, price could drop toward the 1.8310 support zone. Structure shows clean bearish control unless a breakout occurs back above the supply area.

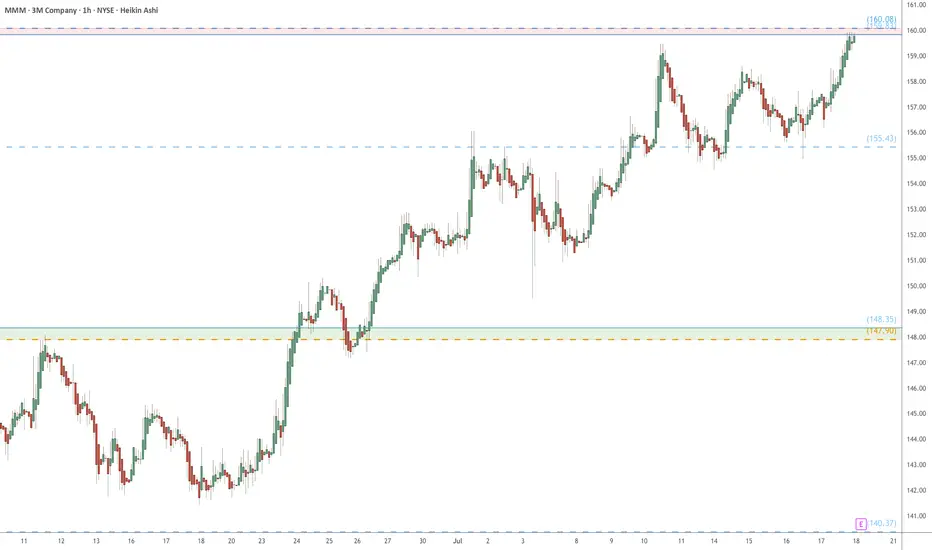
MMM eyes on $160: Resistance Zone waiting for Earnings reportMMM has been crawling off a decade long bottom.
Testing a significant resistance at $159.83-160.08
Earnings report tomorrow, so a key 24 hours here.
.
Previous analysis that caught the BREAK OUT:
Hit the BOOST and FOLLOW for more PRECISE and TIMELY charts.
========================================================
.
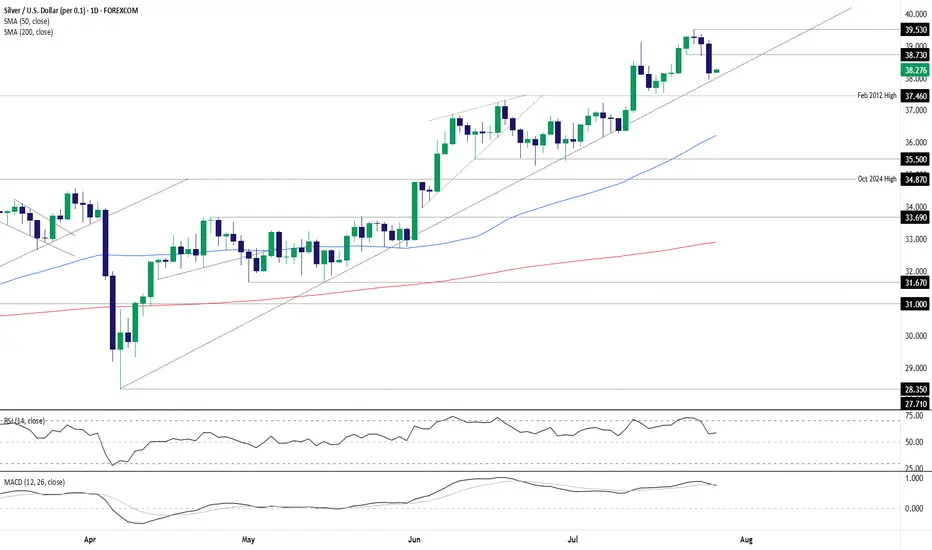
Silver dips to trendline, bulls eye bounceSilver’s latest pullback has seen it move back towards long-running uptrend support, creating a decent entry level for longs with price momentum favouring buying dips over selling rips.
Longs could be established above the trendline with a stop beneath for protection, targeting minor resistance at $38.73 initially and, if broken, the July 23 swing high of $39.53. If the latter were to be achieved, price and momentum signals at the time should dictate whether to hold for a potential test of the psychologically important $40 level.
The price has already bounced off the uptrend on numerous occasions since being established, enhancing the appeal of the setup. While RSI (14) and MACD are not screaming buy when it comes to market momentum, they’re tilted bullish rather than bearish, favouring upside.
If silver were to break and close beneath the uptrend, the bullish bias would be invalidated.
Good luck!
DS
Z eyes on $68.80-69.75: Resistance even the Fib-Blind can SEEZillow has bounced into a major landmark of its lifetime.
Zone is defined by a Golden Covid and a Minor Genesis fib.
This has been tested from both sides many times already.
$ 68.60-69.75 is the exact resistance to watch.
$ 61.82-62.50 is the first support below to hold.
$ 76.18-7./00 is a good first Target for longs.
===================================================
.

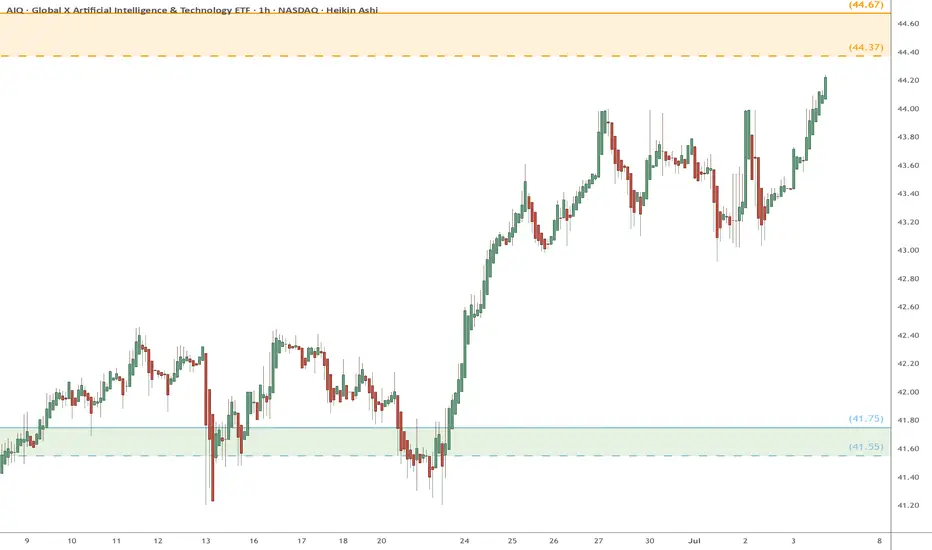
AIQ heads up at $44.37/67: Double Golden fib zone will be strongAIQ has been floating up towards a Double Golden zone.
$44.37 is a Golden Covid and $44.67 a Golden Genesis fib.
High-Gravity area is likely to hold this in orbit for some time.
.
Previous analysis that caught a PERFECT BREAK OUT:
=======================================================
.

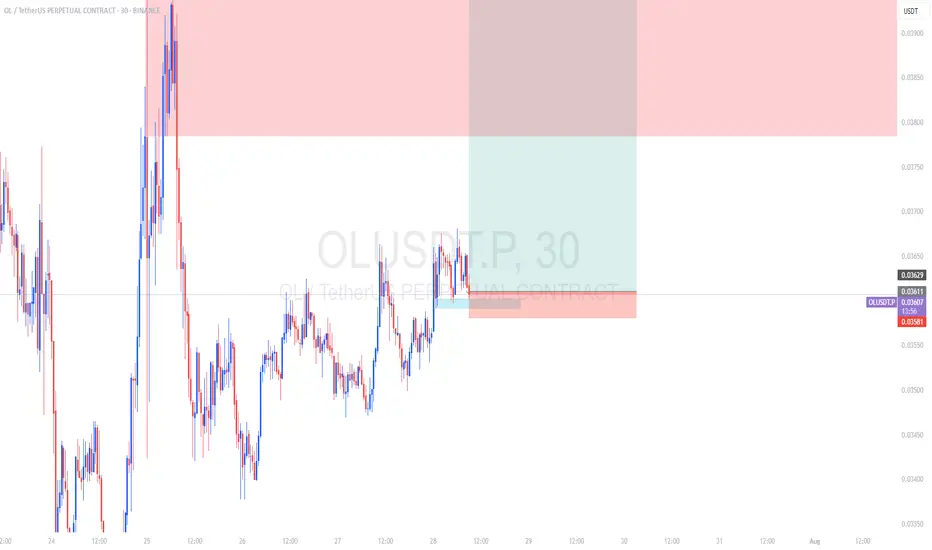
OLUSDT LONGSnR bro!
basic setup resistant become support, previously the support zone can push the price and now pull back again, so I see this as an opportyniti to long
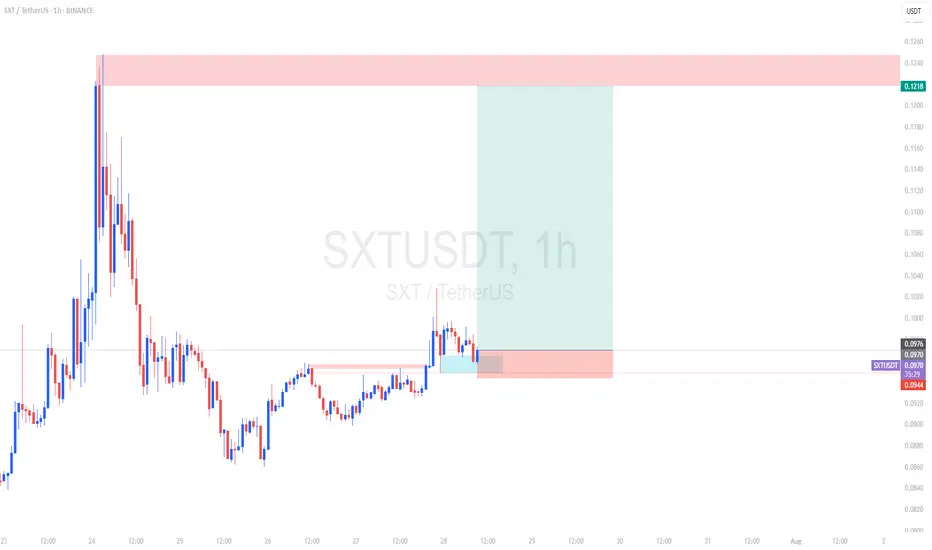
CROSSUSDT LONGSNR BRO!
price break power full Snr reverse and currently bounce up from there, I see this as an opportunity so I buy.

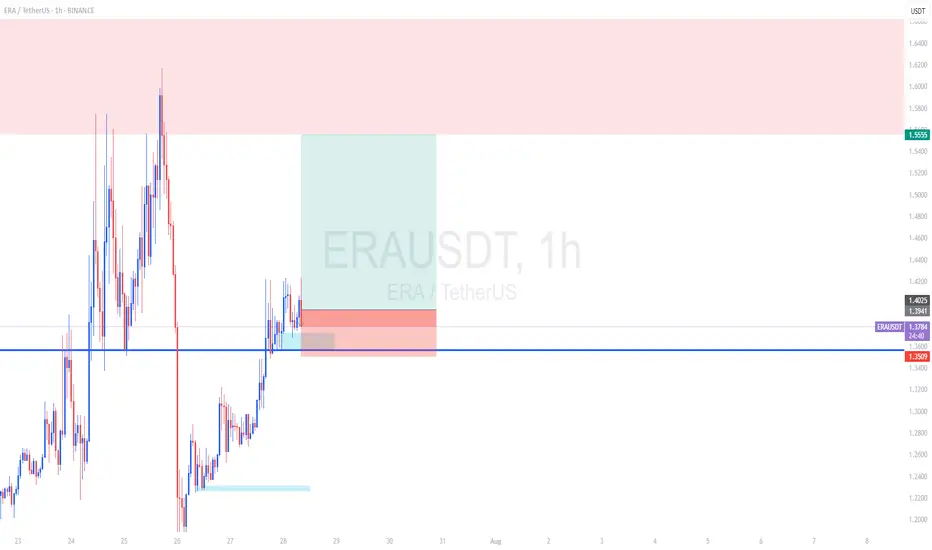
ERAUSDT LONGSNR BRO!!
a power full resistant zone 3x break and confirmed bouncing up from the zone. so I see this as long opportunity
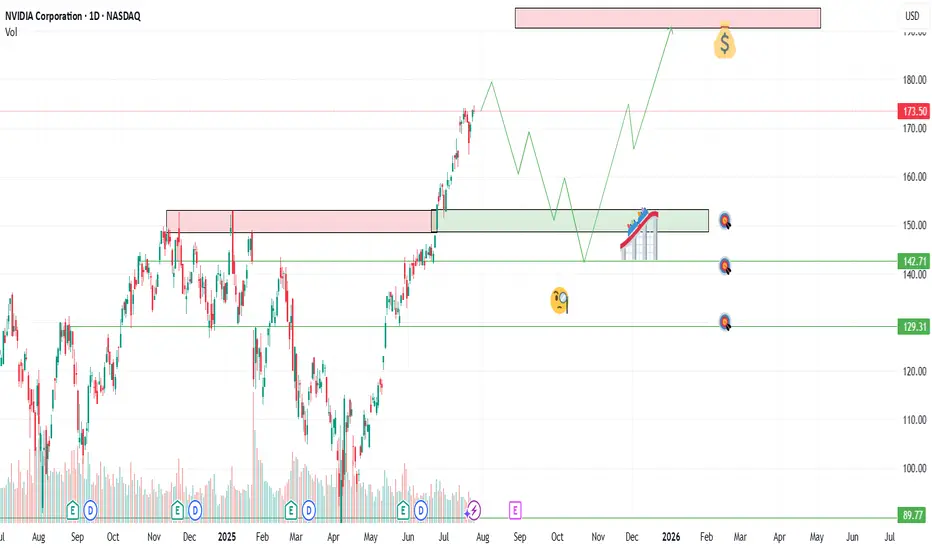
NVDA-the AI TitanNVIDIA (NVDA) continues to dominate the AI semiconductor space and remains one of the strongest momentum names in the market. After reaching new highs, price action is now offering a clean multi-tiered entry opportunity for swing traders positioning for the next leg up.
Entry Points
✅ $160 – Breakout retest zone
✅ $145 – Key technical support
✅ $130 – Strong demand zone from prior consolidation
Profit Targets
📈 TP1: $180
🚀 TP2: $190
💰 TP3: $200+
📌 Disclaimer: This is not financial advice. Just sharing my view and trade idea. Always do your own research and manage risk accordingly.
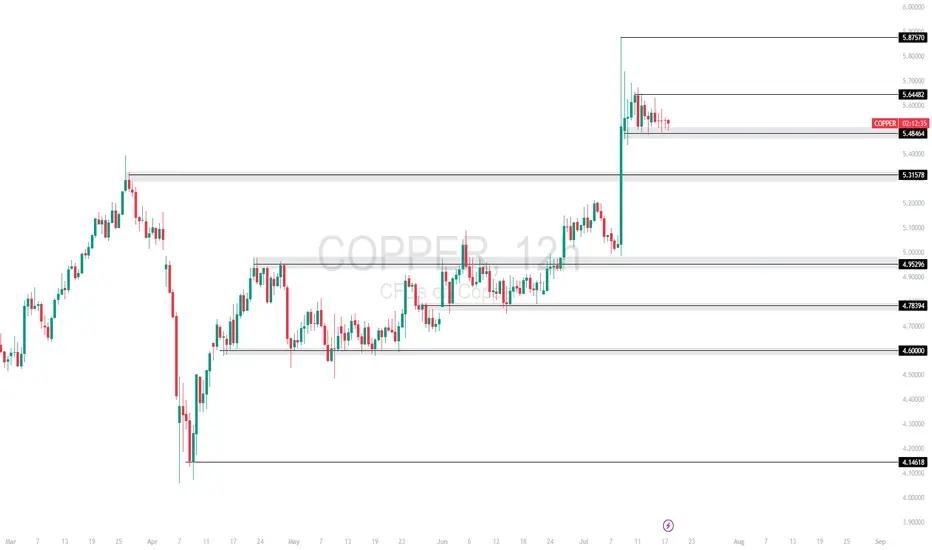
COPPER TECHNICAL ANALYSISCopper spiked into 5.8750 but is now consolidating just below short-term resistance at 5.6448, showing signs of a bullish continuation pattern. Price remains supported at the 5.4864 zone.
Currently trading at 5.4864, with
Support at: 5.4864 / 5.3157 / 4.9929 🔽
Resistance at: 5.6448 / 5.8750 🔼
🔎 Bias:
🔼 Bullish: Break above 5.6448 could push price toward 5.8750 and beyond.
🔽 Bearish: Loss of 5.4864 may trigger downside toward 5.3157.
📛 Disclaimer: This is not financial advice. Trade at your own risk.
NASDAQ (Nas 100): Buyers Are In Control. Wait For LongsWelcome back to the Weekly Forex Forecast for the week of July 28 - Aug 1st.
In this video, we will analyze the following FX market:
NASDAQ (NQ1!) NAS100
The Nasdaq rose Friday to fresh highs, following a busy week of tariff updates and earnings. The index is showing no signs of bearishness.
Wait for pullbacks to FVGs to buys.
FOMC and NFP warrant caution with new entries. Wait until the news before new entries.
Enjoy!
May profits be upon you.
Leave any questions or comments in the comment section.
I appreciate any feedback from my viewers!
Like and/or subscribe if you want more accurate analysis.
Thank you so much!
Disclaimer:
I do not provide personal investment advice and I am not a qualified licensed investment advisor.
All information found here, including any ideas, opinions, views, predictions, forecasts, commentaries, suggestions, expressed or implied herein, are for informational, entertainment or educational purposes only and should not be construed as personal investment advice. While the information provided is believed to be accurate, it may include errors or inaccuracies.
I will not and cannot be held liable for any actions you take as a result of anything you read here.
Conduct your own due diligence, or consult a licensed financial advisor or broker before making any and all investment decisions. Any investments, trades, speculations, or decisions made on the basis of any information found on this channel, expressed or implied herein, are committed at your own risk, financial or otherwise.

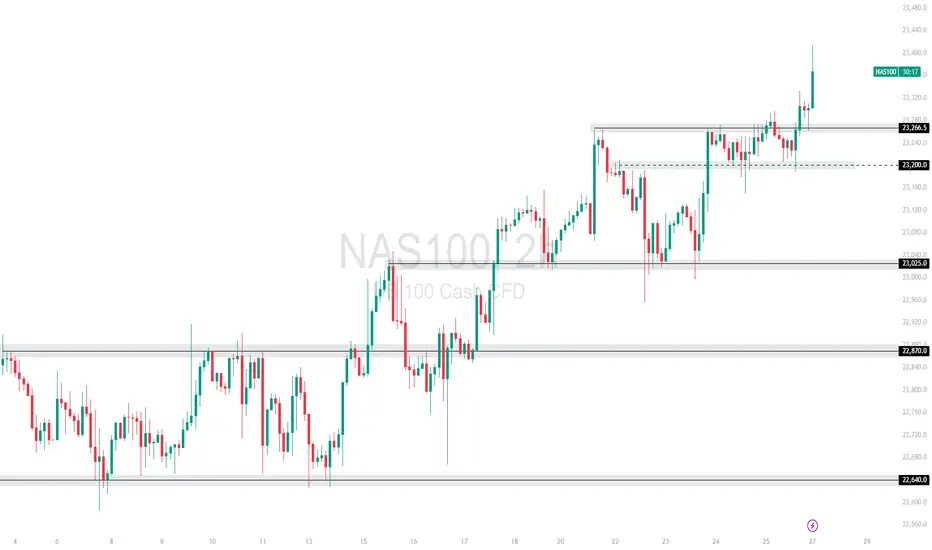
NAS100 Gaps Up on Trump Trade Deal – Bullish Continuation The market opened with a bullish gap after Trump announced new trade deals, sparking investor optimism. Price cleanly broke above the 23,266.5 🔼 resistance level, confirming it as a fresh support zone.
Buyers are now in full control, and price is forming a strong bullish structure with higher highs and higher lows.
Support at: 23,266.5 🔽, 23,200 🔽, 23,025 🔽
Bias:
🔼 Bullish: As long as price holds above 23,266.5, the path is clear for a move toward 23,400 and possibly 23,540+. Watch for minor pullbacks into support for continuation setups.
🔽 Bearish: A break back below 23,266.5 would be the first warning of bullish exhaustion, with downside potential toward 23,200.
📰 News Insight: The bullish gap came after Donald Trump announced new trade deals, boosting risk sentiment across U.S. indices. This has become a key short-term fundamental catalyst.
📛 Disclaimer: This is not financial advice. Trade at your own risk.
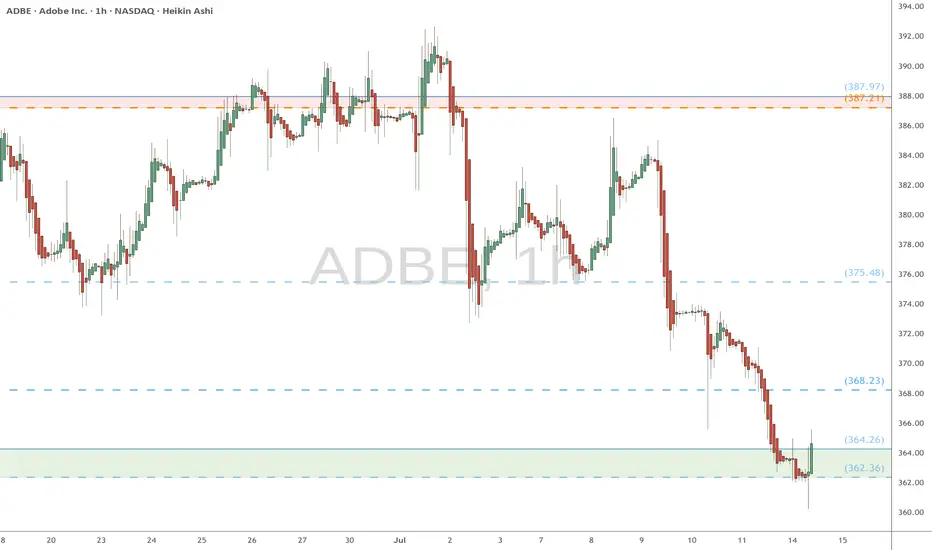
ADBE watch $362-364: Key Support zone must hold to end DownTrendADBE was struggling before last earnings and dumping since.
Currently trying to lift out of a significant support at $362-364
Looking for a Break-n-Retest of zone top Genesis fib at $324.26
.
S&P 500 (ES1): Buyers In Control Amid Tariff Deals & EarningsWelcome back to the Weekly Forex Forecast for the week of July 28 - Aug 1st.
In this video, we will analyze the following FX market:
S&P 500 (ES1!)
The S&P 500 rose Friday to fresh highs, following a busy week of tariff updates and earnings. The S&P ended the week with its fifth straight record close, its longest such streak in over a year.
No reason to consider selling. Wait for pullbacks to FVGs for high probability buys.
FOMC and NFP loom. Be careful to avoid new entries during news times.
Enjoy!
May profits be upon you.
Leave any questions or comments in the comment section.
I appreciate any feedback from my viewers!
Like and/or subscribe if you want more accurate analysis.
Thank you so much!
Disclaimer:
I do not provide personal investment advice and I am not a qualified licensed investment advisor.
All information found here, including any ideas, opinions, views, predictions, forecasts, commentaries, suggestions, expressed or implied herein, are for informational, entertainment or educational purposes only and should not be construed as personal investment advice. While the information provided is believed to be accurate, it may include errors or inaccuracies.
I will not and cannot be held liable for any actions you take as a result of anything you read here.
Conduct your own due diligence, or consult a licensed financial advisor or broker before making any and all investment decisions. Any investments, trades, speculations, or decisions made on the basis of any information found on this channel, expressed or implied herein, are committed at your own risk, financial or otherwise.

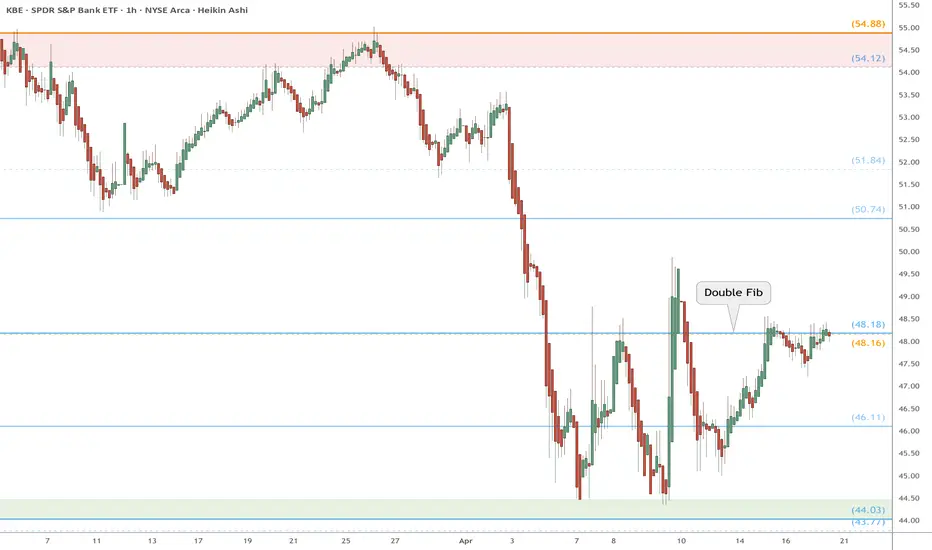
KBE watch $48.16/18: Double fib to End Bounce or Break-n-Run?KBE and financials trying to recover from tariff dump.
Currently testing a double fib zone at $48.16-48.18.
Look for Rejection or Break-n-Retest for entries soon.
APLD heads up at $13.10: Golden Genesis fib may stop the SurgeAPLD on a massive surge over various company news.
Currently about to hit a Golden Genesis fib at $8.10
Looking for usual Dip-to-Fib or Break-and-Retest to buy.
It is PROBABLE that we "orbit" this fib a few times.
It is POSSIBLE that we get a significant dip from here.
It is PLAUSIBLE that we break and run if bulls are hyper.
.
See "Related Publications" for previous EXACT plots --------------------->>>>>>>
.

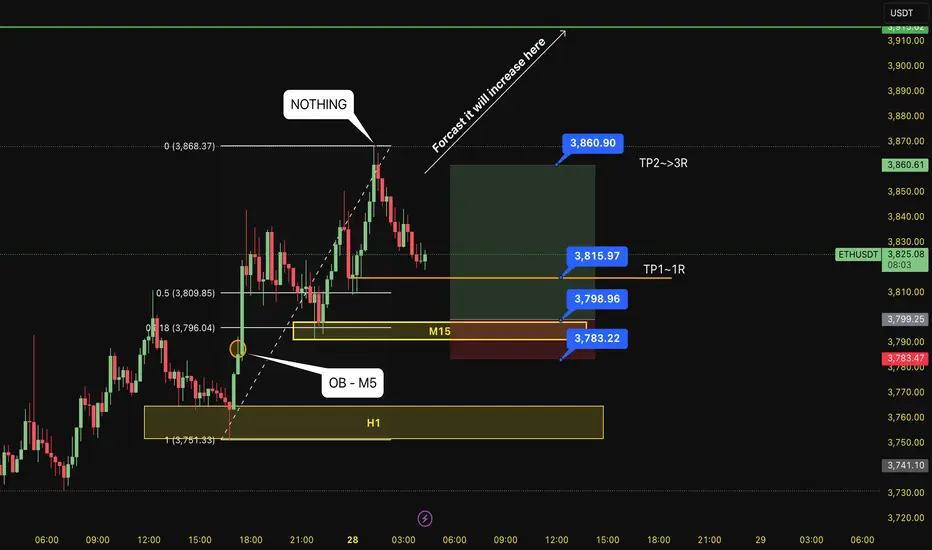
BUY ETH 28.7.2025Confluence order: BUY at M15
Type of order: Limit order
Reason:
- The current top is not touching anything, expected to rise to the H1 above.
- M15~FIBO 0,5-0,618 (same position)
Note:
- Management of money carefully at the last bottom (3,815)
Set up entry:
- Entry buy at 3,798
- SL at 3,783 (below OB NOT USED of M5)
- TP1: 3,815 (~1R)
- TP2: 3,860
Trading Method: Price action (No indicator, only trend and candles)