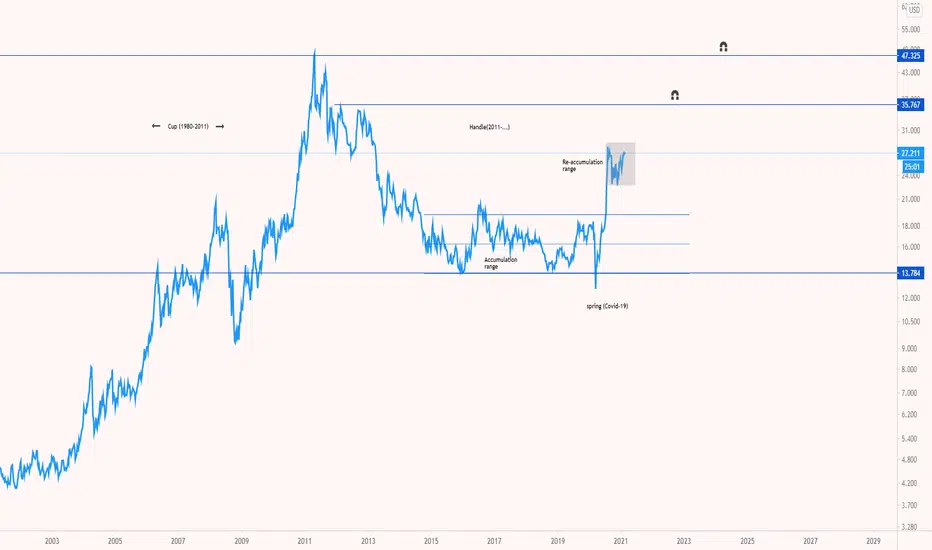
The biggest cup&handle of all times: silver targets $50The data suggests a cup&handle:
Cup was between 1980-2011
Handle is still in progress and probably may finish by 2025 or earlier.
For the short run: a re-test of low re-accumulation range of $23 can be seen.
The next mid-term target will be $25.
Final target will be $50.
Support and Resistance
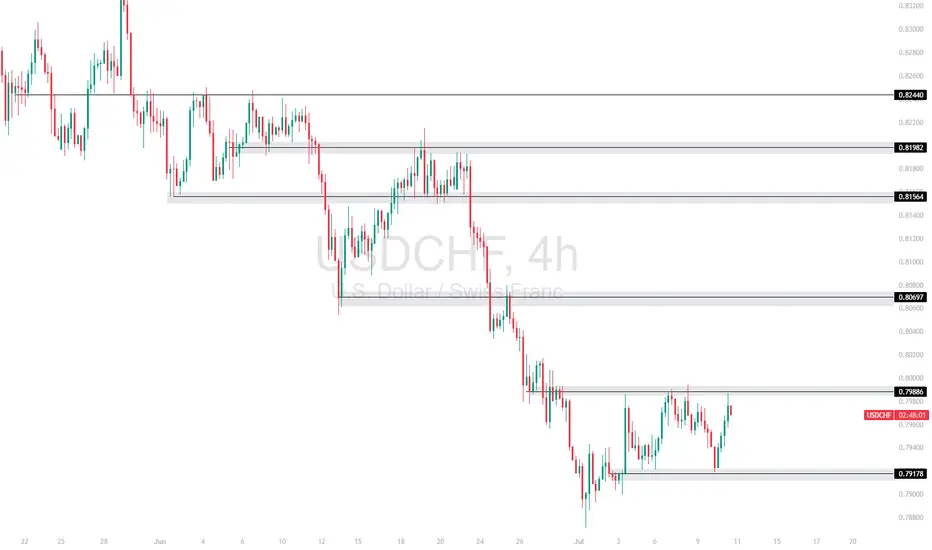
USDCHF – Key Resistance TestUSDCHF is currently ranging after a strong downtrend, now testing the 0.79886 resistance level. Price is bouncing between this resistance and support at 0.79178, showing signs of indecision.
Support at: 0.79178 🔽
Resistance at: 0.79886 🔼
🔎 Bias:
🔼 Bullish: Break and close above 0.79886 targets 0.80697 and possibly 0.81564.
🔽 Bearish: Rejection from 0.79886 and break below 0.79178 could resume the bearish trend.
📛 Disclaimer: This is not financial advice. Trade at your own risk.
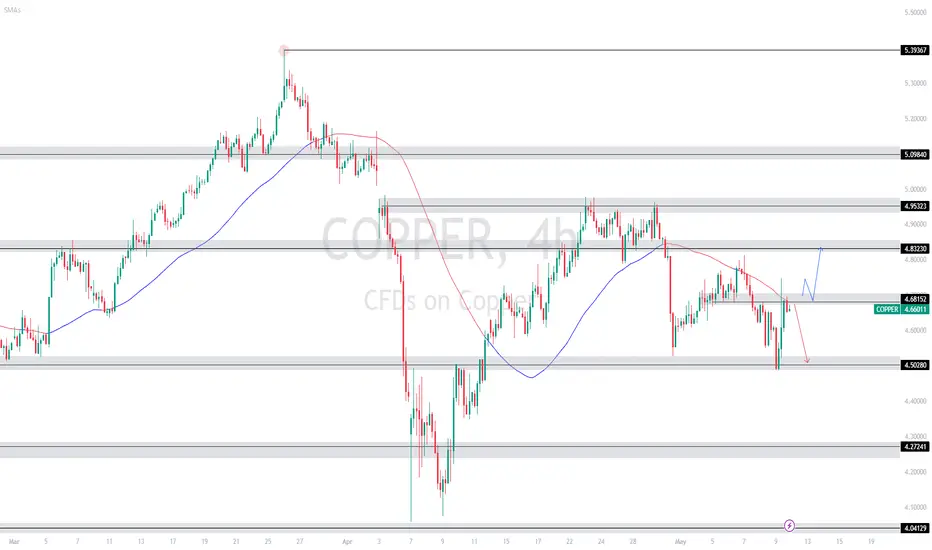
Copper Eyeing Key Reversal Point – Will It Break Above 4.68152 ?Copper is currently hovering near the 4.68152 🔼 resistance after rebounding from the 4.50280 🔽 support. Price is reacting to the 50-period SMA, which is slightly above current levels and may act as a dynamic resistance. The overall structure remains mixed with recent lower highs, but bulls have stepped in at key support.
Support at: 4.50280 🔽, 4.27241 🔽, 4.04129 🔽
Resistance at: 4.68152 🔼, 4.83230 🔼, 4.95323 🔼
Bias:
🔼 Bullish: A breakout and retest above 4.68152, and ideally a clean move above the 50 SMA, could signal bullish continuation toward 4.83230 and 4.95323.
🔽 Bearish: A strong rejection at 4.68152 or a drop below 4.50280 could send price back toward 4.27241.
📛 Disclaimer: This is not financial advice. Trade at your own risk.
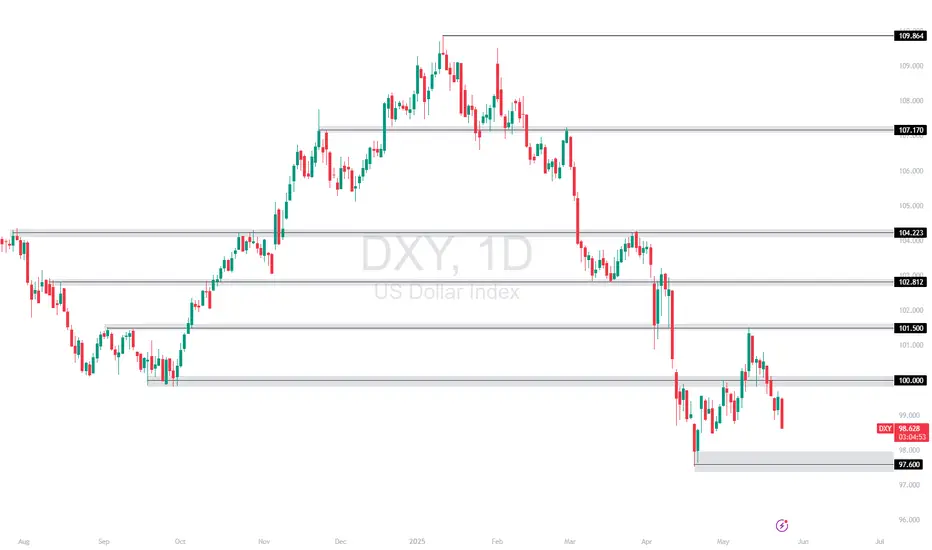
Dollar Index Dips – All Eyes on 97.600?The US Dollar Index (DXY) is currently trading just below the 100.000 🔼 resistance area, following a series of lower highs and lower lows that reflect a clear bearish trend. Price is now approaching the 97.600 🔽 level, which has previously acted as a key turning point and could influence the next directional move.
Support at: 97.600 🔽
Resistance at: 100.000 🔼, 101.500 🔼, 102.812 🔼, 104.223 🔼
🔎 Bias:
🔽 Bearish: The trend remains bearish while price stays below 100.000. A break below 97.600 may lead to further downside continuation.
🔼 Bullish: A bounce from 97.600 followed by a move back above 100.000 could open the door for a recovery toward 101.500.
📛 Disclaimer: This is not financial advice. Trade at your own risk.
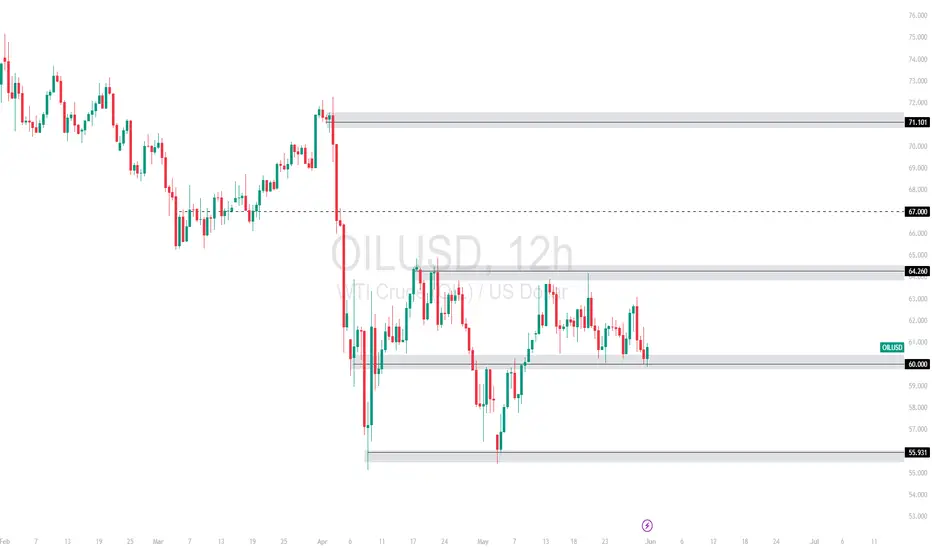
OILUSD Range Between 60–64.26 – Will Support Hold or Break?WTI Crude has been in a sideways range after the sharp drop in early April. Price recently tested resistance at 64.260 but failed to break higher, pulling back into the 60.000 support zone. This level has held multiple times, forming a key pivot.
Support at: 60.000 🔽, 55.931 🔽
Resistance at: 64.260 🔼, 67.000 🔼, 71.101 🔼
🔎 Bias:
🔼 Bullish: A strong rejection from the 60.000 zone followed by a breakout above 64.260.
🔽 Bearish: A daily/12H close below 60.000 opens the path to retest 55.931, and potentially lower.
📛 Disclaimer: This is not financial advice. Trade at your own risk.
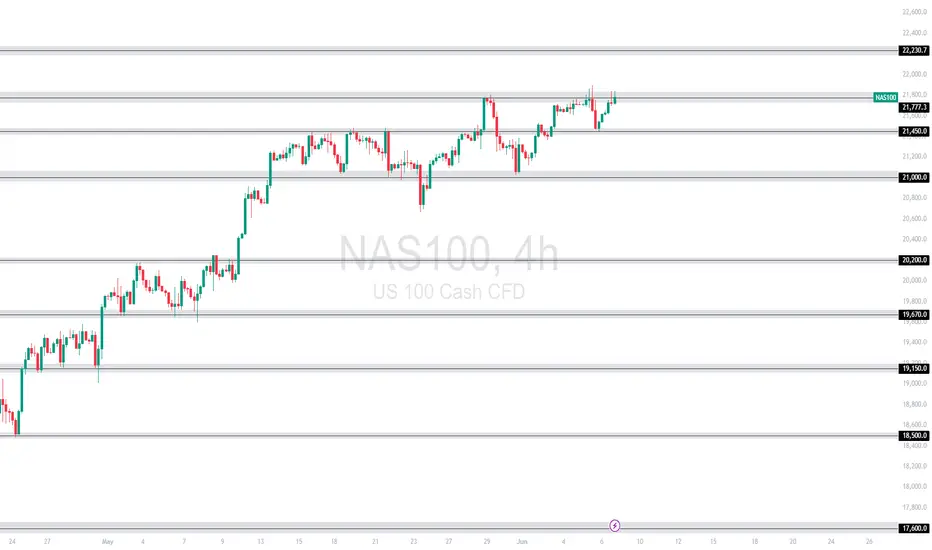
NAS100 [Consolidating ] – Will It Break Higher or Pull Back?The NAS100 has maintained a bullish structure and is currently pressing against the resistance zone around 21,777.3. This area has acted as a ceiling several times in recent sessions. Price is showing consolidation just below resistance, suggesting either an imminent breakout or another rejection.
Currently trading at 21,777.3, with
Support at: 21,450.0 🔽
Resistance at: 22,230.7 🔼
🔎 Bias:
🔼 Bullish: A strong break and hold above 21,777.3 may drive price toward the next resistance at 22,230.7.
🔽 Bearish: Rejection from 21,777.3 could lead to a retracement toward 21,450.0, with deeper downside potential if that level fails.
📛 Disclaimer: This is not financial advice. Trade at your own risk.
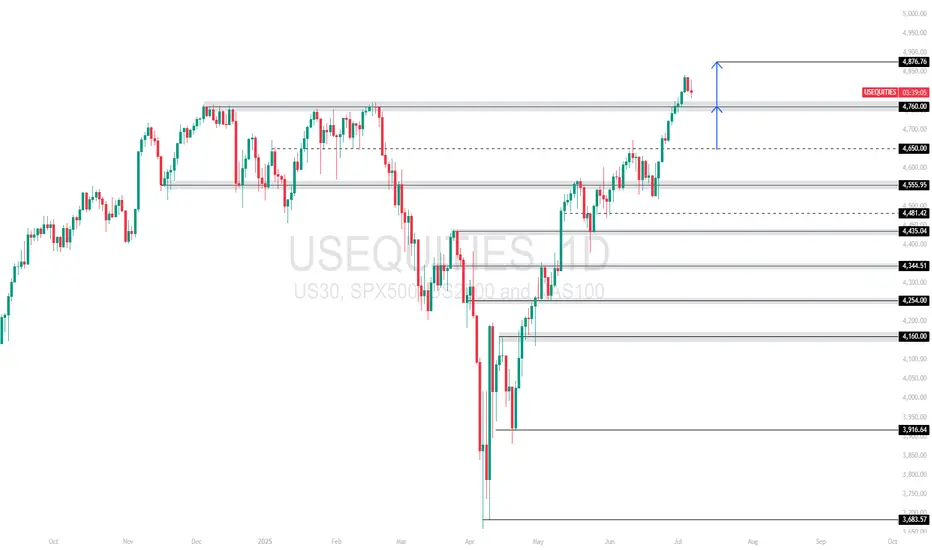
US Equities Index – Retesting Breakout Zone After Strong RallyUS Equities Index recently broke through the 4,760.00 resistance zone with strength, but price is now pulling back slightly, possibly retesting this level as new support. The projected upside targets the 4,876.76 zone, which remains the next key resistance.
Support at: 4,760.00 🔽 | 4,650.00 🔽
Resistance at: 4,876.76 🔼
🔎 Bias:
🔼 Bullish: Holding above 4,760.00 confirms breakout structure with potential continuation toward 4,876.76.
🔽 Bearish: A breakdown back below 4,760.00 could shift bias short-term toward 4,650.00 and 4,555.95.
📛 Disclaimer: This is not financial advice. Trade at your own risk.
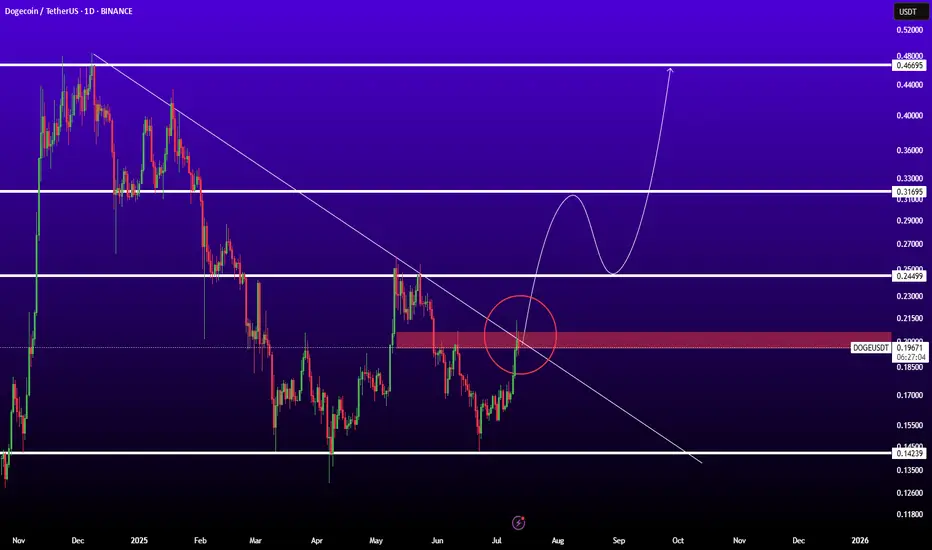
DOGEUSDTBINANCE:DOGEUSDT is in good level for pump because if breaked trendline and resistance 0.200$ ready for sharp movement to next levels.
Resistances: 0.25 - 0.32 - 0.45
Support: 0.15
USDJPY Breakout and Potential RetraceHey Traders, in today's trading session we are monitoring USDJPY for a buying opportunity around 146.300 zone, USDJPY was trading in a downtrend and successfully managed to break it out. Currently is in a correction phase in which it is approaching the retrace area at 146.300 support and resistance area.
Trade safe, Joe.

Long trade tradingview.sweetlogin.com
🟢 Buyside Trade
Pair: LINKUSD
Date: Saturday, 5th July 2025
Time: 8:00 PM
Session: Tokyo Session PM
Time Frame: 4Hr TF Entry
🔢 Trade Metrics
Entry Price: 13.161
Take Profit (TP): 25.814 (+96.14%)
Stop Loss (SL): 12.984 (−1.34%)
Risk-Reward Ratio: 70.32: 1
📈 Chart Analysis
Structure: Price broke the previous consolidation zone and retested key support levels near the 13.16 area before launching upward.
Indicators:
200 WMA (Yellow) & 50 EMA (Blue) both support continuation.
Break of market structure confirmed prior resistance as new support.

NAS100 Supply and Demand Case StudyIt was a classic bullish week. If you have any questions lmk in the comments.

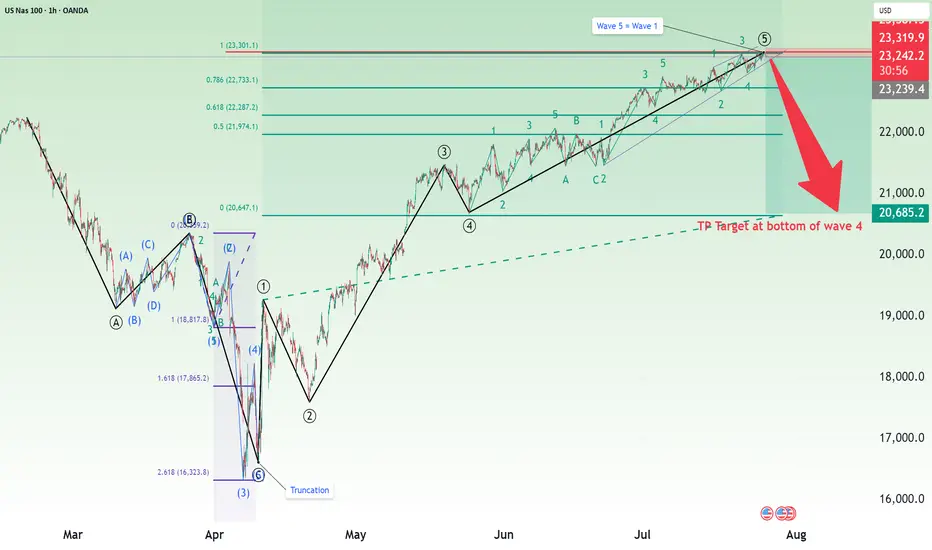
Nasdaq Short: Completion of 5 waves with wave 5=wave 1Over here, I present a short case for Nasdaq (and S&P500 by default since their correlations are high). The main reasons are:
1. Completion of 5 waves structure both on the high degree and on low degree, as shown in the chart.
2. Fibonacci measurement where wave 1 = wave 5.
The stop of this idea is to be placed slightly above the high, in this case, I placed it at around 23320. The take profit target is at the bottom of primary wave 4, around 20685.
Take note that this is a positional short, meaning the strategy is to short and hold and periodically adjust your stop loss based on unfolding on wave structure. Sizing is based on your risk tolerance.
Good luck!
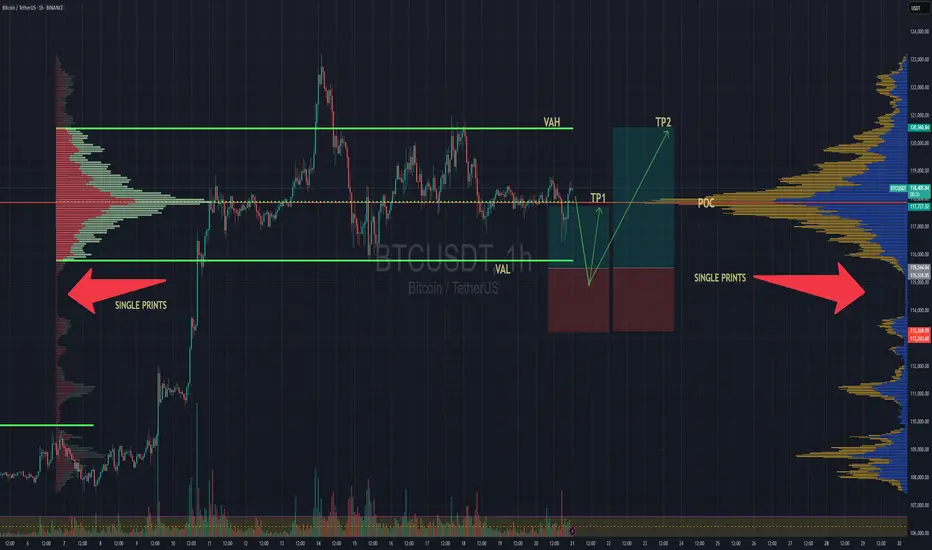
BTC Balanced Volume Profile BTC is now trading in a textbook D-Shape Volume Profile. In english - Buyers & Sellers are happy to transact here and will stay inside the value area & consolidating sideways until further notice.
Consolidation at POC is a signature of this profile, and one of the easiest and least stressful trade setups because now, your mission, should you chose to accept. Is to fade the Highs (VAH) and Lows (VAL) and avoid the middle unless you love donating money to the market.
I'll have buy limit orders waiting right below the VAL where we have the single prints. It doesn't get any easier than this.
Doesn't mean price cant rip through, but this is always the best entry with less risk, especially when the single prints have not been tested yet..
BINANCE:BTCUSD CME:MBT1!
ENA Analysis (3D)ENA has been outperforming many altcoins for weeks, yet it still appears undervalued based on its fundamentals and recent investor interest.
Where to buy?
Right now, buying at current levels is extremely risky, as the ideal buy-back zones are significantly below the market price.
First major support: $0.48 — considered a "cheap" entry.
Dream entry (low probability): $0.37–$0.38 — at that point, ENA would feel almost free.
Notably, BlackRock and its partners are actively investing in ENA, which speaks volumes about its long-term credibility. That alone justifies keeping it on your radar.
Minimum target: $1.00–$1.20
Remember, that’s just the beginning. We may see even more once momentum kicks in.
Sometimes, the best trade is the one you're waiting for.
Good luck.

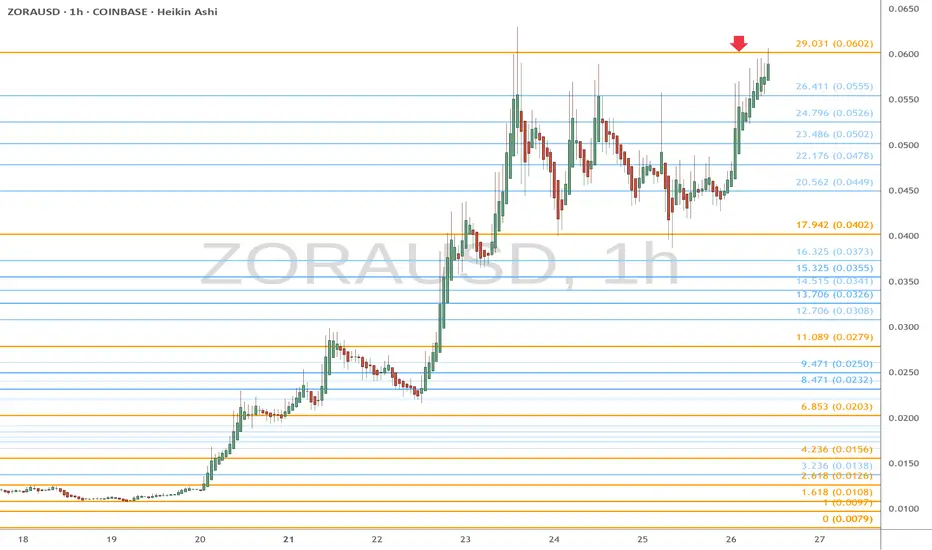
ZORA.usd eyes on 6 cents: Golden Genesis fib a TOP or RELOAD? ZORA has been flying since Coinbase integration.
Currently range bound by Goldens at 4 and 6 cents.
Look for a Rejection-Short or Break-n-Retest for longs.
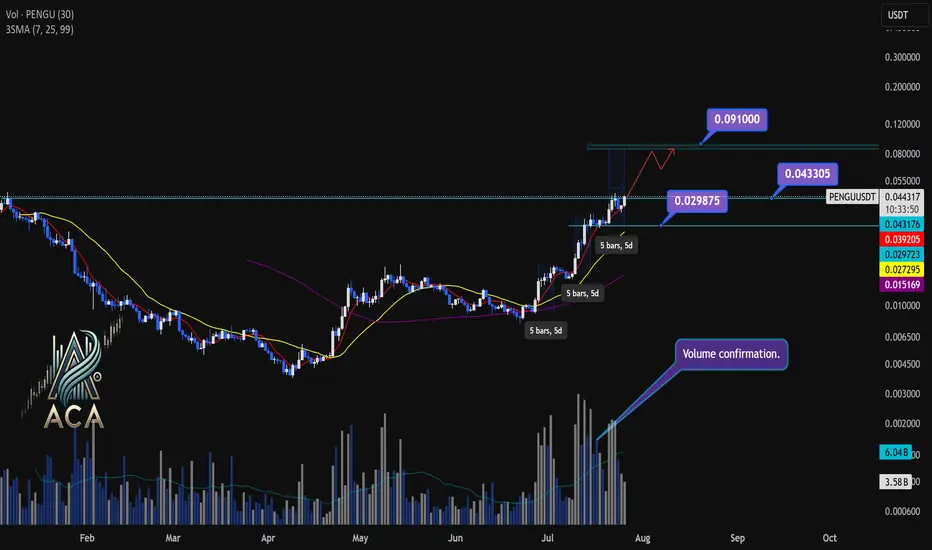
PENGUUSDT Daily Chart Analysis | Powerful Uptrend in PlayPENGUUSDT Daily Chart Analysis | Powerful Uptrend in Play
🔍 Let’s dissect the current PENGU/USDT daily chart, highlighting the unmistakable bullish structure and mapping potential targets as this trend matures.
⏳ Daily Overview
PENGUUSDT is riding a strong upward trend, with all three daily SMAs (7, 25, and 99) lined up in bullish sequence—clear confirmation of momentum. Recent rallies are also supported by textbook volume behavior: volume consistently surges during price climbs and tapers off during minor corrections, reflecting the classic signature of a robust uptrend.
🔺 Bullish Setup and Price Targets:
The next major upside target sits at $0.0910, almost 85% above the current level. For bulls, a daily candle closing above $0.043305 with convincing volume should act as a confirmation for fresh highs—though, as it’s Saturday, even moderate volume could suffice for a valid breakout.
📊 Key Highlights:
- All SMAs (7, 25, 99) confirming the uptrend on daily timeframe.
- Volume spikes on upward moves, fades on corrections—classic bullish confirmation.
- Historical trend velocity: Each time a new high (HH) is set, it’s preceded by around 5 days of advance; first leg was +83%, second +124%, the next (projected) is +160%, aligning with the $0.0910 target.
- Corrections: After each rally, pullbacks have measured about 15% and 20%. Should the first target be reached, expect a correction up to 25%—a healthy reset for further continuation.
🚨 Conclusion:
With all signals aligned—moving averages, volume dynamics, and historic price structure—the path remains bullish. A decisive close above $0.043305, especially with solid volume, could be the catalyst for the next major leg higher. As always, monitor for typical correction ranges post-breakout in line with the prior trend.
ETH Soars $2.6B: Inside BBDelta and Cathie Wood’s Strategic BetIn July 2025, the Ethereum network witnessed an unexpected wave of withdrawals totaling over $2.6 billion in unstaked ETH — one of the largest single-month movements since Ethereum’s transition to proof-of-stake. While headlines suggested panic, BBDelta’s analysts and Ark Invest CEO Cathie Wood see a different narrative unfolding: one rooted in strategic portfolio rebalancing and maturing market behavior.
Beyond the Headlines: What the Data Really Shows
According to BBDelta’s internal chain analysis, over 842,000 ETH were unstaked across major validator pools including Lido, Rocket Pool, and Coinbase. However, contrary to expectations, there was no mass sell-off. In fact, more than 65% of unstaked ETH remained idle or were redirected to DeFi platforms such as Aave and Curve.
This distinction is crucial. “Unstaking doesn’t necessarily equal selling,” explains Anna Keller, Senior Market Strategist at BBDelta. “It reflects evolving investor preferences, where capital seeks higher yield or greater liquidity in anticipation of macroeconomic shifts.”
Cathie Wood concurs, stating in a Bloomberg interview, “Ethereum’s staking environment is beginning to resemble fixed-income markets. Institutional holders are unstaking not out of fear, but in search of more dynamic return models.”
Institutional Movements Driving the Shift
One of the primary drivers behind the recent wave appears to be institutional rebalancing. As yields on real-world assets (RWAs) and tokenized Treasury instruments improve, large crypto holders — including family offices and asset managers — are rotating exposure from static ETH staking to diversified yield strategies.
BBDelta’s research notes a spike in ETH deployment into liquid staking derivatives (LSDs) and restaking protocols like EigenLayer, signaling a pivot toward composable and flexible income mechanisms.
Moreover, geopolitical uncertainty and rate policy ambiguity continue to drive caution. “The macro backdrop — especially ongoing tensions around U.S. debt restructuring and eurozone contraction — is pushing capital toward adaptable on-chain positions,” Keller adds.
Cathie Wood’s Perspective: Strategy, Not Stress
Cathie Wood, whose firm Ark Invest holds significant ETH positions, argues the current trend mirrors broader crypto-market maturity. “Volatility remains, but the investor base is smarter,” she says. “What we’re seeing with this $2.6 billion movement is the normalization of active asset allocation in crypto.”
She draws parallels to traditional finance, where fixed-income investors routinely rotate holdings between instruments based on risk and duration. “Ethereum has reached a point where it can sustain a yield curve of its own — that's a sign of strength, not weakness.”
BBDelta’s Market Outlook
BBDelta expects a continued reshaping of Ethereum’s staking landscape, with less concentration in passive lockups and more emphasis on modular strategies. The firm predicts ETH will increasingly serve as a base asset in complex, multi-layered DeFi ecosystems — from restaking protocols to derivatives and real-world asset bridges.
In the near term, BBDelta projects moderate price consolidation around the $3,400–$3,800 range, driven by macro correlations with tech stocks and bond yields. However, the firm remains long-term bullish, citing Ethereum’s dominant position in smart contract execution, enterprise adoption, and regulatory clarity across the EU and Asia-Pacific.
Final Thoughts
The $2.6 billion Ethereum unstaking should not be misinterpreted as a crisis. Rather, as BBDelta and Cathie Wood both emphasize, it represents a milestone in Ethereum’s financial evolution. Sophisticated capital is optimizing exposure, not fleeing risk — and in that, the Ethereum ecosystem proves its readiness for the next institutional wave.

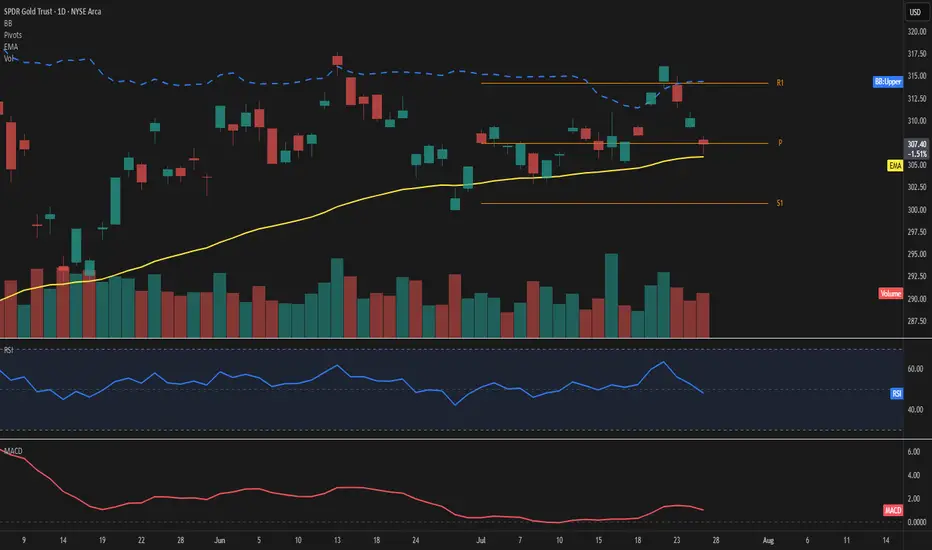
GLD – Price consolidates at highsPrice is hovering just above the 50-day EMA at 307, showing signs of short-term hesitation near the Fibonacci pivot. The upper Bollinger Band sits at 314, leaving moderate room for expansion if momentum picks up.
The RSI reads 48, reflecting a balanced setup without clear directional bias. MACD remains slightly positive, suggesting a still-constructive but soft momentum.
Key levels to watch include the pivot at 307 and the support at 301. On the upside, the 314 area aligns with both R1 and the upper band, acting as the next challenge.
Volume is up sharply (+22%) despite a mild -0.9% price pullback, indicating possible accumulation beneath the surface.
As long as price holds above the 50-day EMA, the structure remains intact.
A move away from the pivot zone will likely define the next directional wave.
SharpLink Eyes 1M ETH Goal After $145M Deal as ETH Targets $4KIn a move that’s set to reshape the intersection of digital assets and sports betting, SharpLink Gaming Ltd. has announced a landmark $145 million acquisition of a global data and analytics firm, with the explicit goal of accumulating 1 million ETH over the next 24 months. The deal underscores growing institutional interest in Ethereum as a digital commodity, and may catalyze upward momentum as ETH inches toward the $4,000 psychological resistance level.
SharpLink, a technology company specializing in real-time conversion tools for online betting platforms, sees Ethereum not only as an asset but as a strategic reserve and infrastructure layer for future blockchain-native products in sports engagement.
ETH as a Strategic Reserve Asset
According to sources close to the deal, the target firm will integrate its decentralized transaction engine directly onto Ethereum Layer 2, allowing near-instant settlement for in-app microtransactions and loyalty systems. SharpLink executives confirmed that part of the transaction includes an ETH-based performance clause, further tying company equity to the appreciation of Ethereum itself.
“Ethereum is not just a vehicle for holding value—it’s a programmable platform that enables the gamification of loyalty, rewards, and even prediction markets,” said Robert Wheeler, CFO at SharpLink. “Our 1 million ETH target is a long-term bet on infrastructure, not speculation.”
Institutional Flows Signal Confidence
The acquisition comes amid surging Ethereum ETF inflows, with U.S.-based funds seeing over $453 million in net capital in July alone. As institutional allocations deepen, Ethereum’s price has responded, currently trading at around $3,730, up nearly 18% month-over-month.
Analysts believe that a clean break above $4,000 could lead to an accelerated rally toward new cycle highs, especially with the anticipated rollout of EIP-7623, a scaling-focused upgrade designed to enhance Layer 2 throughput.
Industry Implications
SharpLink’s strategy mirrors a broader trend where companies are building Ethereum exposure directly into corporate structure, treating ETH as both capital and infrastructure. This hybrid approach reflects a shift from speculative crypto adoption to utility-based asset management.
“It’s a new model of treasury allocation,” noted Mia Langston, digital finance strategist at Veridian Global. “They’re not just holding ETH as a hedge—they’re deploying it across services.”
Conclusion
With Ethereum’s fundamentals strengthening, growing ETF demand, and now a $145M acquisition tied directly to ETH accumulation, SharpLink’s move may serve as a case study in the next phase of corporate crypto strategy.
If ETH breaches $4,000 in the coming weeks, the company’s early positioning could prove prescient—and possibly spark similar strategic moves across sectors beyond crypto.

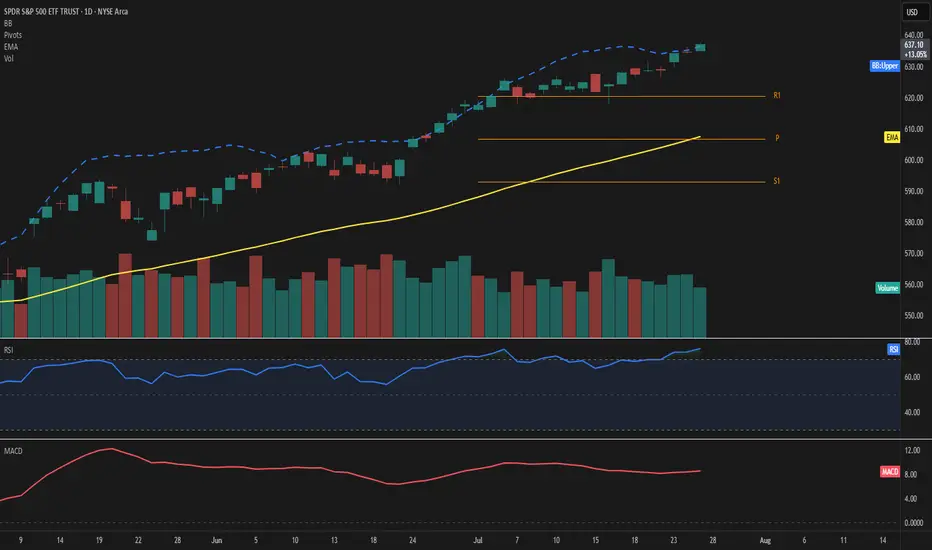
SPY – Explosive strength above resistancePrice extends well above the 50-day EMA and pierces through the upper Bollinger Band, highlighting strong bullish momentum. RSI stands at 76, confirming overbought conditions, while MACD remains firmly positive.
The ongoing move leaves the EMA50 at 608 and the Fibonacci pivot at 607—both now acting as key support levels. With R1 at 620 already surpassed, the next potential resistance zone lies in uncharted territory beyond 636.
Volume has decreased by over 20%, which tempers the move slightly and should be monitored closely.
As long as price holds above 620, the bullish scenario remains valid.
Watch for any sudden spike in volume or a drop back below 636 as a possible shift signal.
Top 5 Cryptocurrencies This Month: July 2025 Leading PerformersBy Forbes Contributor
Despite ongoing regulatory turbulence and macroeconomic uncertainty, July 2025 has proven to be a month of notable gains across the cryptocurrency market. A mix of established leaders and rising altcoins have outperformed expectations, driven by ecosystem developments, market sentiment, and broader digital asset adoption. Based on performance metrics, trading volumes, and real-world developments, here are the top five crypto gainers of the month.
1. Toncoin (TON)
+67% (Month-to-Date)
Toncoin surged on the back of growing Telegram ecosystem integrations. With more mini-apps and wallets going live on the platform, TON is rapidly becoming a medium of exchange for users worldwide. Its alignment with a major messaging platform provides Toncoin with unique network effects that most cryptocurrencies can’t match.
Key driver: Telegram’s global user base crossing 1 billion, bringing TON into daily utility.
2. Render (RNDR)
+58%
The rise of AI and decentralized GPU rendering continues to benefit the Render Network. RNDR gained momentum as AI developers increasingly rely on decentralized GPU resources to train and deploy models, particularly in gaming and VR applications.
Key driver: Strategic partnerships with gaming studios and AI startups boosted investor confidence.
3. Ethereum (ETH)
+31%
Ethereum gained steadily following the approval of several ETH-based financial products in Europe and Asia. Additionally, increased staking activity and rollup adoption contributed to its bullish trajectory.
Key driver: Layer-2 activity and continued optimism surrounding Ethereum 2.0 upgrades.
4. Arbitrum (ARB)
+26%
Arbitrum benefited from significant ecosystem growth and DAO-funded initiatives. The implementation of new governance features and distribution of developer grants have brought more attention to the rollup-based network.
Key driver: Grant program rollout and cross-chain bridges attracting liquidity from competitors.
5. Worldcoin (WLD)
+24%
Despite controversy, Worldcoin’s biometric authentication project saw renewed adoption in emerging markets. With discussions around digital ID becoming central to Web3 identity, WLD attracted attention from institutional analysts.
Key driver: Integration into digital ID pilots in Latin America and Southeast Asia.
Final Thought
July's winners reflect a broader shift in investor preference: towards utility-driven, scalable projects. As we enter August, investors should monitor upcoming protocol upgrades, regulatory developments, and macroeconomic shifts — all of which could impact the next wave of top performers.

XAUUSD Weekly July 2025 28 July - 1 Aug🧭 MARKET STRUCTURE OVERVIEW – H4
1. Major Trend: Bullish
The overall trend remains bullish, with multiple Bullish Breaks of Structure (BOS) recorded during the upward move since early July.
A strong CHoCH followed by a solid Bullish BOS on H4 after the early July breakout confirms strong buyer intent.
---
2. Bearish BOS?
You're absolutely right — there are no significant Bearish BOS on H4 after the recent rally.
The current downward movement appears to be a retracement, not a structural break. No confirmation of bearish market structure yet.
---
🔵 CURRENT ZONE: H4 OB BUY (Active POI)
Price is currently rejecting from the H4 OB BUY zone, which aligns with the ascending trendline confluence.
If the H4 candle closes with a strong rejection (e.g. bullish engulfing or pinbar), this would confirm a potential buy entry for the next bullish leg.
This OB BUY is the main POI for next week and represents a:
✅ Buy from Discount
✅ Entry in Uptrend Structure
✅ Confluence of OB + POI + Momentum
---
🟥 FVG & TP Structure
1. TP1 / Scaling Zone:
H4 Fair Value Gap (FVG) around 3368–3380 can serve as the first target.
2. Final TP / ATH Zone:
Upper FVG (3420+) near a previous POI could act as the final target or a potential ATH test zone if buyers push higher.
---
🚀 TRADING PLAN – NEXT WEEK (Still Valid)
✅ Structure is still bullish
✅ Current drop is a retracement to OB BUY
✅ No valid Bearish BOS detected
✅ Current POI + OB BUY zone = prime entry level
---
📌 ENTRY STRATEGY
Entry: Buy within the OB BUY H4 zone (around 3320–3340)
Confirmation: Wait for a strong H4 rejection candle
Stop Loss: Below OB H4 (~3310, or adjust to lower OB zone)
TP1: 3368–3380 (FVG zone)
TP2: 3420+ (Upper FVG / POI / ATH zone)
---
⚠️ Additional Notes
If price breaks below OB BUY H4 with a strong bearish candle, this setup becomes invalid.
Then, we shift focus to lower OB zones (3280 / 3250).
Be cautious of high-impact news (FOMC/NFP?) – price may spike before confirming direction.
---
🔥 FINAL VERDICT:
✅ Plan is highly valid
❌ No strong bearish structure in place
🔒 Current POI is a key sniper entry zone

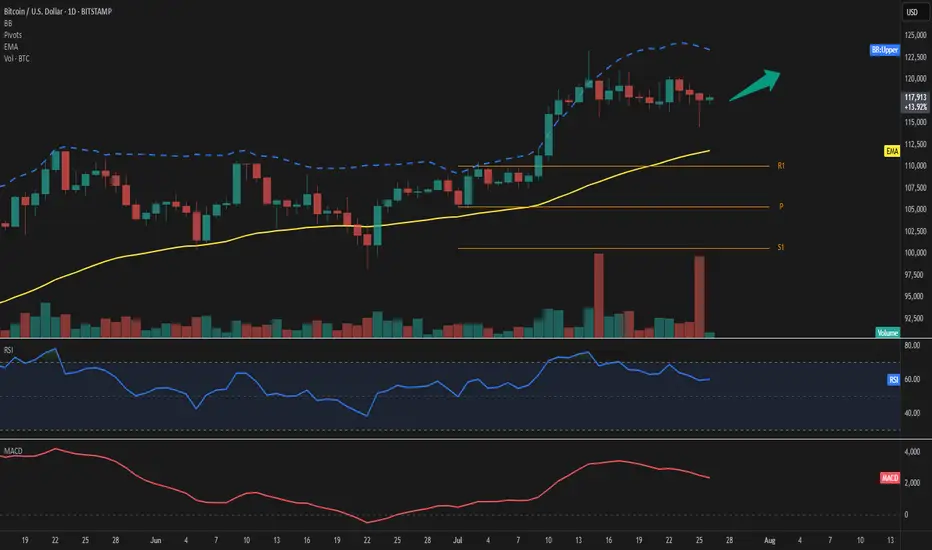
BTC – Bulls still in controlBTC is trading around 117,800 USD, well above both the EMA 50 (111,800) and the pivot level (105,300), confirming bullish dominance. Price remains below the upper Bollinger Band (123,400), leaving potential room for continuation.
Momentum stays constructive, with RSI at 60 and MACD in a strong positive zone, reflecting sustained upward pressure. As long as price holds above EMA 50 and pivot, the next upside targets lie at 123,400 and R1 at 110,000 has already been surpassed.
Volume has dropped significantly (-31%), suggesting the latest move could lack conviction or represent a pause rather than a breakout.
As long as BTC holds above 111,800, the bullish scenario remains intact.
Watch for any rejection near 123,400 or a close back below the EMA as potential invalidation signals.