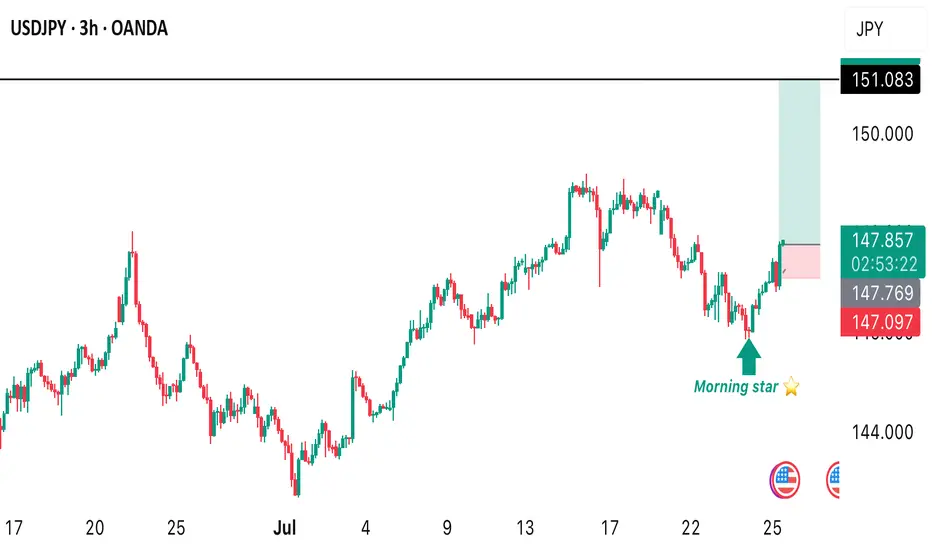
USDJPY BUY OPPORTUNITY Price provides us with a buy opportunity from the current market price as we see a continuous rise in buy momentum . We’re looking at seeing this momentum reach a high of 151.083 a buy opportunity is envisaged from the current price.
Support and Resistance
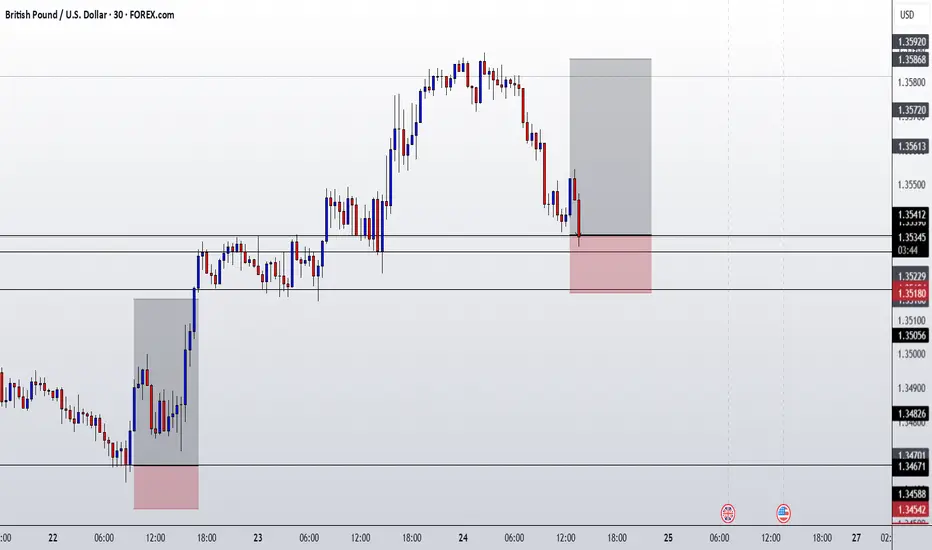
GBPUSD ENTRY CHARTOn this Pair, We are bullish, as the Dollar is still weak and the POUNDS DOLLAR is still in an UPTREND, on the HTF and the MID-TERM-TF, also on the Hourly, we got a Zone with additional confluences that are in align with the Trend, then on our Entry TF, We got a Sweep of LIQ, BOS and IND close to our POI, so we are IN, and if this matches with your TRADE IDEA, i advise you add a good risk management to manage your Trade, THANK YOU.
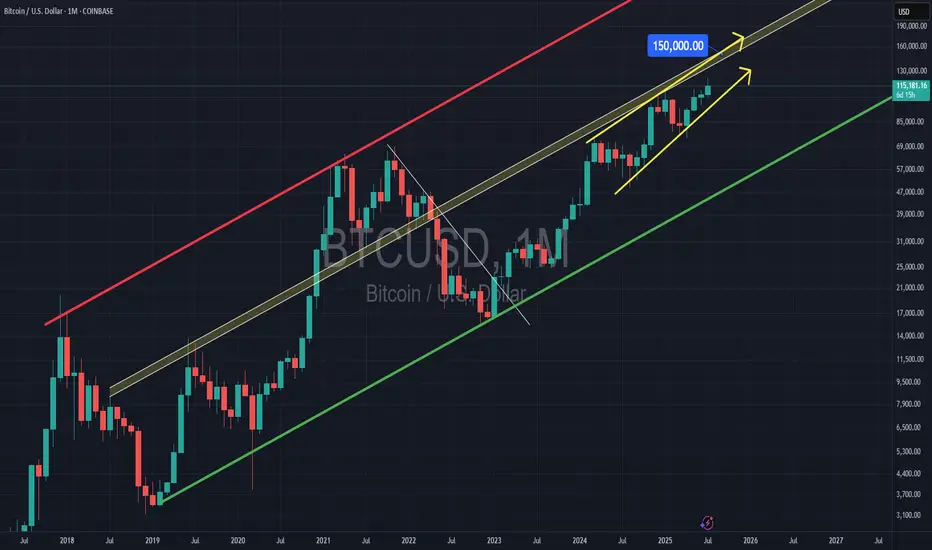
Bitcoin & 150k TOPBitcoin has been trading within a rising channel for a long time, with resistance at $150,000. The middle support/resistance line also indicates $150,000, suggesting a potential significant rejection at this level.
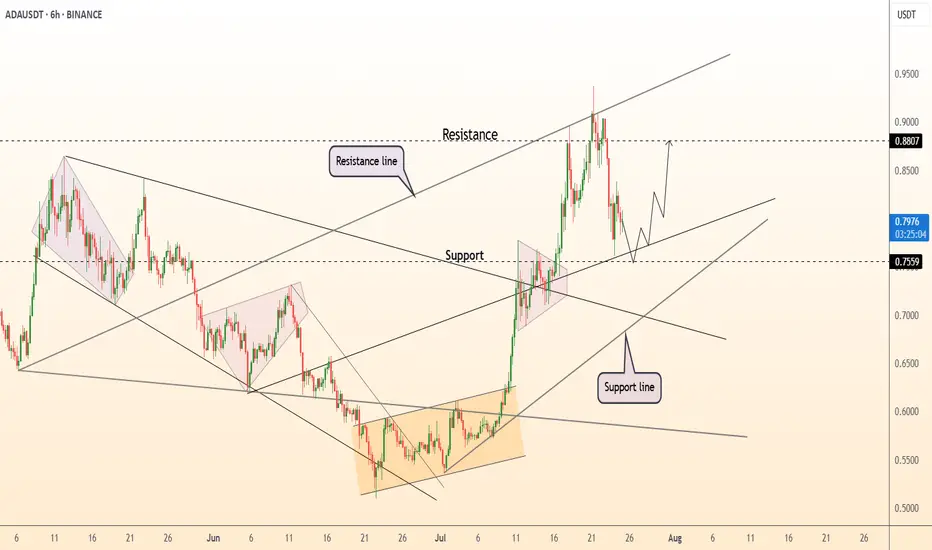
DeGRAM | ADAUSD holding above the support level📊 Technical Analysis
● Mid-July breakout from the 10-week falling wedge cleared the long-term resistance line; price retested that line & the 0.756 support band (prior range high) and printed a higher-low on the rising channel’s lower rail.
● The new up-sloper guides bulls toward the channel crest / horizontal target at 0.880, while the 0.775–0.780 zone now acts as a launch pad for the next leg.
💡 Fundamental Analysis
● Buzz around August’s Chang governance hard-fork and a 12 % m/m jump in Cardano TVL signal improving network demand, backing the technical upside.
✨ Summary
Buy 0.775-0.790; hold above 0.756 eyes 0.86 ▶ 0.88. Bull view void on a 16 h close below 0.72.
-------------------
Share your opinion in the comments and support the idea with a like. Thanks for your support
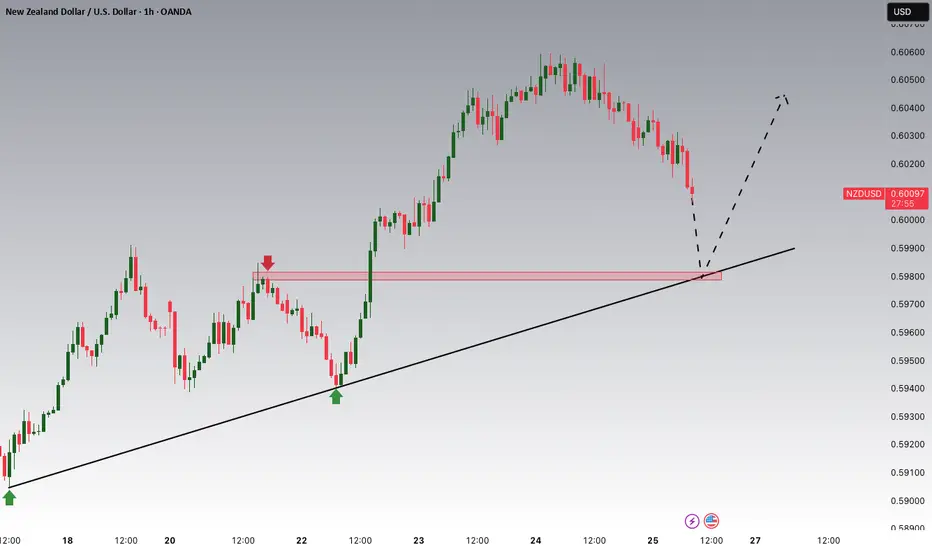
NZDUSD Potential UpsidesHey Traders, in today's trading session we are monitoring NZDUSD for a buying opportunity around 0.59800 zone, NZDUSD is trading in an uptrend and currently is in a correction phase in which it is approaching the trend at 0.59800 support and resistance area.
Trade safe, Joe.
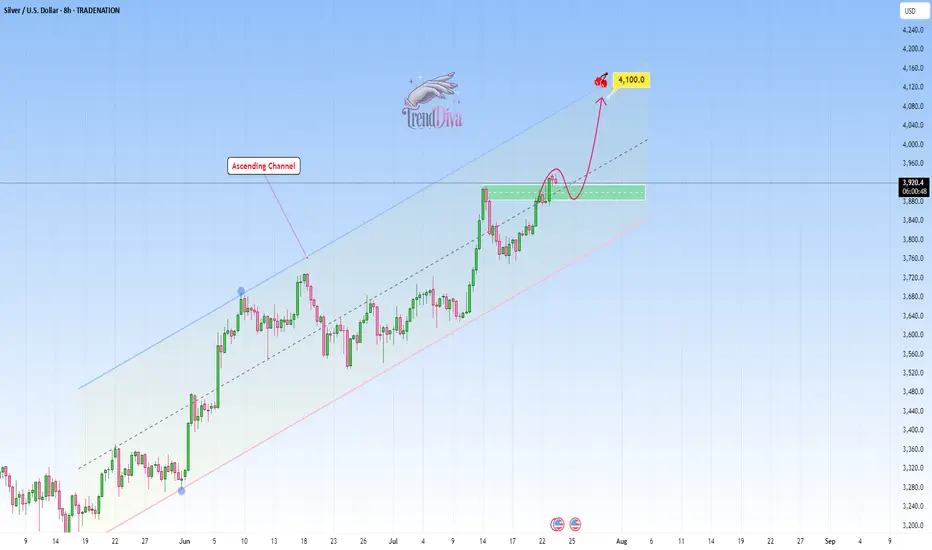
SILVER Analysis - Can buyers push toward 4,100$?TRADENATION:XAGUSD is trading within a clear ascending channel, with price action consistently respecting both the upper and lower boundaries. The recent bullish momentum indicates that buyers are in control, suggesting there's chances for potential continuation on the upside.
The price has recently broken above a key resistance zone and now came back for a retest. If this level holds as support, it would reinforce the bullish structure and increase the likelihood of a move toward the 4,100 target, which aligns with the channel’s upper boundary.
As long as the price remains above this support zone, the bullish outlook stays intact. However, a failure to hold above this level could invalidate the bullish scenario and increase the likelihood of a deeper pullback.
Remember, always confirm your setups and use proper risk management.
Disclosure: I am part of Trade Nation's Influencer program and receive a monthly fee for using their TradingView charts in my analysis.
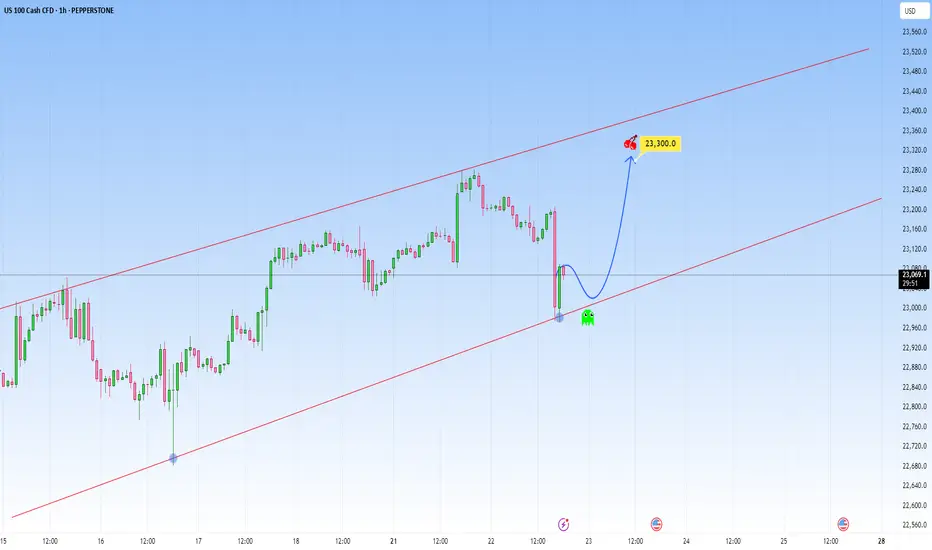
NAS100 steadies at high levels, pay attention nextThe most recent move on NAS100 saw a sharp drop that briefly recovered, likely triggering stops before aggressively reversing from the lower boundary of the newly projected channel. This isn't a cause for concern, on the contrary, it's another opportunity to get involved.
That is because this drop and recovery is a common behavior in strong uptrends before resuming bullish momentum.
The market is likely in the early stages of a new impulsive leg to the upside right here.
We could either have short-term consolidation or pullback, then a continuation toward the upper channel boundary or straight upwards, and with NAS100, the latter is more plausible.
My target will be at 23,300 around the upper boundary of the projected channel resistance.
In this context, the market remains bullish clearly. The most interesting aspect is the emotional flush on the last drop, trapping sellers before fueling what could be another big leg up.
Bitcoin: Strategic Entry Plan on Pullback – 116k Buy Opportunity__________________________________________________________________________________
Technical Overview – Summary Points
➤ Bullish momentum across all higher timeframes (1H to 1W) supported by Risk On / Risk Off Indicator (Strong Buy).
➤ Major supports: 116,128 and 111,980 (multi-timeframe pivots). Key resistance at 123,218.
➤ Very high intraday volumes, pointing towards probable capitulation zones.
➤ Multi-timeframe behaviors: Technical rebound anticipated on the 116,128–115,600 zone, caution if 111,980 breaks.
__________________________________________________________________________________
Strategic Summary
➤ Global Bias: Bullish confirmed mid/long-term.
➤ Accumulation opportunities on key pullbacks near 116,128 and 111,980.
➤ Risk zone: sustained closes below 111,980 = invalidation of bullish outlook (target 105,100).
➤ Macro catalysts: FOMC meeting (July 29-30), heightened event-risk period.
➤ Action plan: favor entries after FOMC volatility resolution, stop-loss adjusted below 111,980.
__________________________________________________________________________________
Multi-Timeframe Analysis
Daily (1D) : Compression under 123,218 resistance, primary bullish trend, no extreme signals.
12H : Healthy consolidation under resistance, no euphoria or panic, normal volumes.
6H : Price squeezed between major supports (116,128–111,980), uptrend confirmed.
4H : Institutional volumes on supports, favors technical rebound.
2H : Speculative rebound underway, confirmation needed for short-term bottom.
1H : Strong capitulation signal, record volumes, immediate retest of 116,128 support.
30min : Local oversold status, extreme sentiment, high technical reversal probability.
15min : Phase of panic likely ending, short-term rebound anticipated.
Key Indicators:
Risk On / Risk Off Indicator: Strong buy on 1D–4H, neutral on 30min and 15min.
ISPD DIV: Neutral to Buy (capitulation signaled on 1H+30min).
Volumes: Very high at lows = capitulation + potential bottom.
MTFTI: Up momentum above 1H, down on lower timeframes (30–5min).
__________________________________________________________________________________
Cross Timeframe Synthesis
High timeframe alignment confirms bullish bias, supported by buyer volumes.
Key zone 116,128–111,980 = multi-timeframe support, tactical focus.
Main risk: break of 111,980.
__________________________________________________________________________________
Operational synthesis & macro context
Bullish bias validated unless breakdown below 111,980.
Tactical accumulation window on pullbacks, 1H confirmation needed.
Volatility risk increases ahead/during FOMC, dynamic stop management essential.
Altcoins fragile: extra caution if BTC triggers Risk Off.
Calendar to watch: FOMC (July 29–30), Durable Goods (July 25).
__________________________________________________________________________________
On-Chain (Glassnode) :
BTC consolidates, no extreme signs; ETH outperforming but caution on alts (elevated leverage).
__________________________________________________________________________________
⏳ *Decision Recap for July 25, 2025, 10:56 CEST:*
— BUY ZONE tactical at 116,128–115,600 (BTC), 1H confirmation required.
— Stop-loss below 111,980 / Swing target >120,000–123,218.
— Risks : Fed announcements, flushes on supports, altcoins at risk.
__________________________________________________________________________________

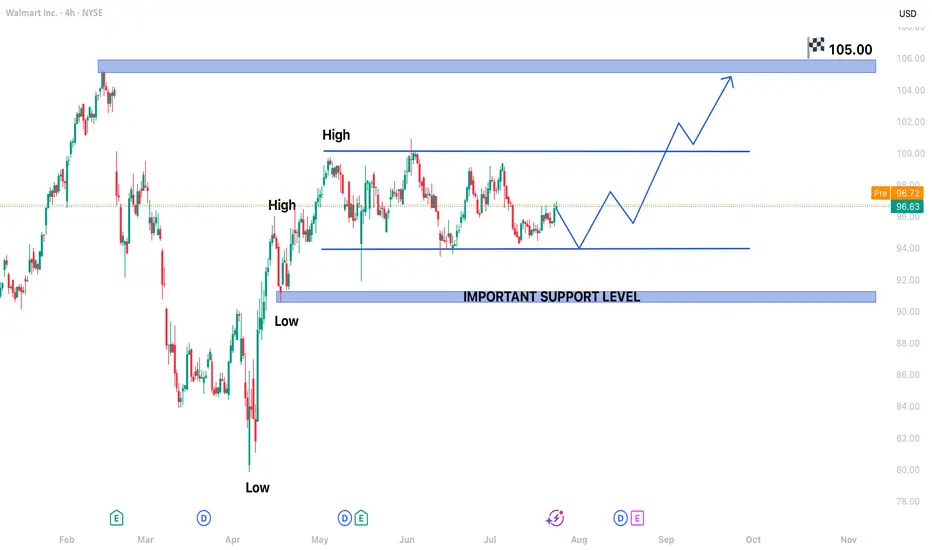
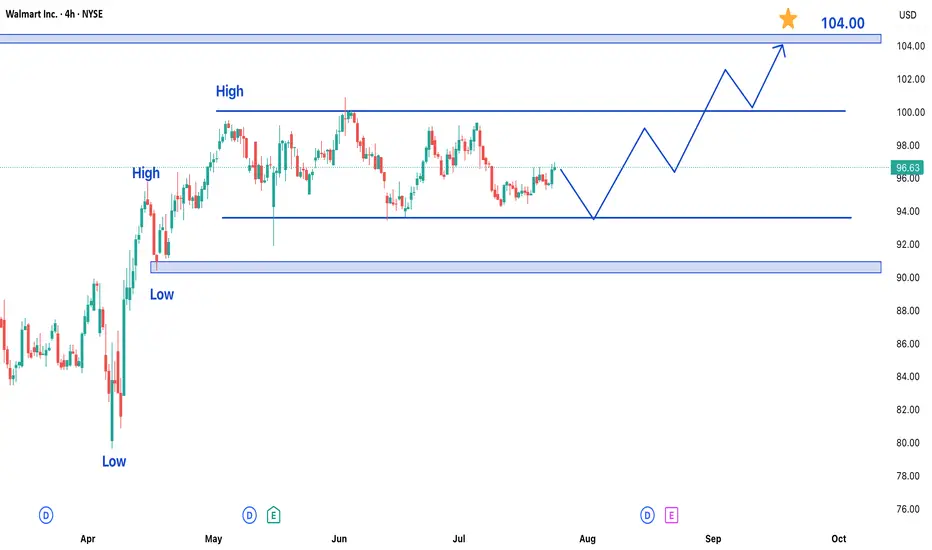
Walmart Stock Trading in Bullish Trend - Upside Potential AheadWalmart Inc. (WMT) shares are currently exhibiting a bullish trend, maintaining upward momentum over recent trading sessions. While the stock has been consolidating in a range over the past few days, the broader outlook remains positive, suggesting potential for further gains in upcoming sessions.
Key Observations:
- Established Uptrend: Walmart's price action reflects sustained buying interest, keeping the stock in a bullish phase.
- Range-Bound Consolidation: Recent sideways movement indicates a temporary pause, often a precursor to the next directional move.
- Strong Support & Resistance Levels: The stock has formed clear reference points for traders to watch.
Price Projections:
- Upside Target at $105: A breakout above the current range could propel WMT toward the $105 resistance level, representing a significant upside opportunity.
- Key Support at $90: On the downside, the $90 level has emerged as a strong support zone. Any pullback is likely to find buying interest near this area.
Market Implications:
1. Bullish Continuation Likely: The consolidation within an uptrend typically resolves in the direction of the prevailing trend—in this case, upward.
2. Breakout Potential: A decisive move above the recent range high could accelerate buying momentum toward $105.
3. Risk Management Consideration: While the bias is bullish, a drop below $90 would signal weakening momentum and potentially invalidate the near-term upside scenario.
Trading Strategy:
- Entry: Consider long positions on a confirmed breakout above the range, or on dips near $90 support.
- Stop Loss: A close below $90 would suggest a trend reversal, warranting exit from bullish positions.
- Target: $105 serves as the primary upside objective, with interim resistance levels to monitor along the way.
Final Thoughts:
Walmart’s stock appears poised for further gains, with $105 as the next key target. Traders should watch for a breakout from the current range while keeping an eye on the $90 support level for risk management. As always, confirmation through price action and volume will be crucial for validating the bullish thesis.
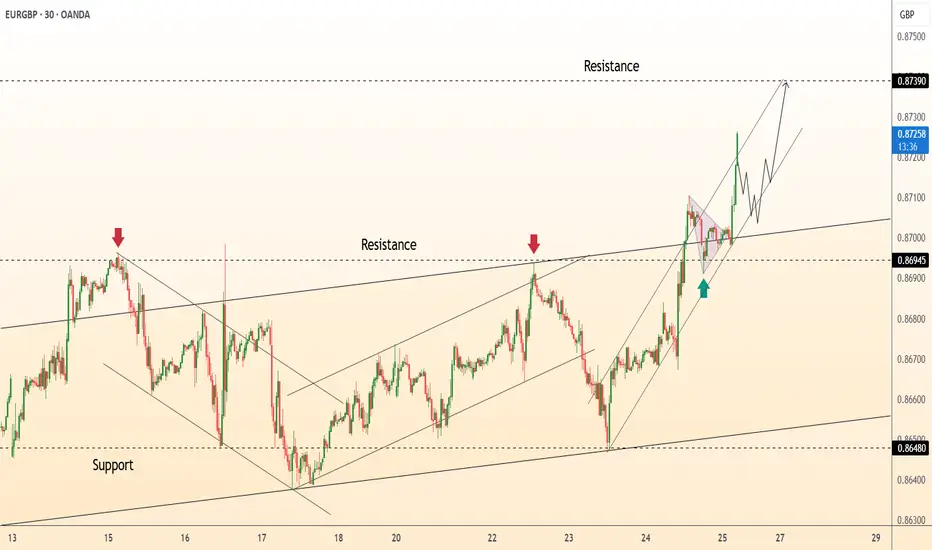
DeGRAM | EURGBP exited the channel📊 Technical Analysis
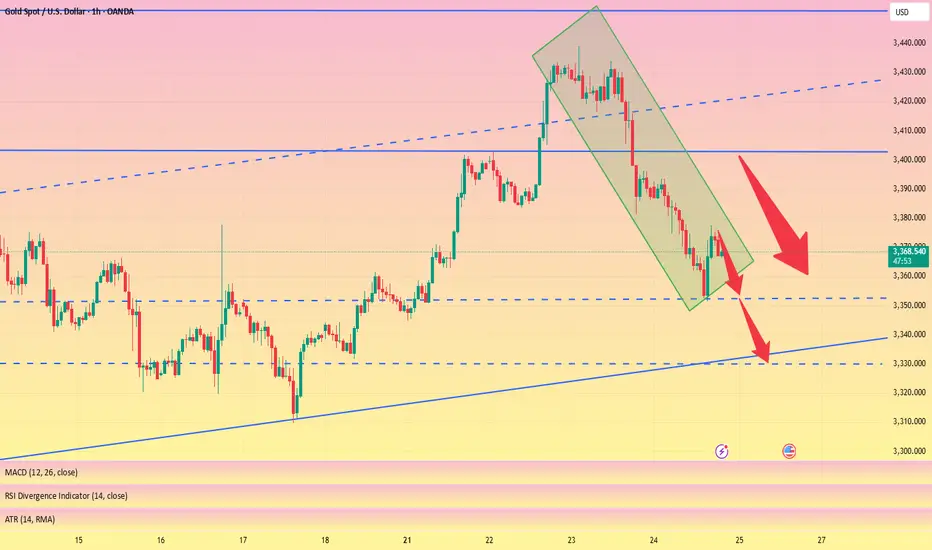
● Fresh rejection at the blue resistance line (~3 435) pushed XAU back to the 3 355 mid-band, yet successive higher-lows (green arrows) keep price inside the May-origin rising channel.
● The pullback is probing 3 328-3 355 — confluence of the former flag roof and triangle top; holding this zone should launch another test of 3 400/3 435, with the channel crest targeting 3 500.
💡 Fundamental Analysis
● U-S S&P-Global PMIs softened, nudging 2-yr real yields to three-week lows, while cautious ECB rhetoric limits dollar gains — both supportive for gold.
✨ Summary
Long 3 328-3 355; above that aims 3 400 ➜ 3 435, stretch 3 500. Invalidate on an H4 close below 3 293.
-------------------
Share your opinion in the comments and support the idea with like. Thanks for your support!
GBPAUD: Another Pullback Trade for TodayGBPAUD formed an ascending triangle pattern at a significant daily/intraday horizontal support.
And breaking its neckline indicates buyer strength.
I anticipate the pair could rise to the 2.0568 level.

Trend corrected, long funds reduced, sellers returned#XAUUSD
The current moving average is still spreading downward, and the 4-hour chart closed with a large negative line. The market has not yet given a clear feedback on the current trend. However, after a large amount of buying funds intervened, the gold price hit a high of around 3377 and then stagnated. The short-term bullish momentum has weakened, and there is a certain risk of a correction and decline. Sellers are beginning to return📉.
Currently, you can consider participating in short selling at 3370-3377💡. If it rebounds directly to 3400-3405, you can still short if it does not break🔍. The target is 3360 below, and 3350 or even 3330 if it breaks🎯.
🚀 SELL 3370-3377
🚀 TP 3360-3350
Walmart Stock Trading in Bullish Trend – Upside Potential AheadWalmart Inc. (WMT) shares are currently exhibiting a bullish trend, maintaining upward momentum over recent trading sessions. While the stock has been consolidating in a range over the past few days, the broader outlook remains positive, suggesting potential for further gains in upcoming sessions.
Key Observations:
- Established Uptrend: Walmart's price action reflects sustained buying interest, keeping the stock in a bullish phase.
- Range-Bound Consolidation: Recent sideways movement indicates a temporary pause, often a precursor to the next directional move.
- Strong Support & Resistance Levels: The stock has formed clear reference points for traders to watch.
Price Projections:
- Upside Target at $105: A breakout above the current range could propel WMT toward the $105 resistance level, representing a significant upside opportunity.
- Key Support at $90: On the downside, the $90 level has emerged as a strong support zone. Any pullback is likely to find buying interest near this area.
Market Implications:
1. Bullish Continuation Likely: The consolidation within an uptrend typically resolves in the direction of the prevailing trend—in this case, upward.
2. Breakout Potential: A decisive move above the recent range high could accelerate buying momentum toward $105.
3. Risk Management Consideration: While the bias is bullish, a drop below $90 would signal weakening momentum and potentially invalidate the near-term upside scenario.
Trading Strategy:
- Entry: Consider long positions on a confirmed breakout above the range, or on dips near $90 support.
- Stop Loss: A close below $90 would suggest a trend reversal, warranting exit from bullish positions.
- Target: $105 serves as the primary upside objective, with interim resistance levels to monitor along the way.
Final Thoughts:
Walmart’s stock appears poised for further gains, with $105 as the next key target. Traders should watch for a breakout from the current range while keeping an eye on the $90 support level for risk management. As always, confirmation through price action and volume will be crucial for validating the bullish thesis.
BTCUSD DROPPED BELOW LOCAL SUPPORTBTCUSD DROPPED BELOW LOCAL SUPPORT📉
Today bitcoin dropped below the level of 116,000.00 on high volume. However, the price didn't go somewhere far downwards and consolidates slightly below this level. Presumably, descending channel may be formed.
What is a descending channel?
A descending channel is a bearish chart pattern formed by two downward-sloping parallel trendlines connecting lower highs and lower lows in a pair’s price, indicating a consistent downtrend. It shows sellers are in control, with prices declining within a defined range.
Here I presume the price to rebound from lower border of the descending channel with possible movement towards upper border slightly below the 120,000.00 level.

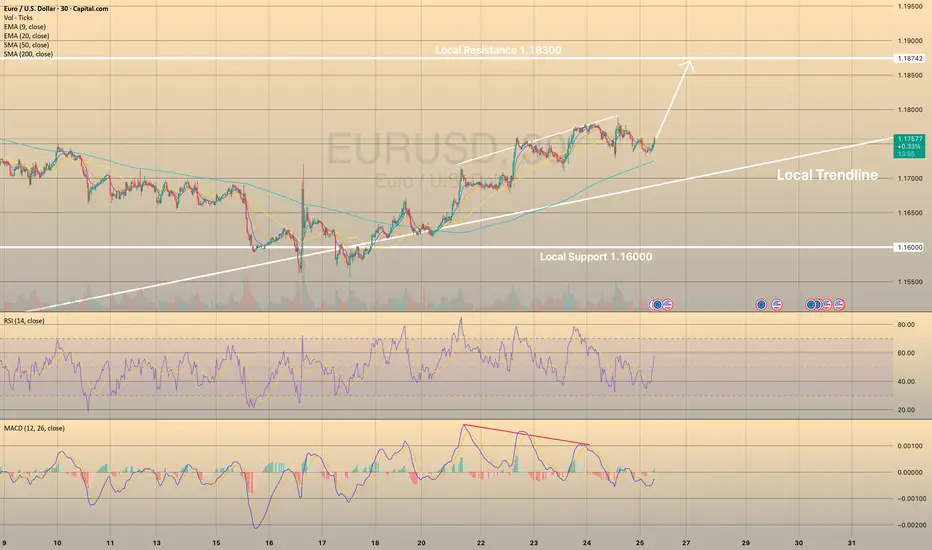
EURUSD HOLDS BULLISH MOMENTUMEURUSD HOLDS BULLISH MOMENTUM📈
24 July I wrote about bearish divergence in EURUSD. Now we see that this resulted into decline towards sma200 on 30-m chart. Currently the price is rebounding from this moving average.
What is the sma200?
The sma200 is a technical indicator that calculates the average closing price of a forex pair or crypto over the past 200 trading periods. It’s used to identify long-term trends, smooth out short-term price fluctuations, and determine potential support or resistance levels.
There is high possibility that the price will continue its way towards local resistance of 1.18300.
Quick short on the pull back of EURUSDPrice touched a supply zone and formed a break of structure on the 1 hour. I may have missed the entry, but i placed a sell limit with a TP to the imbalance below.

Pull back on GBPUSDThe clear break of structure gives me confidence that a short trade is possible today. Ideally i want a retest of the imbalance and then a push down. My TP is quite far at the moment and i may take profit earlier or move my SL.

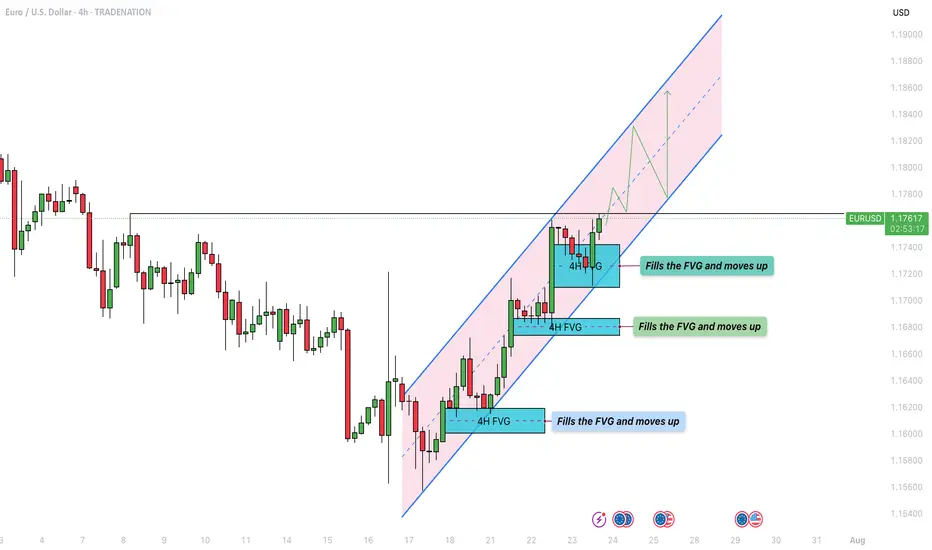
EUR/USD - Bullish parallel channel formation!The EUR/USD currency pair is currently exhibiting a bullish market structure on the 4-hour timeframe, moving steadily within a well-defined ascending parallel channel. Price action has consistently bounced between the lower and upper boundaries of the channel, with each dip finding support at the lower trendline and each rally meeting resistance near the upper trendline. This ongoing pattern suggests a strong and orderly bullish trend as the pair continues to make higher highs and higher lows within the channel.
The Market’s Upward Momentum
One notable feature of this trend is the recurring formation of 4-hour Fair Value Gaps (FVGs) during each upward leg. These FVGs act as temporary inefficiencies in the price movement, which the market consistently returns to fill before resuming its bullish momentum. As shown in the chart, the EUR/USD has filled multiple FVGs over the past week. Today, the pair once again retraced to fill a newly formed 4H FVG and has since continued its move higher. This repeated behavior reinforces the strength of the uptrend, as the market efficiently corrects itself and then propels further in the direction of the overall trend.
Bullish Outlook
From a bullish perspective, the key level to watch is the horizontal resistance zone around 1.1766. A confirmed break and hold above this level would signal a strong continuation of the current uptrend. Should the price sustain itself above this level, it could initiate a renewed push toward the upper boundary of the ascending channel, potentially targeting levels near 1.1820 and beyond. This scenario would confirm market confidence and open the door for further gains.
Bearish Risk
On the flip side, the bearish case would involve a false breakout above the 1.1766 resistance level, followed by a sharp rejection and a break below the rising lower trendline of the channel. Such a move would invalidate the current structure and shift the bias to the downside. In that case, the 4-hour FVG located between approximately 1.1710 and 1.1740 will act as a critical support zone. If this area fails to hold, it could trigger a deeper retracement and potentially lead to a more prolonged bearish correction.
Final thoughts
In summary, the EUR/USD is currently respecting a bullish parallel channel on the 4-hour timeframe, with upward moves consistently leaving and then filling 4H FVGs before continuing higher. The 1.1766 level is pivotal, a sustained break above it favors continued bullish momentum, while a rejection and breakdown from the channel could signal a bearish reversal. Traders should closely monitor price behavior around this key level and the integrity of the ascending channel to anticipate the next significant move.
-------------------------
Disclosure: I am part of Trade Nation's Influencer program and receive a monthly fee for using their TradingView charts in my analysis.
Thanks for your support. If you enjoyed this analysis, make sure to follow me so you don't miss the next one. And if you found it helpful, feel free to drop a like 👍 and leave a comment 💬, I’d love to hear your thoughts!
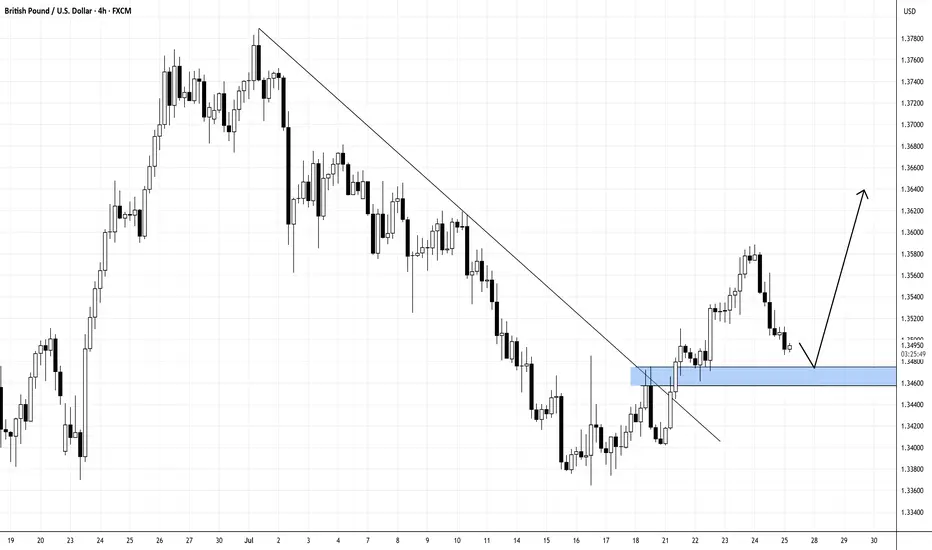
After Breaking Downward Trend, GBPUSD Ready for Upward Rally!GBPUSD
N.B!
- GBPUSD price might not follow the drawn lines . Actual price movements may likely differ from the forecast.
- Let emotions and sentiments work for you
- ALWAYS Use Proper Risk Management In Your Trades
#audusd

BTC/USD – 4H Technical and Fundamental AnalysisBTC/USD – 4H Technical and Fundamental Analysis
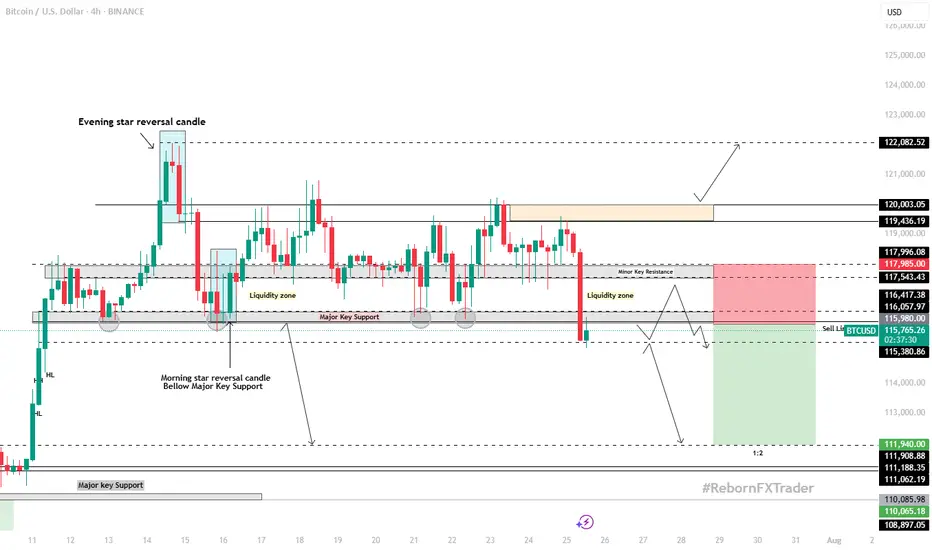
BTC/USD saw sharp downside pressure today, driven by a wave of long position liquidations—exceeding $800 million across the crypto market in the past 24 hours. The sudden shift triggered panic selling, dragging Bitcoin below its psychological and technical support near $116,000. Broader crypto market sentiment turned risk-off as large investors reduced exposure, accelerating the sell-off.
Fundamentally, the market remains cautious amid a lack of positive macroeconomic catalysts for risk assets. Speculation about stricter U.S. regulatory oversight and declining inflows into crypto ETFs also dampened sentiment. Combined with hawkish remarks from Fed officials, which keep interest rates elevated, appetite for high-risk assets like Bitcoin weakened further.
From a technical perspective, BTC/USD broke below the major support level of $116,000, confirming bearish pressure. This breakdown followed a period of consolidation, with price failing to maintain bullish momentum. A liquidity hunt appears to be underway, with price revisiting the zone to trap breakout traders before resuming its move.
We are now watching for a confirmed 4H candle close below the liquidity zone. Once confirmed, a short setup is validated, with targets aligned with the next key support zone.
📍 Sell Setup
Entry: Sell Limit at 115,980.00
Stop Loss: 117,985.00
Take Profit: 111,940.00
📌 Disclaimer:
This is not financial advice. Always wait for proper confirmation before executing trades. Manage risk wisely and trade what you see—not what you feel.
GOLD → Countertrend correction. Where will growth begin?FX:XAUUSD faced pressure in the 3430 zone, traders moved into profit-taking mode, triggering a correction. The price entered the sell-off zone...
On Thursday, gold is trading below $3400 as traders assess progress in US-EU trade talks and await preliminary PMI data from the US and the EU. These indicators could influence expectations for Fed and ECB rates. Optimism is being bolstered by reports of trade agreements between the US and Japan and other countries. The ECB is expected to keep rates unchanged, while the probability of a Fed rate cut in September is estimated at 60%. Investors are also watching Trump's conflict with Powell amid his visit to the Fed. Technically, the daily market structure is not broken, and a correction is forming within acceptable limits.
Based on the current direction, the market may test the intermediate bottom: trend support, the 3345-3320 area.
Resistance levels: 3375, 3383, 3400.
Support levels: 3345, 3320
A retest of resistance at 3375-3383 is possible. If the bears keep the price below this zone, the metal may continue its correction phase towards the zone of interest indicated on the chart. Local sell-offs have not yet broken the bullish daily structure.
However, the absence of a downward impulse and consolidation in 3375 - 3383 with a subsequent breakout of local resistance could increase demand again, which would generally lead to premature growth to 3400 - 3435.
Best regards, R. Linda!

BTC/USD – 4H Technical and Fundamental AnalysisBTC/USD – 4H Technical and Fundamental Analysis
BTC/USD saw sharp downside pressure today, driven by a wave of long position liquidations—exceeding $800 million across the crypto market in the past 24 hours. The sudden shift triggered panic selling, dragging Bitcoin below its psychological and technical support near $116,000. Broader crypto market sentiment turned risk-off as large investors reduced exposure, accelerating the sell-off.
Fundamentally, the market remains cautious amid a lack of positive macroeconomic catalysts for risk assets. Speculation about stricter U.S. regulatory oversight and declining inflows into crypto ETFs also dampened sentiment. Combined with hawkish remarks from Fed officials, which keep interest rates elevated, appetite for high-risk assets like Bitcoin weakened further.
From a technical perspective, BTC/USD broke below the major support level of $116,000, confirming bearish pressure. This breakdown followed a period of consolidation, with price failing to maintain bullish momentum. A liquidity hunt appears to be underway, with price revisiting the zone to trap breakout traders before resuming its move.
We are now watching for a confirmed 4H candle close below the liquidity zone. Once confirmed, a short setup is validated, with targets aligned with the next key support zone.
📍 Sell Setup
Entry: Sell Limit at 115,980.00
Stop Loss: 117,985.00
Take Profit: 111,940.00
📌 Disclaimer:
This is not financial advice. Always wait for proper confirmation before executing trades. Manage risk wisely and trade what you see—not what you feel.
