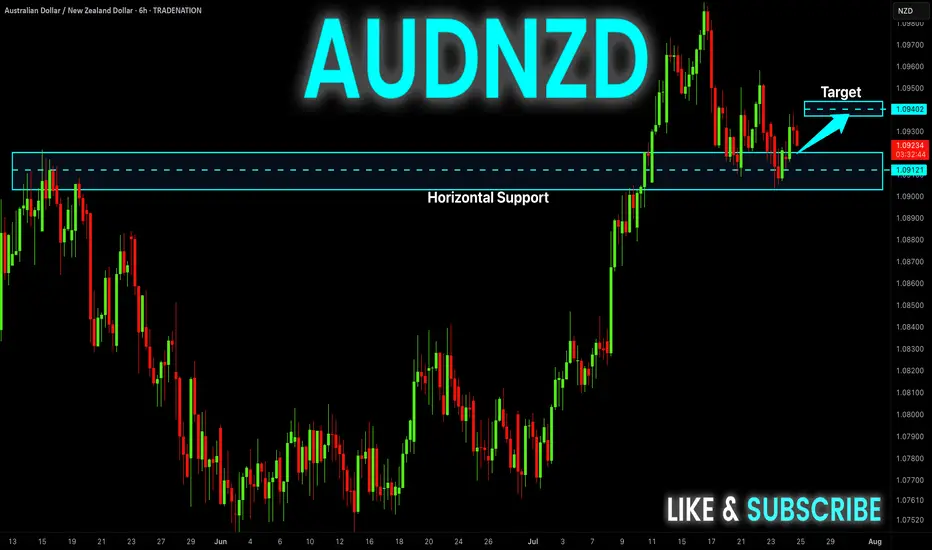
AUD-NZD Local Long! Buy!
Hello,Traders!
AUD-NZD is about to retest
A strong horizontal support
Level of 1.0912 and as we are
Bullish biased we will be expecting
A local bullish rebound
Buy!
Comment and subscribe to help us grow!
Check out other forecasts below too!
Disclosure: I am part of Trade Nation's Influencer program and receive a monthly fee for using their TradingView charts in my analysis.
Support and Resistance
SELL ETH 25.7.2025Reversal trade order: SELL at H1~M15
Type of entry: Limit order
Reason:
- Candle creates reverse number 1 model
- The bottom hasn't touched any peak yet (meaning it hasn't reached a strong reversal zone)
Note:
- Management of money carefully at the price of bottom of M5 (3,716)
Set up entry:
- Entry sell at 3,751
- SL at 3,776
- TP1: 3,716
- TP2: 3,670
Trading Method: Price action (No indicator, only trend and candles)

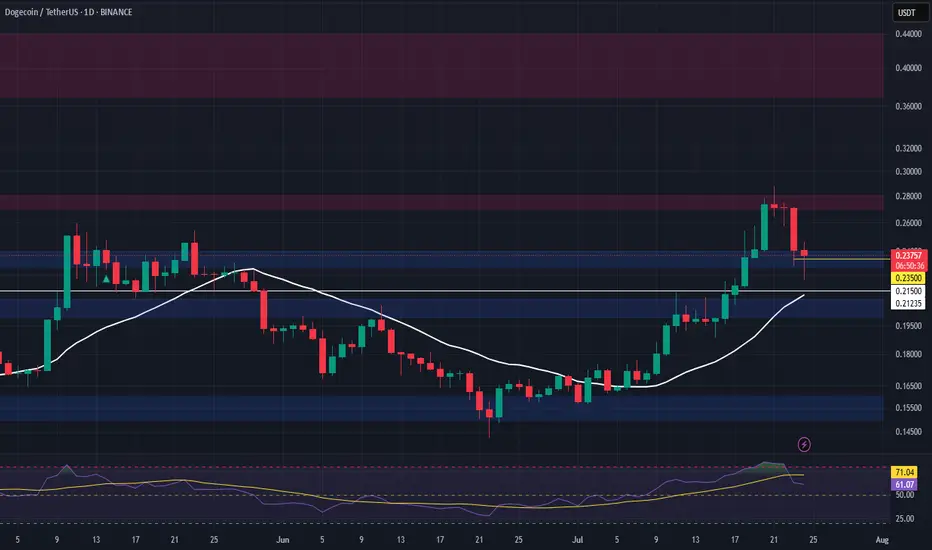
DOGE Swing Trade – Key Support in PlayDOGE is currently holding a major support zone, offering a strong risk-reward opportunity for a long swing position. With bullish sentiment and meme coin narratives returning, this level is worth watching for upside continuation.
📌 Trade Setup:
• Entry Zone: $0.23 – $0.24
• Take Profit Targets:
o 🥇 $0.27 – $0.28
o 🥈 $0.37 – $0.44
• Stop Loss: Just below $0.215
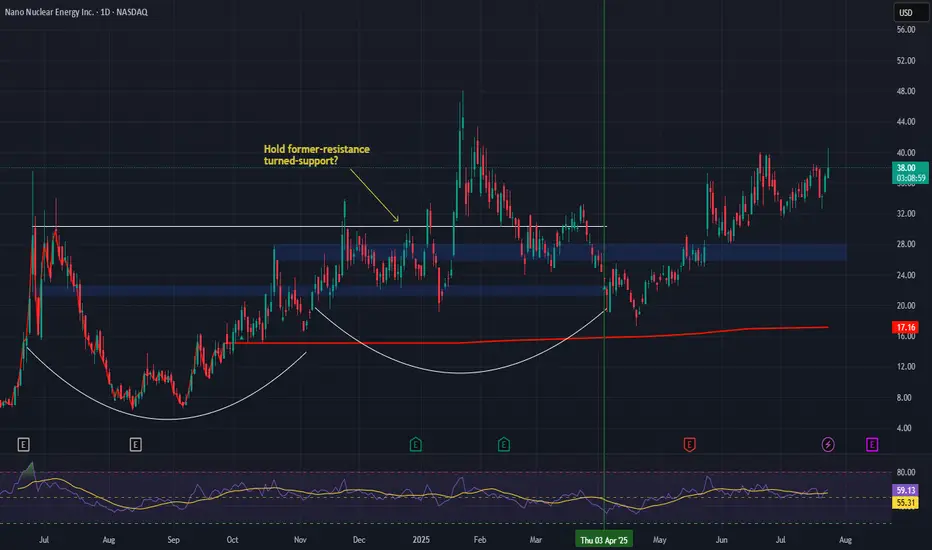
Nano Nuclear (NNE) –Powering the Future of Clean U.S. Energy 🇺sCompany Snapshot:
Nano Nuclear Energy NASDAQ:NNE is a pioneering U.S.-based microreactor company developing compact, modular nuclear power solutions for defense, medical, and national grid applications.
Key Catalysts:
Nuclear Innovation Meets Energy Independence 🔌
NNE is at the forefront of advanced nuclear tech, supporting America’s push toward energy resilience and decarbonization.
Its microreactors are designed for fast deployment, critical for defense bases, hospitals, and remote power needs.
Strong Market Momentum 📈
Since our initial entry on April 3rd, NNE has surged 74%, reflecting rising investor interest in nuclear solutions.
After printing a higher high, the stock is pulling back toward a key support zone.
Policy & Investor Tailwinds 📊
U.S. energy policy is increasingly focused on nuclear as a clean base-load source, giving NNE a strategic edge.
Growing institutional attention on microreactors as scalable, next-gen energy infrastructure.
Investment Outlook:
Bullish Entry Zone: $26.00–$27.00
Upside Target: $58.00–$60.00, supported by innovation, policy alignment, and long-term energy demand.
🔆 NNE is shaping up as a high-conviction play on America’s nuclear energy future.
#NNE #NuclearEnergy #Microreactor #CleanEnergy #EnergySecurity #DefenseTech #GridStability #Innovation #GreenEnergy #NextGenPower #EnergyIndependence
AUD/USD Bulls Eye BreakoutThe Australian Dollar surged more than 1.8% this week with AUD/USD now testing multi-month uptrend resistance at fresh yearly highs. A four-day rally takes price into confluent resistance at the September low / upper parallel at 6622- The focus is on today’s close with the immediate advance vulnerable while below this key slope. Subsequent resistance objectives eyed at the 2019 low at 6671 and the 78.6% retracement of the broader 2024 decline at 6723.
Initial support rests with the July open at 6581 and is backed by the May high-day close (HDC) / weekly open at 6486-6506. Losses would need to be limited to this region for the late-June advance to remain viable (near-term bullish invalidation). Subsequent support seen at the June low-day close (LDC) at 6458 with a break below 6350 ultimately needed to suggest a more significant high is in place / larger reversal is underway.
Bottom line: A breakout of the July opening-range takes AUD/USD into confluent uptrend resistance- risk for topside exhaustion / price inflection here. From a trading standpoint, a good zone to reduce portions of long-exposure / raise protective stops – losses shudl be limited to 6486 IF price is heading higher on this stretch with a close above this slope needed to fuel the next leg of the advance.
Keep in mind the FOMC interest rate decision is on tap next week with Core Personal Consumption Expenditures (PCE) and Non-Farm Payrolls (NFPs) slated into the monthly cross. Stay nimble into the releases and watch the weekly closes here.
-MB

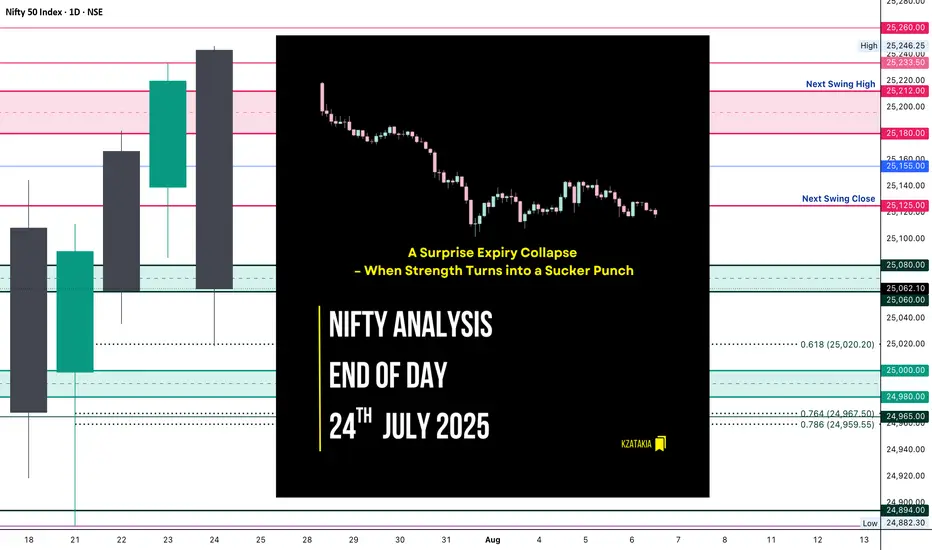
Nifty Analysis EOD – July 24, 2025 – Thursday 🟢 Nifty Analysis EOD – July 24, 2025 – Thursday 🔴
📉 A Surprise Expiry Collapse – When Strength Turns into a Sucker Punch
Today’s session was an unexpected twist.
Nifty opened above the previous day’s high, giving early hope to the bulls—but within the first hour, it slipped to 25,155 and formed its IB. What followed was a sharp 136-point fall, breaking not just yesterday’s low, but also the July 22nd low. This sudden bearish momentum was completely news-driven, and expiry-day long unwinding only added fuel to the fire.
Despite a strong close yesterday, today’s fall erased all of July 23rd’s gains and brought us right back to July 22nd’s close—neutralizing the recent upward effort.
The day closed at 25,062, marginally above key support. Technically, today’s low respected the 0.618 Fib retracement level drawn from July 21st’s low to July 23rd’s high—so a dead cat bounce is possible if no further bad news hits. But if we open below 25,050 tomorrow, expect more downside pressure toward 24,960–24,890 zones.
🕯 5 Min Time Frame Chart with Intraday Levels
🕯 Daily Time Frame Chart with Intraday Levels
🕯 Daily Candle Breakdown
Open: 25,243.30
High: 25,246.25
Low: 25,018.70
Close: 25,062.10
Change: −157.80 (−0.63%)
Candle Structure Analysis:
🔴 Body: Large red body (181.2 pts) shows strong intraday selling.
☁️ Upper Wick: Tiny (2.95 pts) → sellers dominated from the start.
🌊 Lower Wick: Moderate (43.4 pts) → small recovery near close.
Candle Type:
Almost a bearish Marubozu — clear domination by sellers with barely any upper shadow, signaling intense sell pressure.
Key Insight:
Bulls lost control after open.
Bears took charge below 25,155.
Close near support, but bias cautious.
Bulls must reclaim 25,150+ for recovery, else 25,000 may give way.
🛡 5 Min Intraday Chart
⚔️ Gladiator Strategy Update
ATR: 185.97
IB Range: 83.55 → Medium
Market Structure: Balanced
Trades Triggered:
⏰ 10:05 AM – Short Entry → SL Hit
⏰ 11:10 AM – Short Entry → Target Hit (1:3.6 Risk:Reward)
📊 Support & Resistance Levels
Resistance Zones:
25,125
25,155
25,180 ~ 25,212
25,233
Support Zones:
25,080 ~ 25,060
25,020
25,000 ~ 24,980
24,967 ~ 24,959
24,882
🔮 What’s Next?
A gap-up or stable open may trigger a dead cat bounce toward 25,150–25,180.
A gap-down below 25,050 confirms bearish continuation → next targets: 24,960 / 24,890.
Watch price action around the 25,020–25,060 zone closely.
🧠 Final Thoughts
“Markets are never wrong – opinions often are.”
— Jesse Livermore
Today was a reminder of how expiry day surprises and news flows can flip the narrative. Stay flexible, and keep a bias—but not a blind one.
✏️ Disclaimer
This is just my personal viewpoint. Always consult your financial advisor before taking any action.
Bitcoin Bullish Structure Holds: Focus on Support Entries & Brea__________________________________________________________________________________
Technical Overview – Summary Points
__________________________________________________________________________________
Momentum: Uptrend synchronization on all timeframes (MTFTI Strong Up). Risk On / Risk Off Indicator: strong buy on larger TF, neutral intraday.
Supports/resistances: Main HTF supports well below current price (115,736–117,000, 111,980). Key resistances to break: 120,998.7 and 122,318.
Volumes: Normal to moderate, no climax, no distribution detected.
Multi-TF behaviour: No behavioural excess, no sell signal, intraday phases are consolidative just below resistance, which is normal.
__________________________________________________________________________________
Strategic Summary
__________________________________________________________________________________
Overall bias: Strong bullish, no end-of-trend alert. Buying retracement towards the Pivot Lows is preferred.
Opportunities: Entries on dips to 115,700–117,000 (2H/4H); breakout above 120,250/122,300.
Risk zones: Return below 115,700 or 111,980 = structural alert. Increased vigilance for macro releases (ECB/PMI/Jobless Claims).
Macro drivers: Fed in focus (no move expected), volatility risk around July 29–30 (FOMC).
Action plan: Entry on retracement, dynamic management. Stop-loss under 115,736 then 111,980. Partial exits on excess or confirmed breakout.
__________________________________________________________________________________
Multi-Timeframe Analysis
__________________________________________________________________________________
1D: Resistances 122,318, 120,998.7; supports 115,736.9, 105,100.2. Risk On / Risk Off Indicator: strong buy, all synchronized bullish, no exhaustion. Daily bias: robust uptrend.
12H/6H/4H: Bullish confluence. Strong momentum, stable volume, validated supports. No ISPD excess, sectoral strength intact.
2H/1H: Consolidation below resistance; healthy structure. Supports to be favored for swing/intraday positioning. Minor intraday hesitation, no reversal.
30min/15min: Behavioural neutrality, lateral movement. Volume normal to mildly elevated, no overheating. Structural risk absent.
Additional indicators:
Risk On / Risk Off Indicator: Strong buy up to 2H; neutral on short TF.
ISPD DIV: Neutral, healthy market, no excess detected.
Volume: No climax or distribution, multi-TF structural support.
Cross-timeframe synthesis: Multi-timeframe bullish alignment, no structural weakness. Opportunities on retracement, breakout plays above all-time highs.
__________________________________________________________________________________
Synthesis & Strategic Bias
__________________________________________________________________________________
BTC trend and momentum remain aligned, sector leadership (Risk On / Risk Off Indicator) intact.
Strong HTF support, major resistances must break for extension.
External risk: macroeconomic catalysts (Fed, ECB, US PMI).
Premium opportunities on dips to supports, dynamic management essential around macro events.
Final bias: as long as supports and indicator alignment hold, bull run continues. Partial exit at resistance; stops below validated pivots.

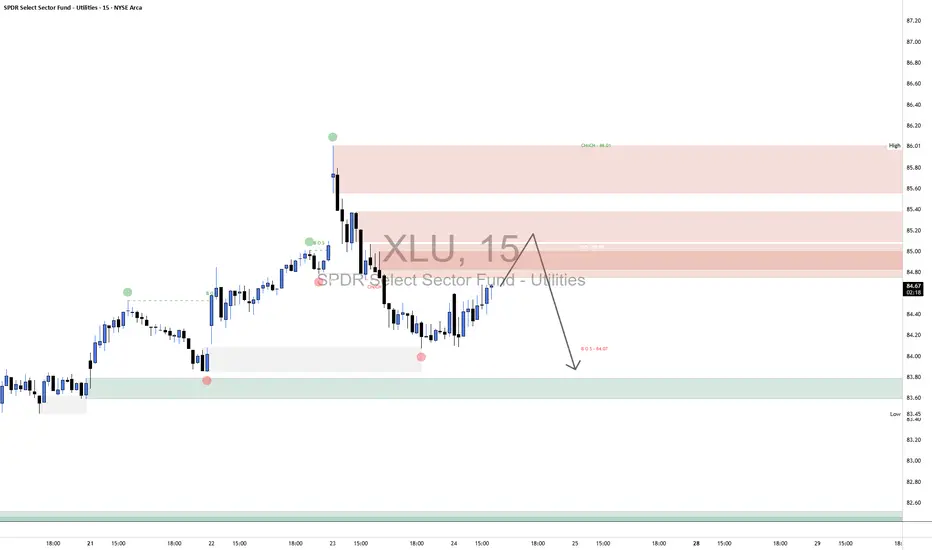
XLU Short1. Market Structure Overview
1.1 Change of Character (CHoCH) – 86.01
Marked a bearish shift after price broke below a significant higher low.
Suggests that the prior bullish trend has lost strength.
1.2 Break of Structure (BOS) – 84.07
Confirmed a bearish continuation, breaking below the previous support level.
Validates the downtrend structure following the CHoCH.
2. Supply & Demand Zones
2.1 Supply Zones (Resistance)
Zone A: 85.40–86.01
Major Supply zone created by distribution before the sharp sell-off.
Acts as strong resistance; sellers aggressively entered at this level.
Zone B: 84.80–85.20 (0.5 Level)
Intermediate Supply—likely a reaction zone for institutional sell limits.
Price could stall or reverse from this level before testing Zone A.
2.2 Demand Zones (Support)
Zone C: 83.45–83.80
First Major Demand—price reacted here previously with a strong bounce.
A break below could expose lower demand.
Zone D: 82.50–82.90
Deeper Demand—represents a high-probability buying area if Zone C fails.
3. Price Action in Bordered Region
Current Price (~84.69): Price is climbing toward supply after a local low.
Expected Move: Price is likely to:
Reach into Zone B (84.80–85.20).
Potentially reject from supply and continue downward.
If rejection occurs, price is expected to revisit Zone C (~83.50–83.80).
Bullish Scenario: If price breaks above 85.20 and sustains above 86.01, bullish continuation becomes likely.
Bearish Scenario: Rejection from current supply areas confirms continuation of the downtrend.
4. Structure & Momentum Outlook
Bias: Bearish, unless 86.01 is broken and flipped into support.
Momentum: Price is currently retracing with moderate strength. If supply absorbs buyers in Zone B, momentum will likely reverse to the downside.
Key Level to Watch: 85.00–85.20 area for reversal confirmation.
5. Supporting Financial Context
Sector Rotation: The Utilities sector (XLU) has seen recent inflows and outflows tied to market volatility and interest rate speculation.
Rate Sensitivity: Utilities are interest-rate sensitive, and the market is pricing in uncertainty around Fed cuts, adding pressure to the sector.
Recent Sentiment: Some analysts view defensive sectors like utilities as range-bound or underperforming during growth-driven rotations (CNBC, Bloomberg).
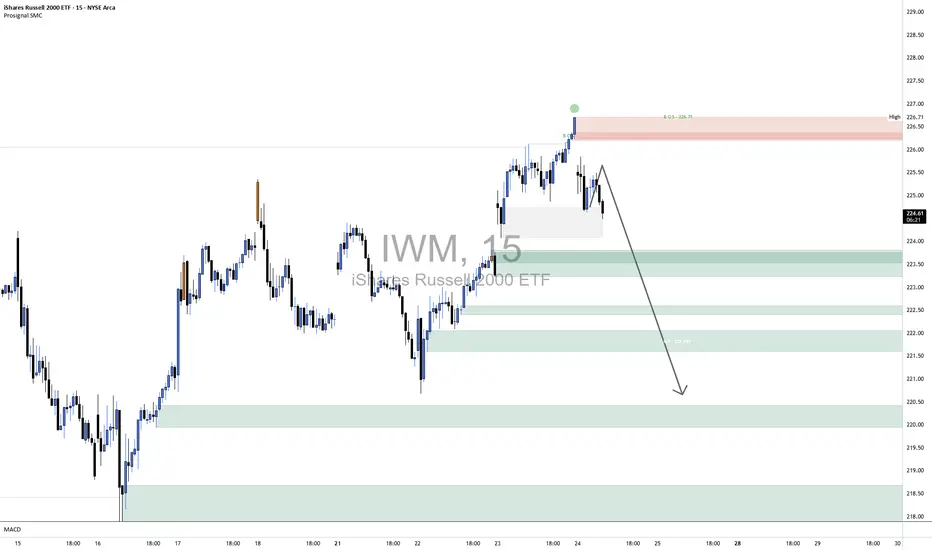
IWM Short1. Broader Market Structure 📉
1.1 Change of Character (CHoCH)
Occurred near the top (~226.70), breaking the prior higher low—signaling a shift from bullish to bearish momentum.
1.2 Break of Structure (BOS)
Confirmed by a move below that level, validating the bearish change and underlining a downtrend in progress.
2. Supply & Demand Zones
2.1 Demand Zones (Support)
Price zones where buyers have previously stepped in, marking potential reversal points:
Zone A (~223.00–223.50) – First layer of support; price tested this zone after the BOS.
Zone B (~221.80–222.20) – Mid-range demand area with historical buyer activity.
Zone C (~220.00–220.50) – Deeper support zone; last line before structural lows.
Key Takeaway: These zones represent probable stops for a short-term pullback and are ideal for long-entry decisions.
2.2 Supply Zone (Resistance)
~226.70–226.75 – Located at the level where BOS occurred; acts as near-term resistance where sellers may reassert control.
3. Price Action Inside the Bordered Area
Current Price (~224.55): Hovering between the supply and first demand zone.
Expected Movement:
A pullback into Zone A (~223.00–223.50).
If demand holds, look for a bullish reaction—forming a higher low, potentially pushing price back toward 226.70+.
Bearish Risk: A break below Zone A increases downside risk into Zone B or C, reinforcing the bearish structure.
4. Momentum & Structure Outlook
Bullish Scenario: A bounce from demand with structure preserved (~higher low) could lead to short-term upside into resistance.
Bearish Scenario: A drop below the bordered demand zone would confirm continuation of the downtrend.
Watch: Price structure around the 224–223 area and reversal cues (e.g., rejection candles, volume spikes).
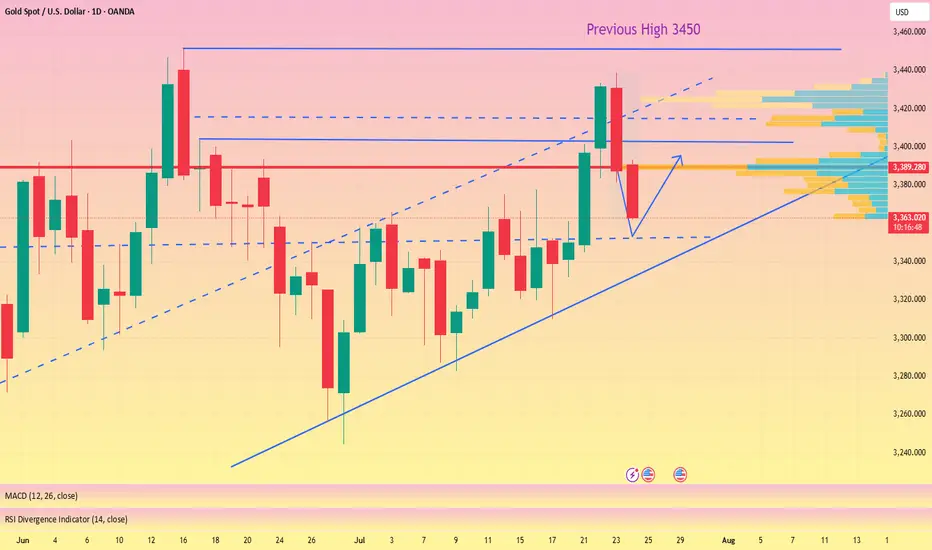
The callback is coming to an end, don't chase the short easily#XAUUSD
The long positions held last night have already left the market at a loss😔. After the Asian session opened, I continued to watch the trend of gold, but it did not effectively rebound to the ideal target area. After repeatedly testing around 3393, I chose to manually exit the market📀.
Gold is currently somewhat overcorrected, with the hourly line falling into severe oversold territory📉. But the market will eventually return to the bullish trend🐂. Why do I say that? First, there are less than 8 days left before the final deadline for tariffs. Second, the Federal Reserve’s interest rate cut is also approaching. In the medium and long term, there is definitely no problem with being bullish. There will be initial jobless claims data later, which will affect the trend of gold today. We need to pay some attention to it👀.
From the daily line, the current Bollinger Band middle track is near the 3343 line, and the SMA60 moving average is near the 3330 below. In the short term, the downward momentum of gold is released, and it is expected to test the 3343 mid-line support below💪.
📊Therefore, we can consider going long again at 3360-3343 below and look towards 3375-3385. Short-term losses don’t mean anything. With the recent frequent news fluctuations, we still have a good chance to turn losses into profits🚀.
🚀BUY 3360-3350
🚀TP 3375-3385
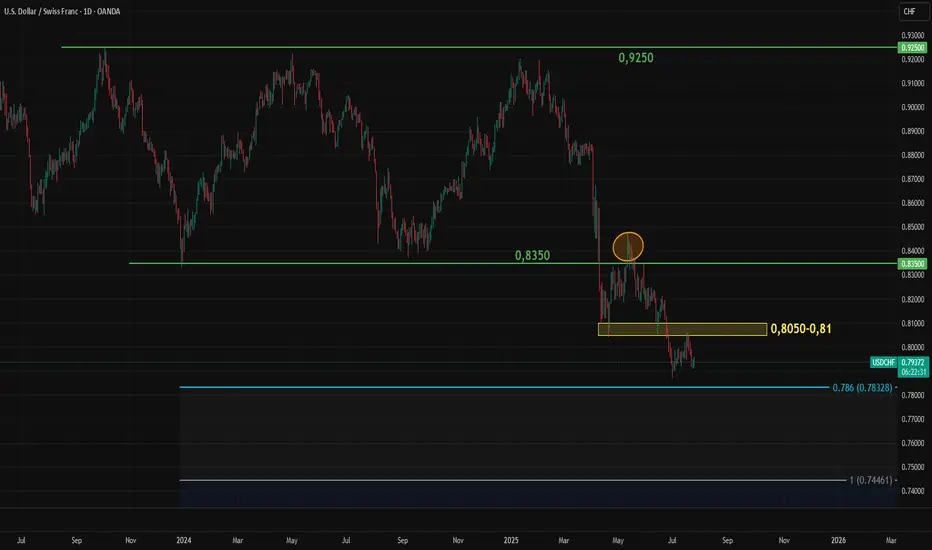
Key Levels to Watch for USDCHFAfter losing the key 0.8350 level, USDCHF attempted a re-entry but failed to hold above it. The pair is now under renewed pressure, with the price falling below 0.80.
The Swiss franc remains strong against most currencies due to solid fundamentals. USDCHF's next possible targets are 0.7830 and 0.7460, both based on Fibonacci expansion levels.
For CHF bears, the key zone to watch is between 0.8050 and 0.8100. A recovery into this zone could serve as an early signal of potential upward movement in USDCHF. However, the critical level remains at 0.8350.

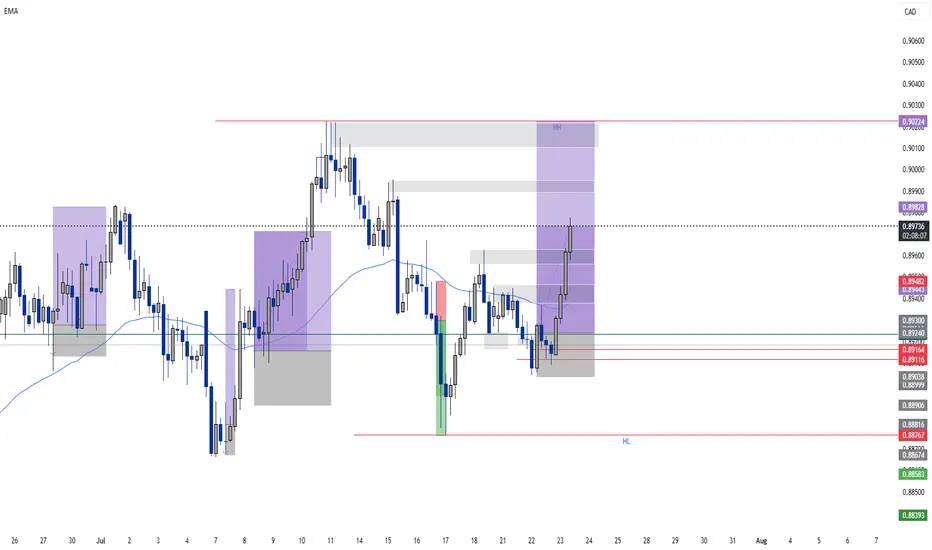
AUDCAD Bullish Setup – 15min Structure Shift1. Price was trading at a discount in the context of a higher time frame bullish trend (HHs and HLs).
2. On the 15-minute chart, price attempted to break a previous lower low but failed — signaling potential exhaustion in bearish pressure.
3. This failure to break structure on the 15 min suggested sell-side liquidity was absorbed, and smart money shifted direction.
4. Price then broke short-term 15-minute structure to the upside, indicating a bullish order flow shift.
5. A bullish retracement followed into an OB, offering a high-probability entry point before continuing higher.
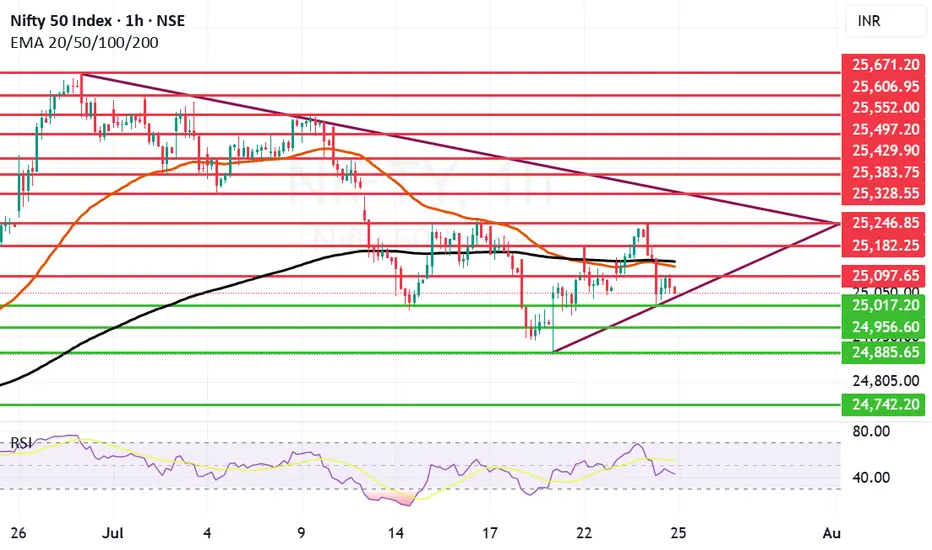
Nifty falls again as it can not sustain above 25240 level. Nifty again has shown some weakness as it was not able to sustain levels above 25240. The fall was lead by IT index which ended with deep cuts and fell 2.12% the other indices that saw fall were FMCG, Realty and Small Cap index. Trump's stance against Tech companies hiring from India and the deadlock in the trade deal also contributed to fall today. Index fell 157.8 points today and ended below both Mother and line on hourly chart. In the daily chart the candle we saw today was a bearish engulfing candle so further weakness can not be ruled out. The 2 major supports for nifty remain at 25017 and 24956 if these two supports are broken we may see Nifty falling towards 24885 or even 24742. Resistances for Nifty remain at 25097, 25138, 25182 and 25246. Only after we get a closing above 25246 we can see Nifty rally upwards.
Disclaimer: The above information is provided for educational purpose, analysis and paper trading only. Please don't treat this as a buy or sell recommendation for the stock or index. The Techno-Funda analysis is based on data that is more than 3 months old. Supports and Resistances are determined by historic past peaks and Valley in the chart. Many other indicators and patterns like EMA, RSI, MACD, Volumes, Fibonacci, parallel channel etc. use historic data which is 3 months or older cyclical points. There is no guarantee they will work in future as markets are highly volatile and swings in prices are also due to macro and micro factors based on actions taken by the company as well as region and global events. Equity investment is subject to risks. I or my clients or family members might have positions in the stocks that we mention in our educational posts. We will not be responsible for any Profit or loss that may occur due to any financial decision taken based on any data provided in this message. Do consult your investment advisor before taking any financial decisions. Stop losses should be an important part of any investment in equity.
HolderStat┆ADAUSD broke through the resistanceBINANCE:ADAUSDT is trading just below $0.406 after bouncing from $0.386. The setup favors a breakout if resistance is breached. Price structure remains bullish while above $0.386.

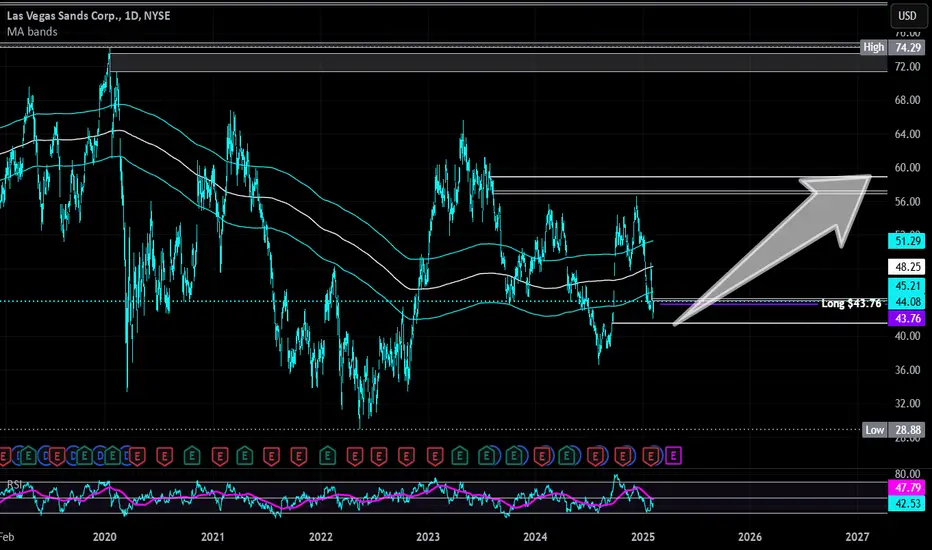
Las Vegas Sands | LVS | Long at $43.76Pros:
Earnings are forecast to grow 13.29% per year
Earnings grew by 18.4% over the past year
2.3% dividend yield
Cons:
Insider selling and exercising of options
Debt-to-equity ratio of 3.8x
Small price gap on the daily chart near $41 that may close prior to a move up.
If people can't buy houses, they will travel... thus, at $43.76, Las Vegas Sands NYSE:LVS is in a personal buy zone.
Targets
$50.00
$57.00
$59.00
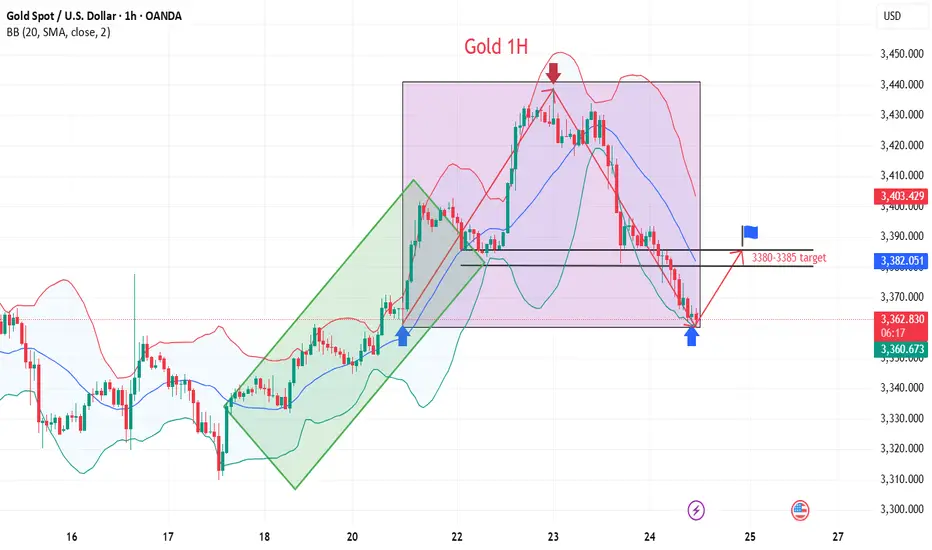
Gold failed to break through three times, short-term bearish?
💡Message Strategy
Gold's decline today means the second consecutive day of decline as investors turn their attention to more positive trade developments since yesterday.
However, gold still received buying support earlier this week and briefly broke through $3,400. This round of gains tested key resistance levels on the gold daily chart, but ultimately the bears held their ground.
This is the third time in nearly three months that gold has tried to break through the $3,430 to $3,435 resistance area, but all failed.
📊Technical aspects
Gold’s latest decline this week has brought the price back into a range-bound trading state between key hourly moving averages. This means that the short-term trend has become more neutral.
This shows that the upward momentum has clearly weakened and buyers need to regain short-term dominance before they can hope to challenge the key resistance area mentioned earlier again.
Currently, the 200 hourly moving average near $3,365 provides support to the downside. If the price can hold this level, it will indicate that buyers are still holding on and waiting for the next upside opportunity.
Combined with the current 1H chart trend analysis, there is still a great chance of a bullish pullback in gold in the short term.
💰Strategy Package
Long Position:3360-3365,SL:3340,Target: 3380-3400
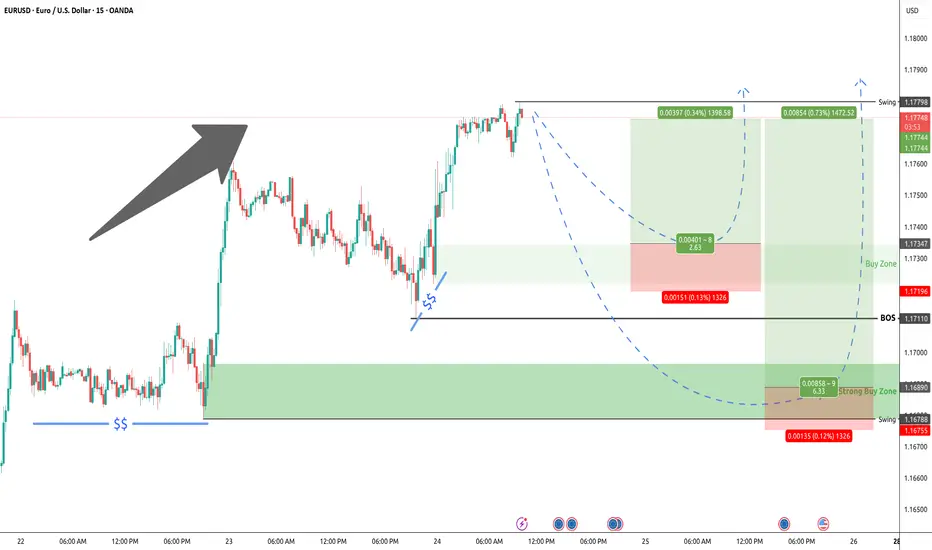
EURUSD 60/15 Pullback LongOverall strong up trend. Now under consolidate phase, then pullback, looking for long.
Possible buy zones are marked, monitor when reaching buy zones.
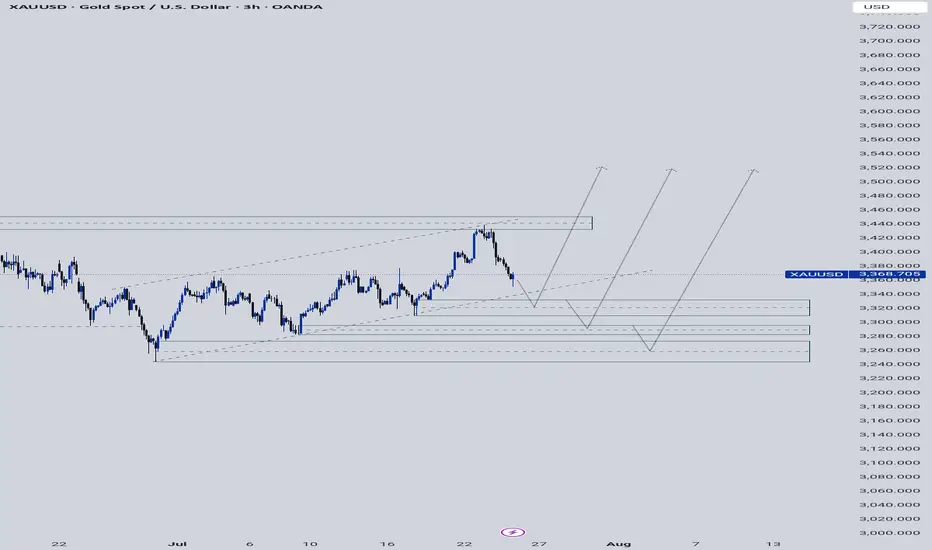
XAUUSDA little insight as to what to look out for on Gold as it finds areas to bounce from so it continues it's initial bullish momentum.
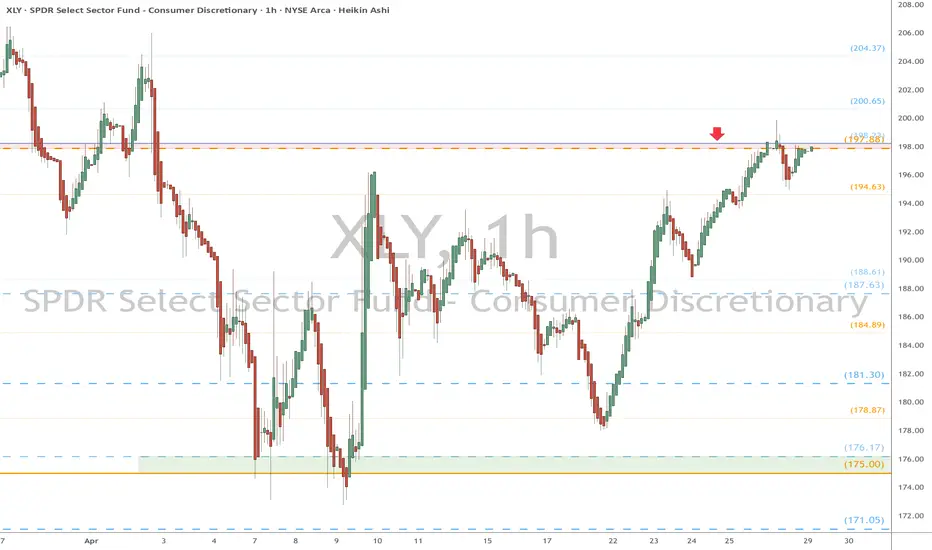
XLY eyes on $198: Major resistance zone for recovery wave XLYXLY is a key etf/index to evaluate tariff sentiment.
Currently fighting a major resistance $197.88-193.23
Look for a Break-and-Run or Reject hard from here.
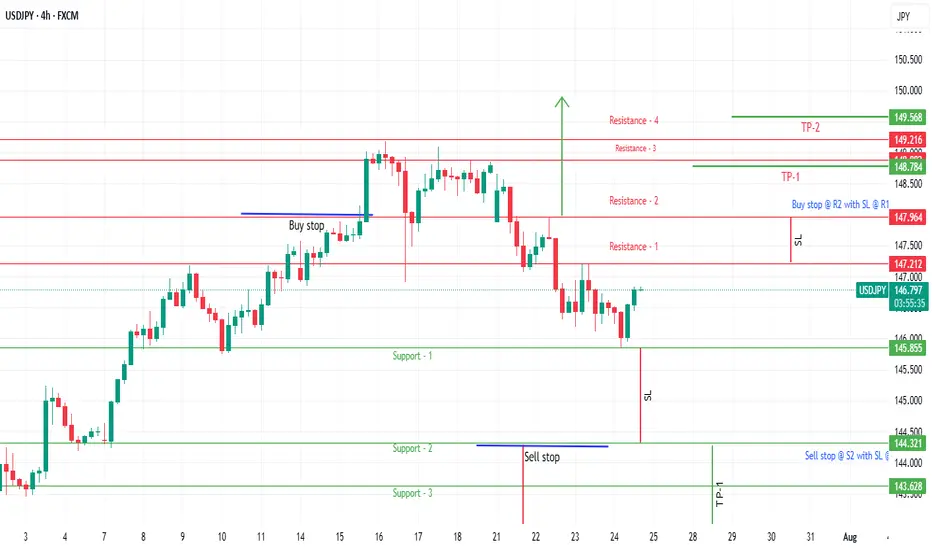
USDJPY range-bound trade- Trade is based on potential breakout on either side as range bound markets are there to be broken
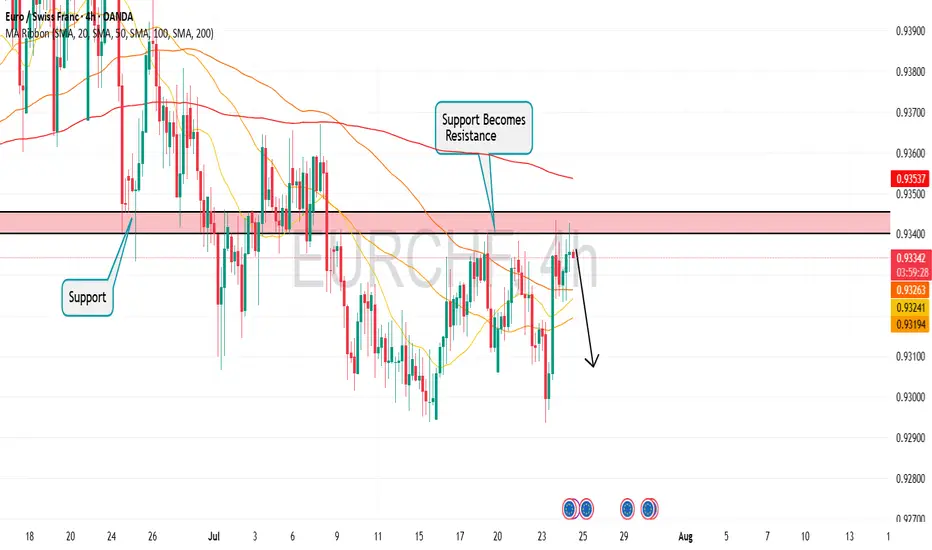
EURCHF Is in The Selling Direction Hello Traders
In This Chart EURCHF HOURLY Forex Forecast By FOREX PLANET
today EURCHF analysis 👆
🟢This Chart includes_ (EURCHF market update)
🟢What is The Next Opportunity on EURCHF Market
🟢how to Enter to the Valid Entry With Assurance Profit
This CHART is For Trader's that Want to Improve Their Technical Analysis Skills and Their Trading By Understanding How To Analyze The Market Using Multiple Timeframes and Understanding The Bigger Picture on the Charts
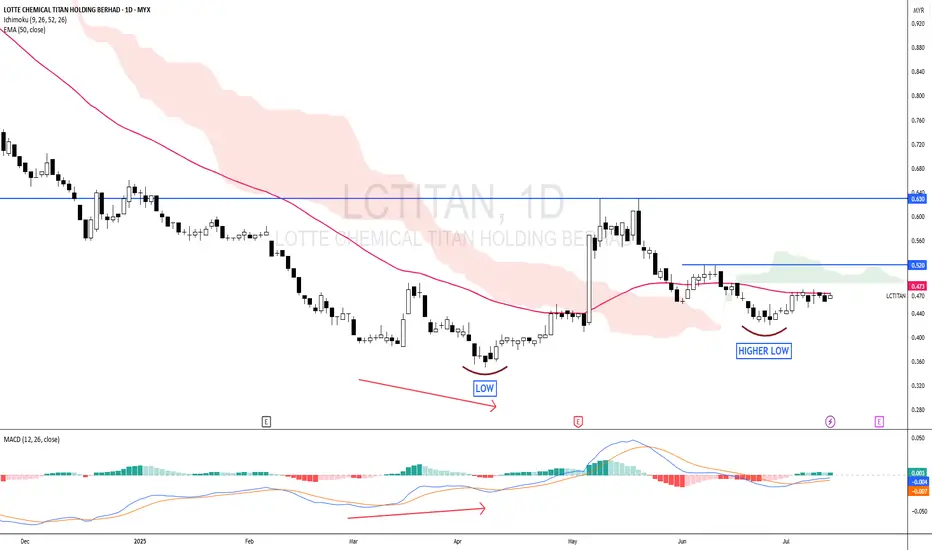
LCTITAN - The LOW is getting HIGHER !LCTITAN - CURRENT PRICE : RM0.470
The stock made a HIGHER LOW recently - this may consider as a half portion of new uptrend is completed. A breakout above RM0.630 will form the higher high structure - which confirm the new uptrend phase.
For short term trading purposes, short term traders may anticipate to buy if the stock breakout nearest resistance of RM0.520 - which will give an entry point at RM0.525. So this is a pending breakout stock. Nearest target will be RM0.580 and RM0.620. Take note that when the price breakout RM0.520 , it will also be above EMA 50 and ICHIMOKU CLOUD - which strengthening the bullish outlook.
ENTRY PRICE : RM0.525
TARGET : RM0.580 and RM0.620
SUPPORT : EMA 50
Notes : The higher low structure of LCTITAN looks like DRBHCOM - I share the link here for reading purposes.