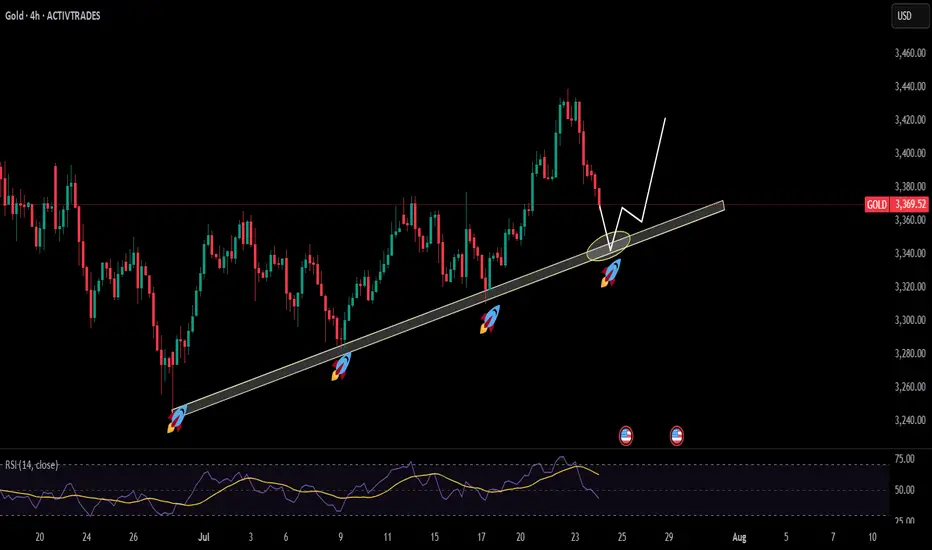
Gold Correction Went Deeper, but the Bullish Structure Intact📌 Quick recap from yesterday:
In my previous analysis, I mentioned that I was looking to buy dips around 3400, expecting a continuation move toward the ATH near 3500.
That was the plan.
But as the day unfolded, I removed my pending buy order — and explained exactly why in an educational post on how context can override entry levels.
If you read that, you already understand:
It’s not where price goes. It’s how it gets there.
________________________________________
📉 So… where are we now?
The big question is:
Was this just a deeper correction, or is Gold preparing to shift direction entirely?
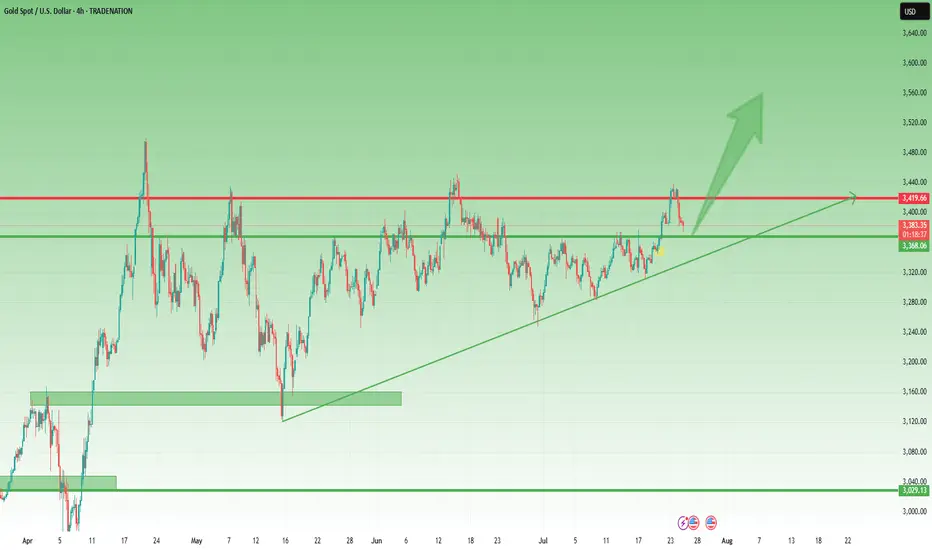
In my opinion, we’re still in a healthy correction, not a reversal.
Why?
• Price remains above the horizontal support — the same level that acted as resistance last week
• The market is still above the trendline from mid-May
• No breakdown, no major structure violation — just deeper retracement after a sharp impulsive move
________________________________________
📈 What’s the plan going forward?
As long as these two supports hold, I believe the buy-the-dip narrative remains valid — even at better prices.
In fact, I already entered a new long position about an hour ago, which is currently up around 90 pips at the time of writing.
My bias stays bullish unless proven otherwise.
________________________________________
📌 Conclusion:
Yes, the correction went deeper than expected.
Yes, I removed a pending order — because the reaction was not what I wanted to see.
But structure still supports continuation, and I remain in the buy-the-dip camp as long as key support holds. 🚀
Disclosure: I am part of TradeNation's Influencer program and receive a monthly fee for using their TradingView charts in my analyses and educational articles.
Support and Resistance
Building a Future for RWAs and Multichain DeFi: A Strategic OutlThe intersection of real-world assets (RWAs) and decentralized finance (DeFi) has become one of the most transformative trends in the blockchain space. As traditional financial institutions explore blockchain integration, and DeFi continues to mature, tokenized RWAs—like real estate, bonds, and commodities—are poised to redefine the global financial landscape. Combined with multichain interoperability, this evolution promises greater efficiency, transparency, and accessibility.
The Rise of Real-World Assets on Blockchain
Tokenization is the process of converting rights to an asset into a digital token on a blockchain. For RWAs, this means that tangible assets—such as property, equities, or art—can be fractionalized and traded globally in real-time. This unlocks liquidity in previously illiquid markets, enables 24/7 trading, and reduces administrative overhead.
Use cases are rapidly emerging: real estate funds issuing tokenized shares; commodities like gold being represented on-chain; and even government bonds available on DeFi platforms. These developments democratize access to assets once limited to high-net-worth individuals and institutions.
However, integrating RWAs into DeFi isn't just a technical feat. It requires robust legal frameworks, clear custodianship, and standardized processes for valuation and dispute resolution. Without proper infrastructure, tokenized RWAs risk becoming speculative rather than transformative.
The Role of Multichain Ecosystems
No single blockchain can accommodate the entire spectrum of financial use cases. Multichain architecture—where assets and applications span multiple blockchains—is essential to scale RWA integration effectively.
Cross-chain interoperability enables users to leverage different blockchains for what they do best. Ethereum offers deep liquidity and composability. Algorand and Avalanche deliver scalability and low fees. Polkadot and Cosmos focus on seamless interoperability. Bridging these ecosystems creates a holistic, resilient financial infrastructure.
Protocols like Wormhole, LayerZero, and Chainlink’s CCIP are leading the charge in enabling these connections. By ensuring assets can move securely and efficiently across chains, they support a unified liquidity layer that benefits both RWA issuers and investors.
Challenges and Opportunities
Despite the promise, several hurdles remain. Regulatory compliance is fragmented across jurisdictions, making it difficult for global RWA platforms to operate consistently. Many DeFi protocols are not yet equipped to handle the complexities of asset custody, identity verification, or investor rights enforcement.
Moreover, education is a significant barrier. Institutional investors and retail users alike must understand the risks and mechanisms of DeFi to participate confidently. Projects that prioritize transparency, usability, and regulatory alignment are more likely to gain mainstream adoption.
The opportunity, however, is vast. RWAs could unlock trillions in idle capital, while multichain frameworks reduce friction in global capital markets. Combined, they offer a future where financial products are borderless, inclusive, and programmable.
Conclusion
The convergence of RWAs and multichain DeFi represents a critical shift in finance—from centralized gatekeeping to decentralized participation. It has the potential to create a more accessible and efficient global financial system. While challenges persist, technological advances and increasing institutional interest suggest that this transformation is not only possible, but inevitable. The next few years will be pivotal in shaping the architecture, governance, and standards of this emerging ecosystem.
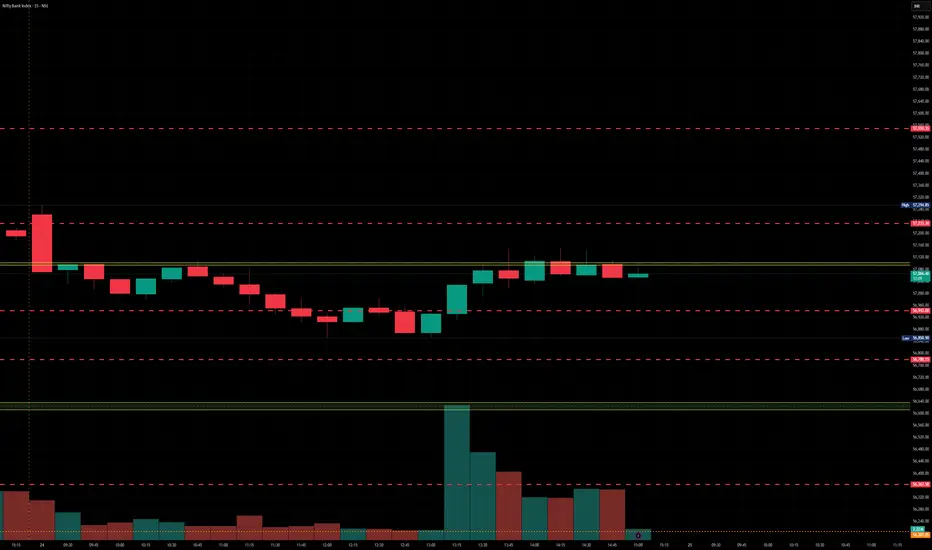
Banknifty levels - Jul 25, 2025Utilizing the support and resistance levels of BankNifty, along with the 5-minute timeframe candlesticks and VWAP, can enhance the precision of trade entries and exits on or near these levels. It is crucial to recognize that these levels are not static, and they undergo alterations as market dynamics evolve.
The dashed lines on the chart indicate the reaction levels, serving as additional points of significance. Furthermore, take note of the response at the levels of the High, Low, and Close values from the day prior.
We trust that this information proves valuable to you.
* If you found the idea appealing, kindly tap the Boost icon located below the chart. We encourage you to share your thoughts and comments regarding it.
Wishing you successful trading endeavors!
ETHUSD, XRPUSD - BEARISH DIVERGENCE SUCCESSFULLY WORKED OUT
ETHUSD, XRPUSD - BEARISH DIVERGENCE SUCCESSFULLY WORKED OUT
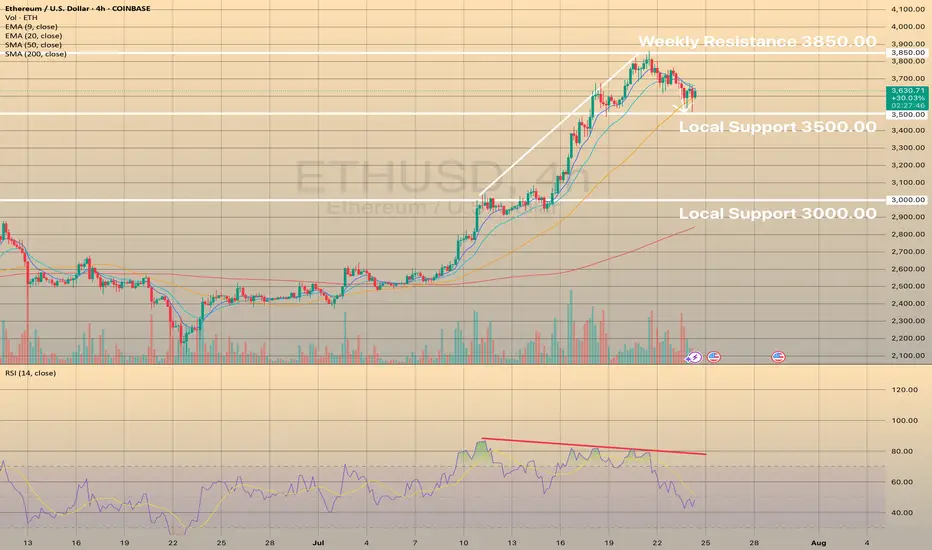
On these 2 graphs you may observe ethereum and ripple declining after strong bearish divergence showed up on both of these instruments. Here, the bearish divergence proved to be a success. In both cases the price has almost reached first targets: 3,500.00 for ETHUSD and 3.00000 for XRPUSD.
What will be next?
It looks like downwards correction still persists and we may observe some deeper than now decline with possible targets of 3,000.00 for the ETHUSD and 2.60000 for the XRPUSD.
Nifty levels - July 25, 2025Nifty support and resistance levels are valuable tools for making informed trading decisions, specifically when combined with the analysis of 5-minute timeframe candlesticks and VWAP. By closely monitoring these levels and observing the price movements within this timeframe, traders can enhance the accuracy of their entry and exit points. It is important to bear in mind that support and resistance levels are not fixed, and they can change over time as market conditions evolve.
The dashed lines on the chart indicate the reaction levels, serving as additional points of significance to consider. Furthermore, take note of the response at the levels of the High, Low, and Close values from the day prior.
We hope you find this information beneficial in your trading endeavors.
* If you found the idea appealing, kindly tap the Boost icon located below the chart. We encourage you to share your thoughts and comments regarding it.
Wishing you success in your trading activities!

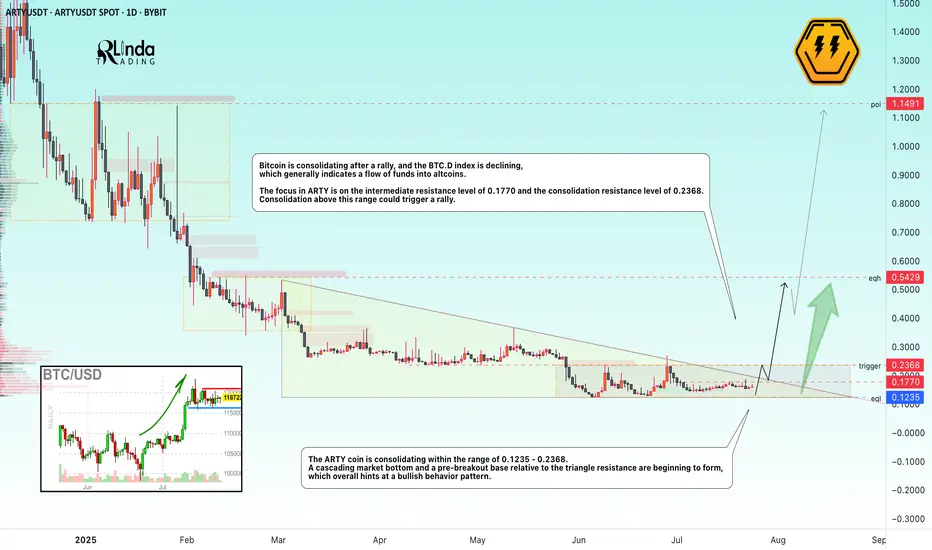
ARTYUSDT → A breakout of resistance could trigger another rallyBYBIT:ARTYUSDT is forming a cascading bottom as part of consolidation before a possible breakout of resistance. The decline in Bitcoin's market dominance gives altcoins a chance.
( (Idea from September 29, 2024!) We previously discussed this coin before its 300% rally. The root causes of its emergence from accumulation and readiness for strong growth were correctly identified).
The dump phase is coming to an end, a cascading market bottom is beginning to form, and a pre-breakout base relative to the triangle resistance is forming, which overall hints at a bullish behavior pattern.
Bitcoin is currently consolidating after the rally, and the Bitcoin dominance index is declining, which generally indicates a flow of funds into altcoins. The situation is such that the altcoin market has another chance for the season. The correction across the entire market may end in the near future, and under favorable conditions (the fundamental background is strengthening, Trump has announced another important event for cryptocurrencies), the market may return to strong movements...
The focus in ARTY is on the intermediate resistance at 0.1770 and the consolidation resistance at 0.2368. Consolidation above this range could trigger a rally.
Resistance levels: 0.2368
Support levels: 0.1235
Technically, a few days ago, the coin tested the consolidation resistance, but the decline did not continue, which generally indicates that buyers are showing interest and holding the market. Consolidation in the near term may end with a retest of 0.1770, 0.2368, a breakout, and further growth.
Best regards, R. Linda!
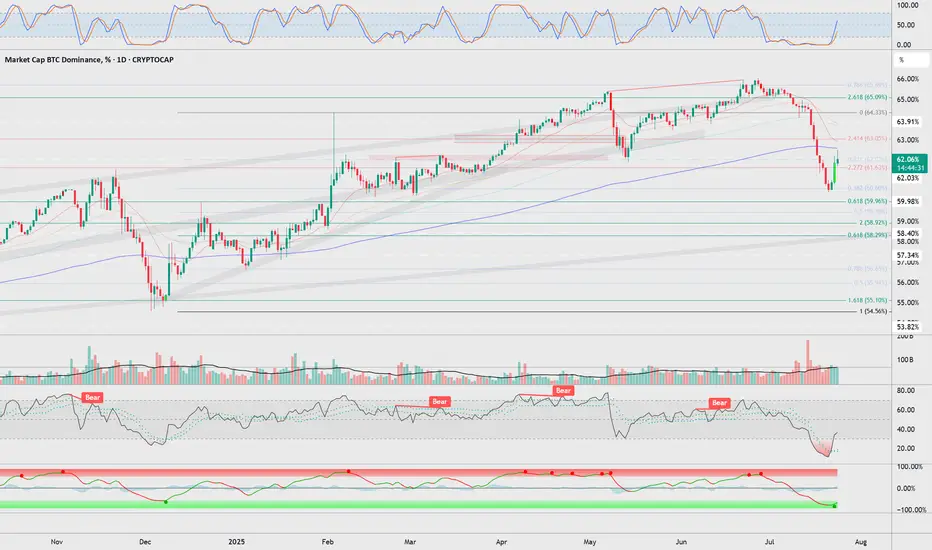
BTC.D% my notes for short termstrong resistances are %62 and %63.
below %59,8 - %58 is most important for altcoin season to start
not financial advices, my notes for myself
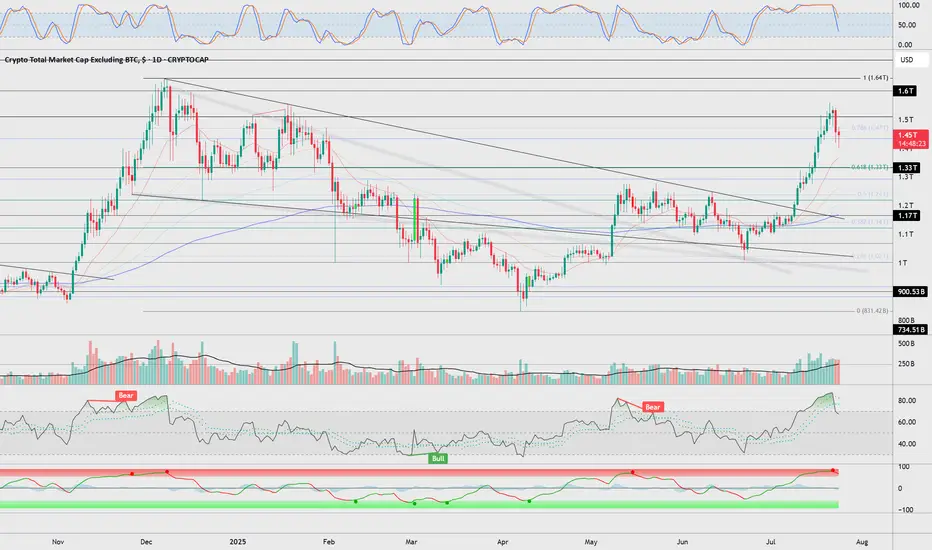
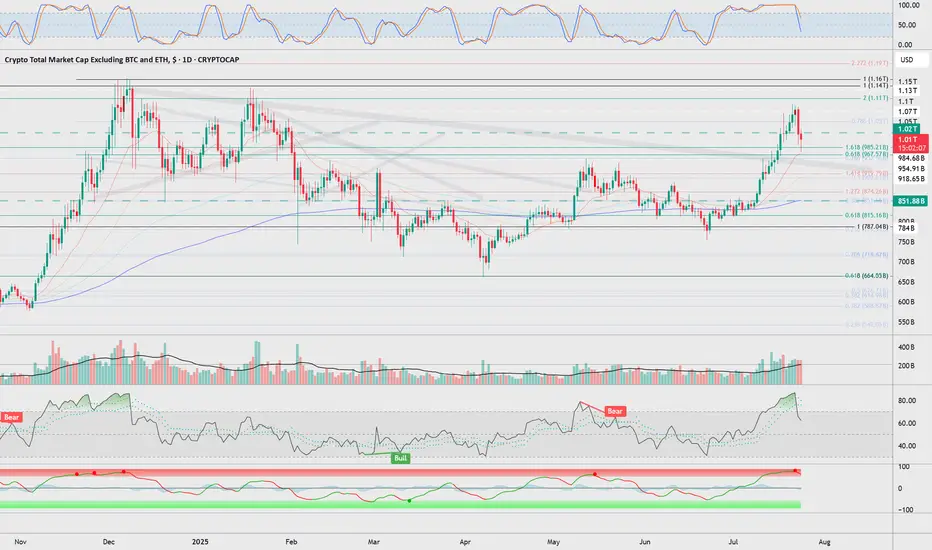
Total2 my notes for short termwaiting for a correction from 1,3T zone
not financial advices, my notes for myself
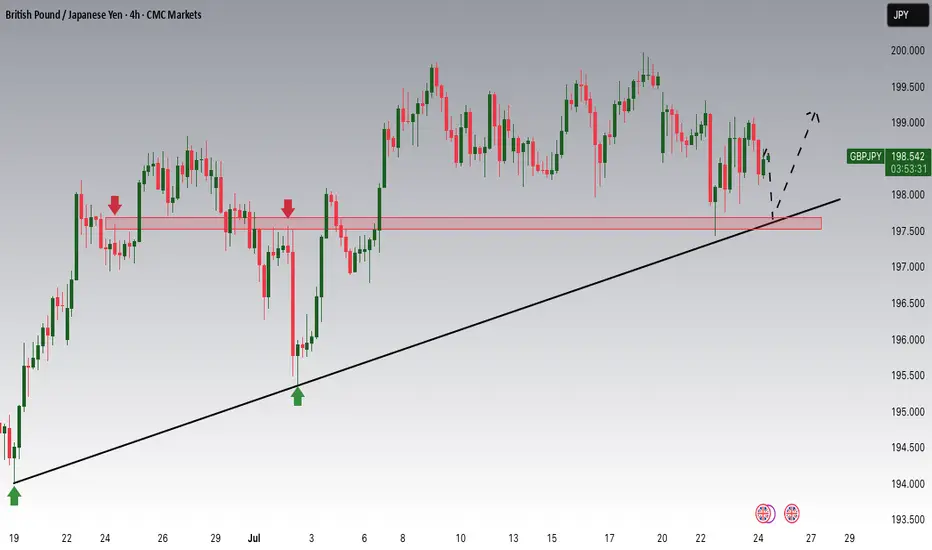
GBPJPY Potential UpsidesHey Traders, in today's trading session we are monitoring GBPJPY for a buying opportunity around 197.700 zone, GBPJPY is trading in an uptrend and currently is in a correction phase in which it is approaching the trend at 197.700 support and resistance area.
Trade safe, Joe.
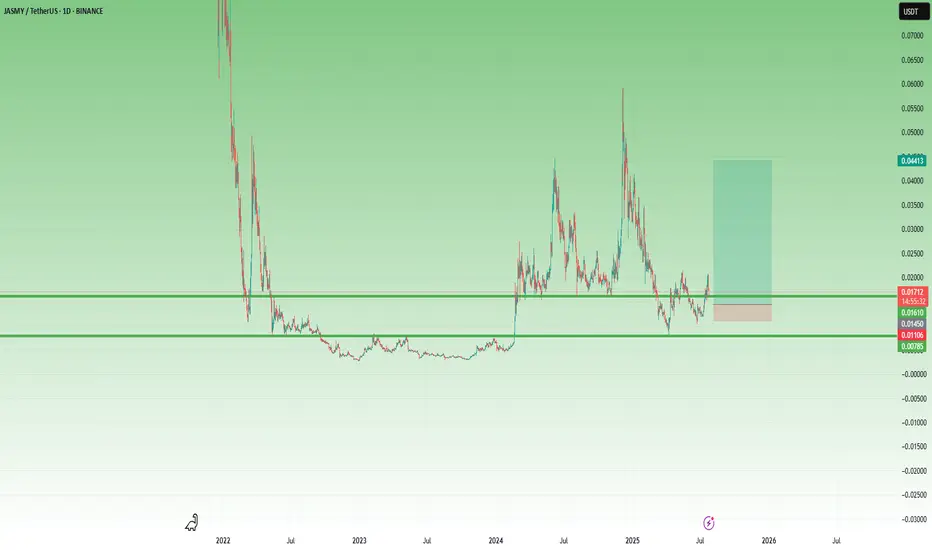
JASMY – A Volatile Setup with x3 Potential 🔸 After bottoming out at 0.003 and spending over a year in accumulation, JASMY finally broke above the key 0.008 resistance zone in February 2024. That breakout triggered a series of explosive moves – but just as violent were the drops that followed.
🔸 What stands out:
• The first post-breakout spike found a new support at 0.015.
• Then came a second vertical move toward 0.06, followed (of course) by a brutal drop.
• But… 0.008 held, and by late June, the chart printed a higher low, showing that buyers became interested.
📍 Right now, the price has reclaimed the 0.015 zone and is trying to stabilize above it. If this level holds, it could become the new base for the next wave.
💡 My plan?
This is very speculative, but I like the setup.
I’m looking to buy around 0.015–0.016, with clear negation below 0.010.
Target? Around 0.045, for a potential x3 move and a tasty 1:8 risk/reward.
⚠️ I’m not the guy who repeats the cliché “ only trade what you can afford to lose, ”
but seriously – this one is for clubbing money, not summer vacation money.
Let the volatility work in our favor. 🚀
Total3 - short term noteslooks like 920 or 970B should be a turning point if it is a correction in the following times.
not financial advices, my notes for myself
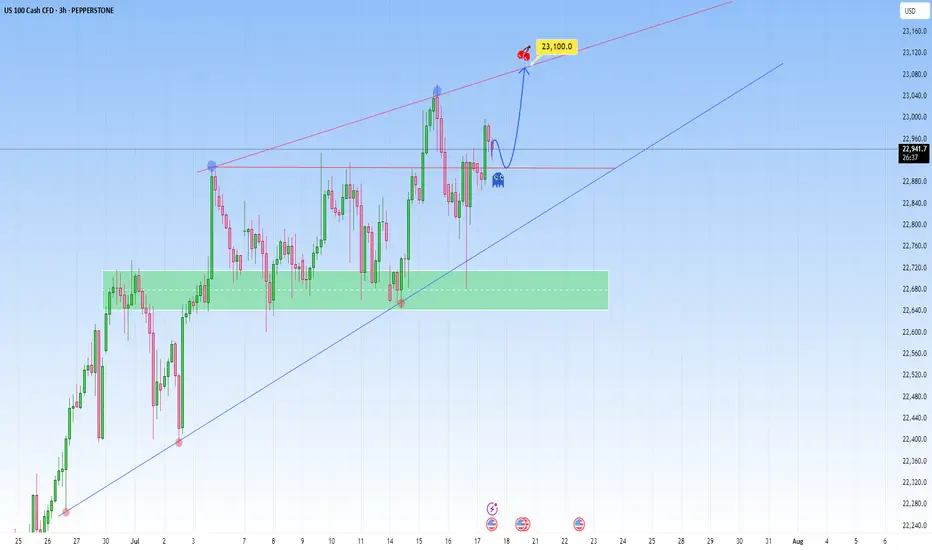
NAS100 Bigger Picture. Uptrend to be resumedLooking at the current structure through the lens of a trend trading approach, what we saw on NAS100 is more than a simple price bounce, it’s a trend continuation trading within a high-volatility environment. As price is approaching a key resistance level, how price is behaving around this dynamic trendline will be key.
This recent retracement and rejection happening near what we can call a demand zone cluster, was confirmed by a beautiful bounce off the support range. And right now price is respecting the upper and lower bounds nicely.
What happens next? Price is showing signs of bullish exhaustion, but the higher-timeframe structure supports a continuation.
My projected target is towards the upper resistance line, that’s my 23,100 zone as shown.
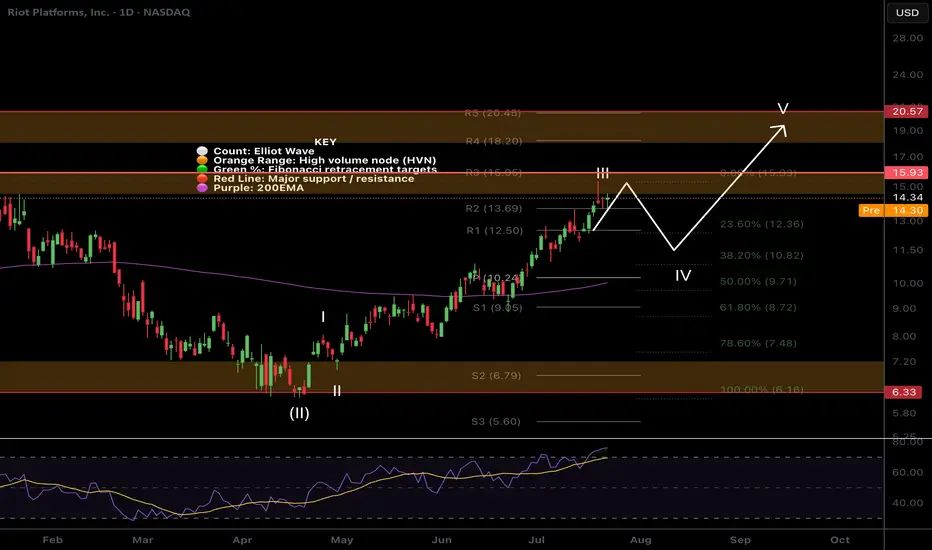
$RIOT Targets hitNASDAQ:RIOT has hit my take profit target at the High Volume Node and R3 daily pivot where it has found resistance.
Wave III appears to be complete with wave IV expected targets being the 0.382-0.5 Fibonacci retracement, also the daily pivot point and ascending daily 200EMA, $10.24.
Analysis is invalidated if we continue to the upside with a new swing high. RSI is overbought no bearish divergence.
Safe trading
DeGRAM | GBPUSD reached the resistance level📊 Technical Analysis
● Price rejected the rising-channel base at 1.3434 (green arrows) and has broken the eight-day corrective down-trend, restoring the series of higher-lows.
● A new impulse is aiming at the mid-June swing/ channel crest 1.3592; a measured move from the breakout projects the upper rail near 1.3773. Pull-backs toward 1.3500-1.3520 should attract bids while the inner up-sloper holds.
💡 Fundamental Analysis
● Softer US PMI prices pulled 2-yr Treasury yields off highs, trimming USD support, while UK retail-sales surprise (+0.7 % m/m) tempered BoE-cut bets, underpinning sterling.
✨ Summary
Long 1.3500-1.3520; hold above 1.3592 targets 1.3770. Invalidate on a 4 h close below 1.3434.
-------------------
Share your opinion in the comments and support the idea with a like. Thanks for your support!

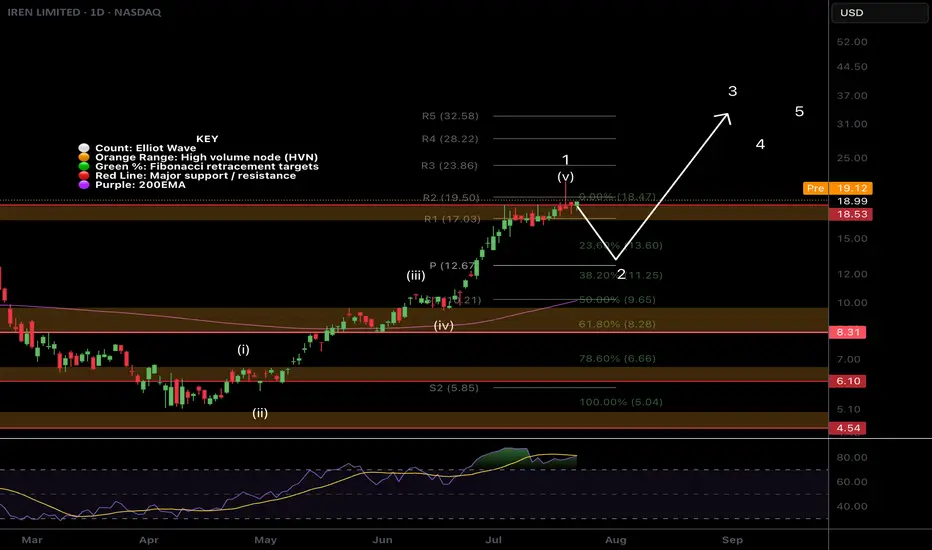
$IREN More downside after huge rally!NASDAQ:IREN is printing bearish divergence on the daily RSI at all tie high resistance.
An Elliot wave motif wave appears complete and wave looks underway with a shallow target of the daily pivot, 0.382 Fibonacci retracement and ascending daily 200EMA.
The daily red wick after printing a 20% start to the day is reminiscent of a blow off top in this asset trapping newbs with FOMO price discovery pump. Market behaviour in action!
Analysis is invalidated if price returns to all time high.
Safe trading
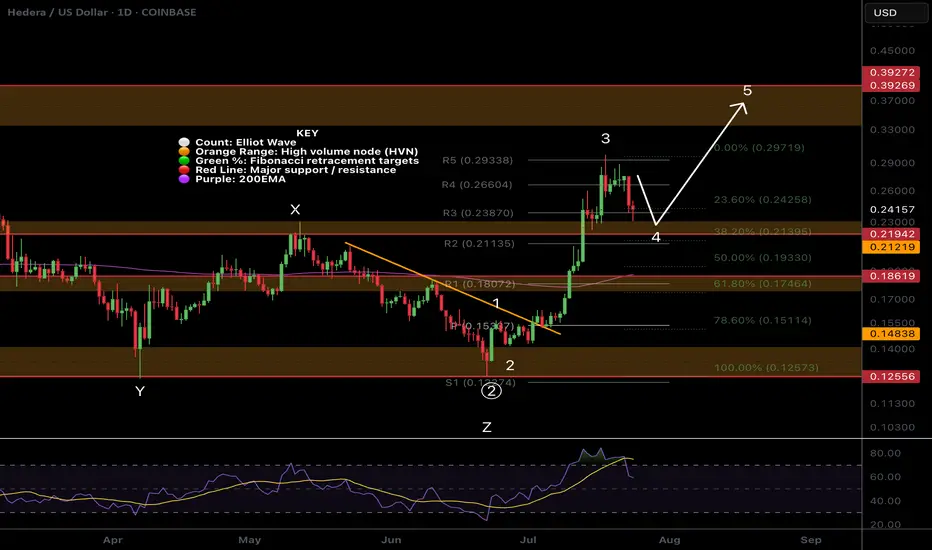
$HBAR Wave 4 finishing soon?CRYPTOCAP:HBAR Hedera appears to have completed wave 4 with the test of the High Volume Node support at the 0.382 Fibonacci retracement.
Wave 5 has an expected target of the High Volume Node resistance at $0.4 before a larger retracement in wave 2 aligning with my summer pump august / September dump view.
Analysis is invalidated below $0.1933 at the 0.5 Fib retracement and will be updated to a wave 2 instead of 4.
Safe trading
ETH my notes for short termwaiting for a short time correction time. supports: 3500 - 3300 - 3050. then new ath process till october
not financial advices, notes for myself
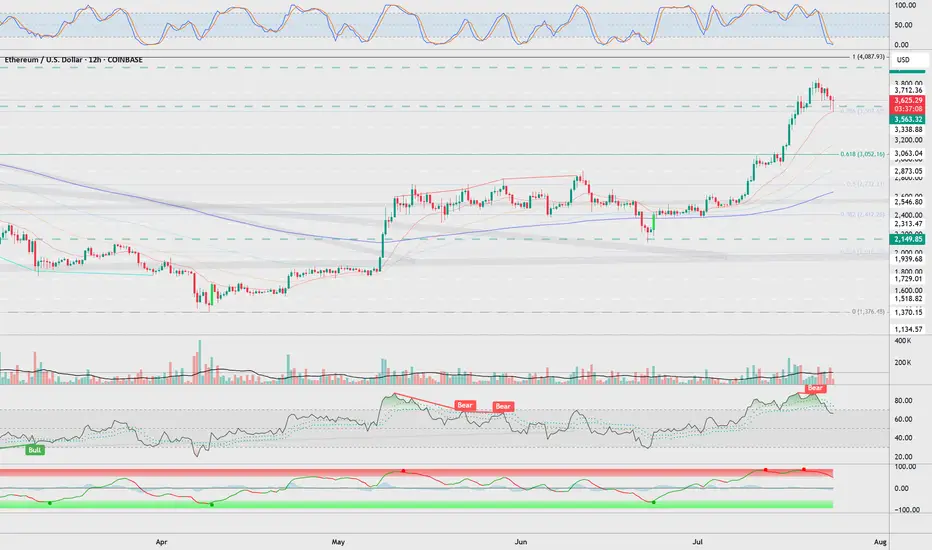
$ETH Hit Our Targets and was rejectedCRYPTOCAP:ETH hit our signal take profit target at $3820 and was rejected at the High Volume Node EQ to the penny.
That appears to have completed wave 3 of this motif wave. Wave 4 has an expected target of the R2 daily pivot and 0.236-0.382 Fibonacci retracement, $3260 before continuing to the upside in wave 5 with a target of the all time high.
This aligns with my views of a significant pullback at the end of August and September which is typical after a summer rally.
No divergences yet in daily RSI.
Safe trading

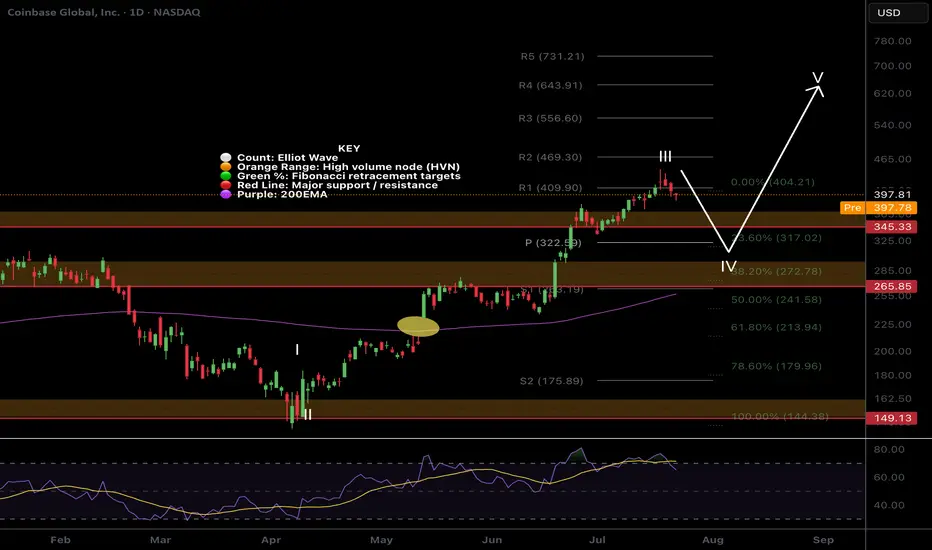
$COIN Wave 4 pullback?NASDAQ:COIN had a tremendous run, a text book Elliot wave 3 but has confirmed bearish divergence on the daily RSI.
The trend is strong so wave 4 could be shallow, only reaching the previous all time high, High Volume Node and 0.236 Fibonacci retracement and daily pivot point between $322-345
Further decline brings up the High Volume Node support at 0.382 Fib retracement and ascending daily 200EMA! Also a highly probable scenario!
Long term outlook remains around $600 target
Safe trading.
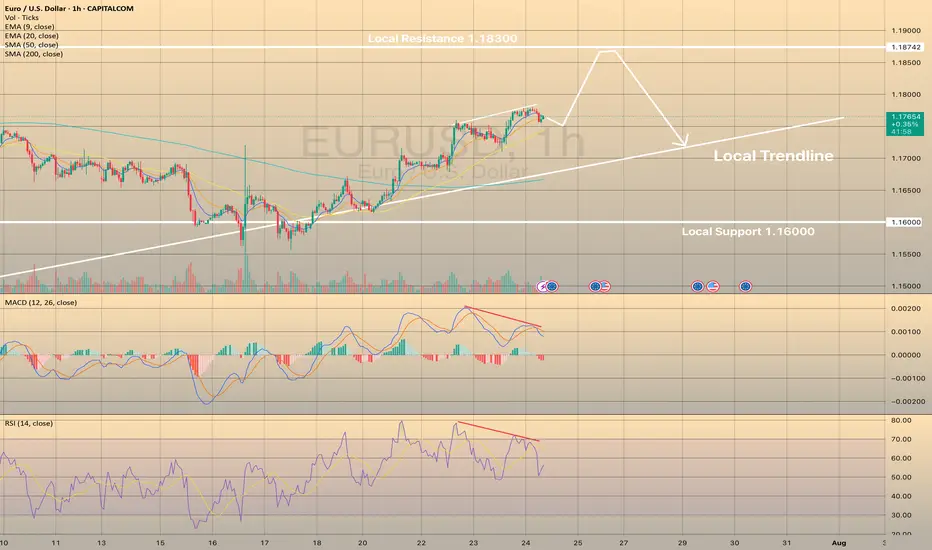
EURUSD IS ON ITS WAY TO LOCAL HIGHSEURUSD IS ON ITS WAY TO LOCAL HIGHS
EURUSD successfully rebounded from local support of 1.16000 and since then continues to rise towards local resistance of 1.18300. Recently the price has started to show the bearish divergence on RSI and Macd indicators. MACD went into the red zone.
What is the bearish divergence?
Bearish divergence is a technical analysis pattern where the price makes higher highs in an uptrend, but a momentum indicator (e.g., RSI, MACD) forms lower highs, signaling weakening bullish momentum and a potential downward reversal. To trade, identify the divergence in a clear uptrend with the indicator showing lower highs (e.g., RSI above 70). Sell or short when the price confirms a reversal (e.g., breaks below a support level or trendline) with increased volume. Set a stop-loss above the recent high. Target the next support level.
Generally speaking, it doesn't necessarily mean that EURUSD will drop immediately, the price may even grow a bit. However, it highlights some short opportunities.
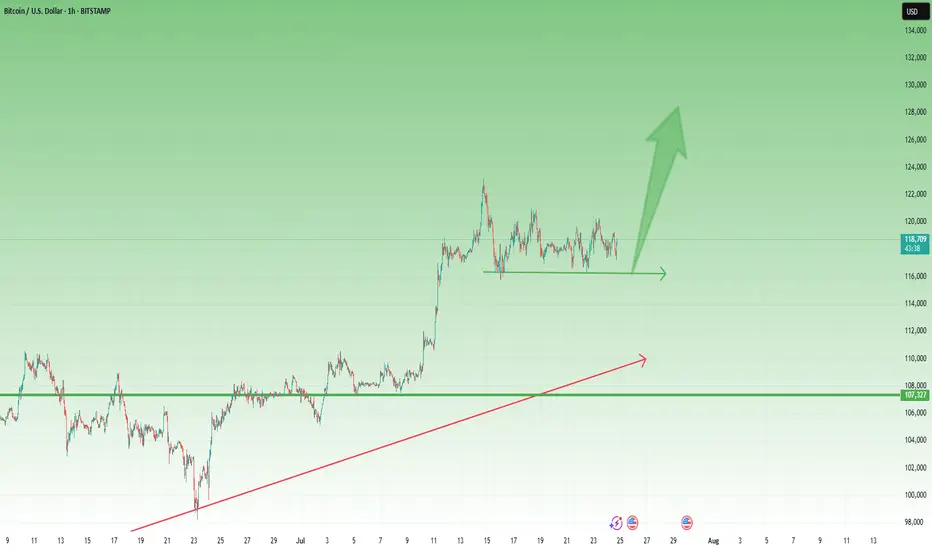
BTCUSD – Bulls Still in Control After New ATH 🔸 After the new All-Time High printed 10 days ago, Bitcoin entered a consolidation phase. So far, the market looks healthy and seems to be waiting for a trigger to continue the uptrend.
🔸 A clear support zone has formed around 116k, and as long as this level holds, bulls remain in full control of the market.
📉 For short-term traders and speculators:
Buying dips near 117.5k could offer solid risk/reward setups, with a target around 125k in case of a breakout.
Let’s see if the market gives us the trigger we’re waiting for. 🚀
Gold is coming at support leveldrawn trendline has been proven a major support level for gold as the price has tested it multiple times and get a decent bounce to make new highs currently price is again approaching the support level opportunity will be when price hit that level then look for buy setups on shorter tfs to get higher RR
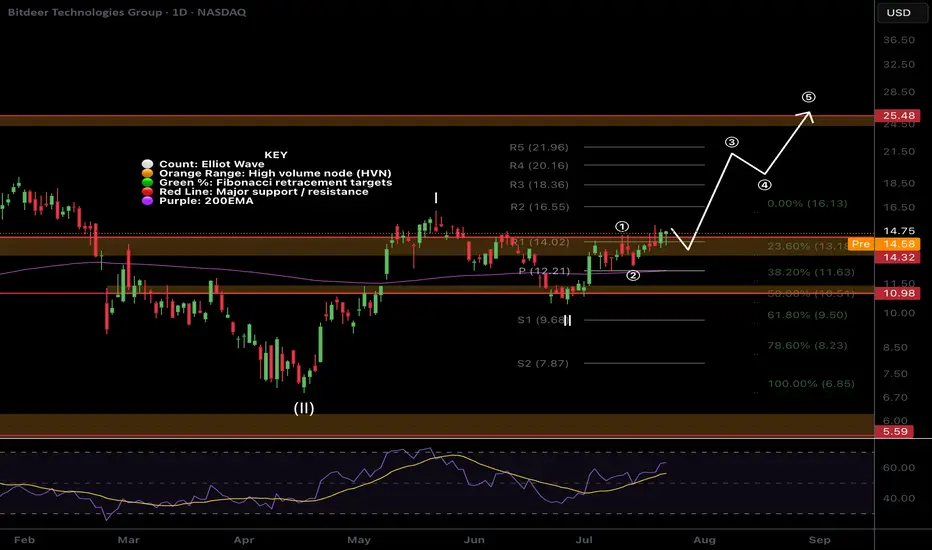
$BTDR Closed above resistance!NASDAQ:BTDR Bitdeer closed above major resistance yesterday, despite BTC and alt coins having a bearish day, triggering our long signal in the Weekly Trade signals substack.
I am looking for price to start to accelerate in wave 3 and resistance now support to hold. If BTC reverses it will add additional tailwinds with a target of the major resistance above the R5 daily pivot $24
Safe trading