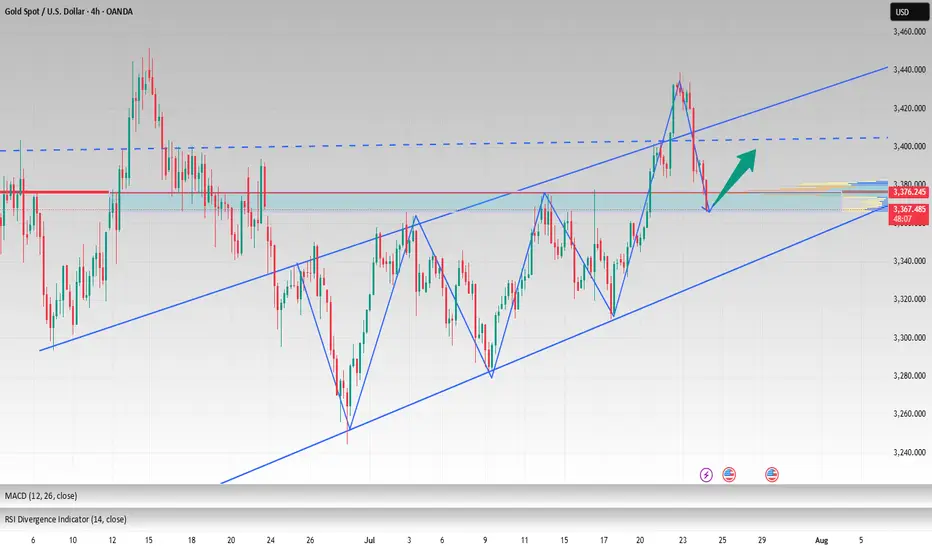
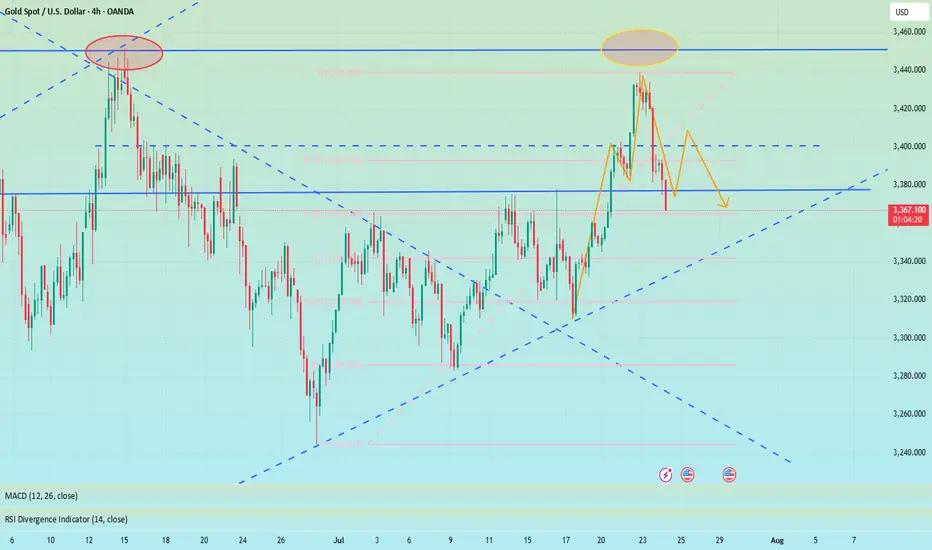
Correction is not bearish, buy on rebound at low levelToday is critical. Yesterday, gold fell under the pressure of 3396. The next 3396 area is very critical, and it will be relatively weak below it. If it goes up, the market rebound will expand. Pay attention to 3405 or 3420 area, with the focus on 3420. As long as it is below here, it will be mainly bearish. Breaking through 3420, the market is expected to continue to rise and break yesterday's high to test the 3450 area, and then seek to fall again. On the downside, pay proper attention to the 3380 area, which is short-term support; the focus is on the 3370~3365 area, which is the next bull-bear watershed.
The daily line fell yesterday and included the previous day's big positive rise, which represents the current high-level fluctuation of the price. At present, we need to pay attention to the lower moving average support corresponding to SMA10 at 3367, while the moving average SMA30 is around 3351-53, the middle track is at 3344, and the moving average SMA60 is at 3330.
From the daily level: today's decline will not fall below 3351-53, and it is likely to be around 3367-70. We have the opportunity to participate in long orders near 3370.
Therefore, if the price touches 3370-3365 for the first time during the day, you can consider going long, with the target at 3390-3400; if the downward trend of gold continues during the day, you can go long again at 3355-3353, defend 3345, and exit the market after earning a difference of $10-20.
OANDA:XAUUSD
Support and Resistance
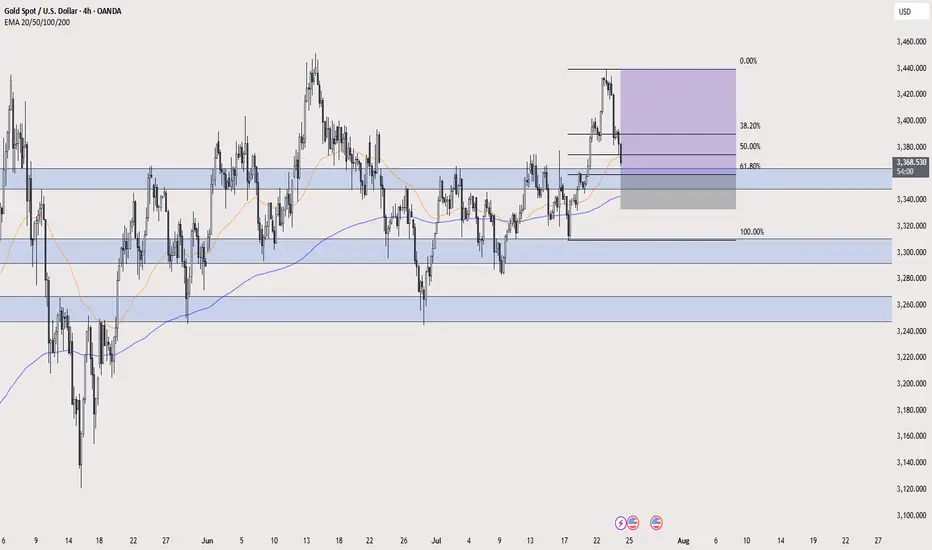
XAU/USD LONG XAU/USD LONG " break of a resistance area and retest it + 61.8% fib retracement + 50 ema dynamic support "
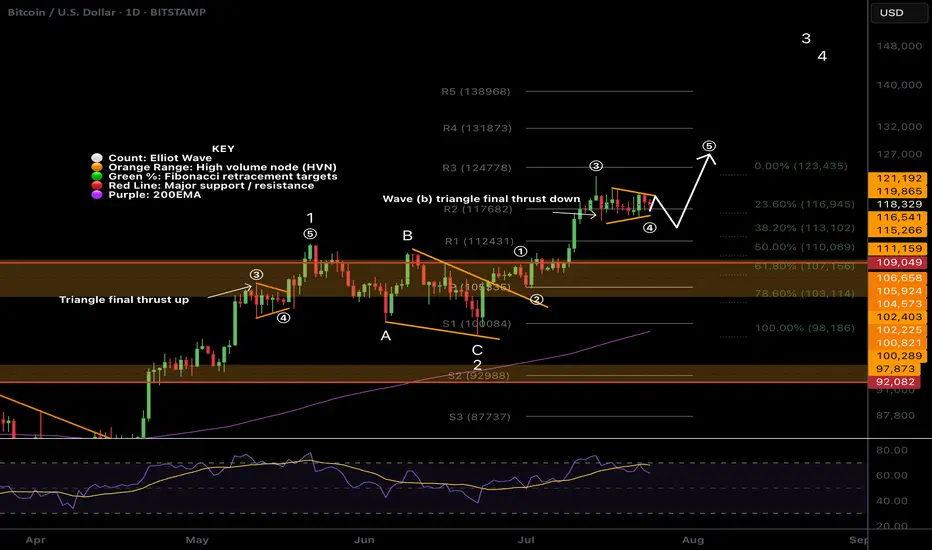
$BTC Wave (b) triangle?CRYPTOCAP:BTC Bitcoin appears to have competed wave 3 up, wave (a) down and now finishing a triangle in wave (b) which would result in a thrust down to around $113k before continuing to the upside in wave (5).
There is slight bullish divergence on daily RSI and wave (4) meets the Fibonacci retracement rules of between 0.236 - 0.382 adding confluence.
Previous all time high is expected to be tested as support on a larger correction, perhaps when the ascending daily 200EMA creeps up to the same level after we blow off.
Safe trading
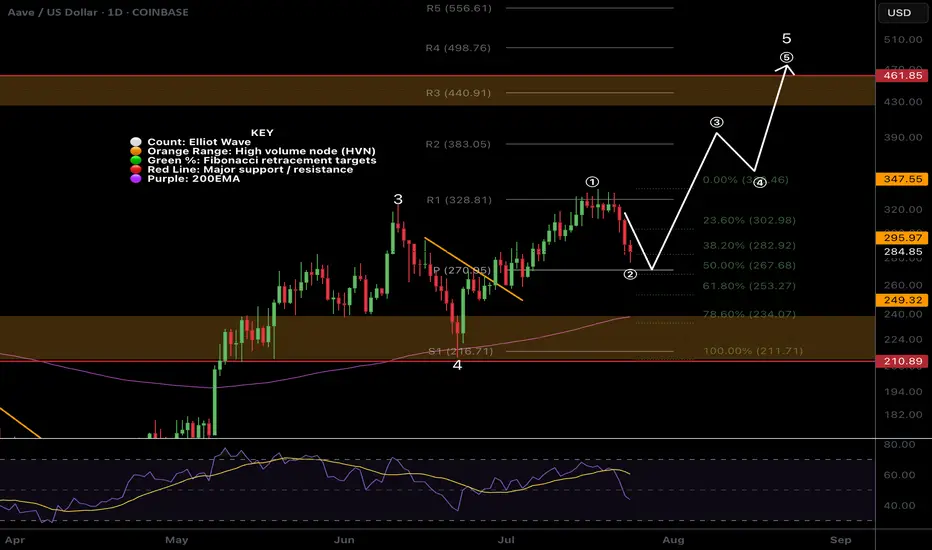
$AAVE Daily Hidden Bullish divergence?CRYPTOCAP:AAVE and alts begin their retracement Wednesday but is this a long term top or just local? Im betting we have a higher to go this summer..
Hidden daily bullish divergence is printing on RSI at the daily pivot and 0.5 Fibonacci retracement which should all act as strong support provided BTC doesn't dump.
The 'alt-coin golden pocket' Fibonacci retracement 0.786 sits at the descending daily 200EMA and High Volume Node support offering a secondary target for reversal and continued upside.
Losing this and closing below would flip me bearish until a new bullish signal emerges.
Safe trading.
Gold fell as expected, can it reverse?📰 News information:
1. Initial unemployment claims data
📈 Technical Analysis:
Gold has made a profit retracement correction as expected. The two-day rising market has led to an overly bullish sentiment in the market. Under this pattern, it is very easy to trigger an unexpected reversal trend, which is often a key opportunity to break the psychological defense line of retail investors in the market.
From the bottom of gold at 3244 to the high of 3439 this week, it can be found that the current 38.2% support position is near 3364. Moreover, the current daily SMA10 moving average position is also near 3364, SMA30 and the middle track of the Bollinger Band are near 3343, and SMA60 is near 3330.
From the daily line, if the daily line can stand above 3364, then there is still a possibility of refreshing the high of 3438 in the future. On the other hand, if the daily line falls below 3364, then 3438 may become the high point in July.
If there is a rebound in the morning, then 3384 in the white session will be the bottom support, and short positions must be participated in the European and American sessions. If the downward trend continues in the morning, there will be an opportunity to participate in long orders around 3370. At the same time, the possibility of further decline and reaching the middle line of 3343 cannot be ruled out. At the same time, if the 4H chart can form a head and shoulders top pattern, then the intraday long rebound point will not exceed 3410.
Therefore, on the whole, if it falls directly, it can be considered to go long when it first touches 3375-3365, and the target is 3390-3400; if the intraday decline is strong, the second trading opportunity is below 3355-3345, and the target is $10-20 before exiting.
🎯 Trading Points:
BUY 3375-3365
TP 3390-3400
In addition to investment, life also includes poetry, distant places, and Allen. Facing the market is actually facing yourself, correcting your shortcomings, facing your mistakes, and exercising strict self-discipline. I share free trading strategies and analysis ideas every day for reference by brothers. I hope my analysis can help you.
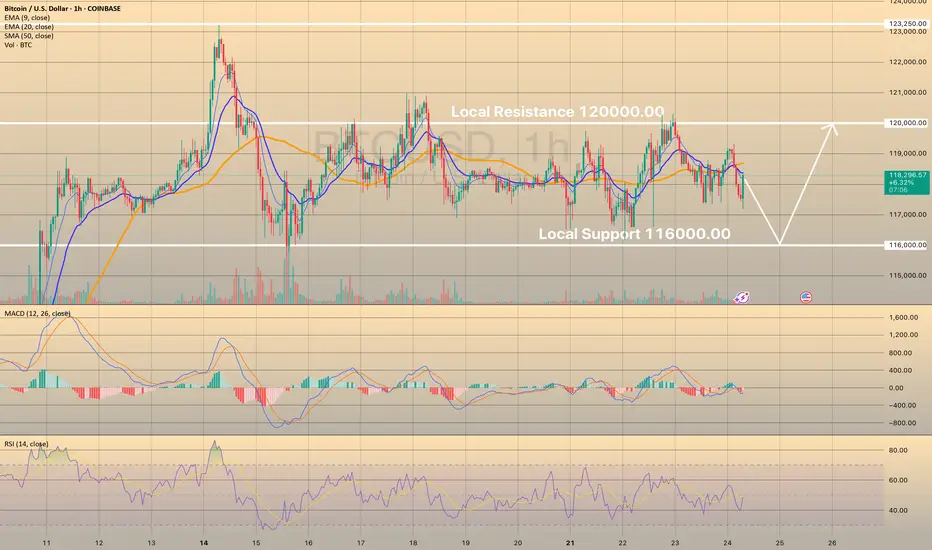
BTCUSD LOST SHORT-TERM BULLISH POTENTIALBTCUSD LOST SHORT-TERM BULLISH POTENTIAL
Bitcoin has been trading sideways since July 15th within a range of 116,000.00-120,000.00. Indicators show no signs of a new bullish/bearish trend.
How to trade sideways movements or range?
It is better to wait for a price to come close to one of the levels (support or resistance), then open buy/sell order. Or just pace a limit order and wait. Take-profit may be above/below the support/resistance levels with a stop-loss behind these levels (below for the support and above for the resistance).
So, the price decline towards 116,000.00 is expected, where potentially the price may rebound once again.
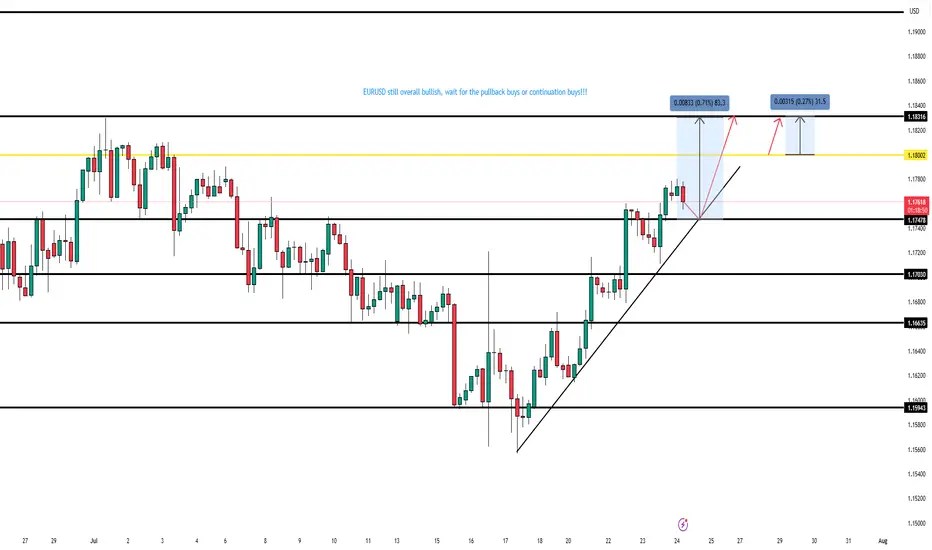
$EURUSD – Thursday, July 24th OutlookYesterday: Retest of 1.17478 gave +20 pips.
Today: Watching for another retest entry.
Targets:
• TP1: 1.18002 (+80 pips)
• TP2: 1.18316 (+30 pips)
Bias remains bullish; entries focused on clean retests.
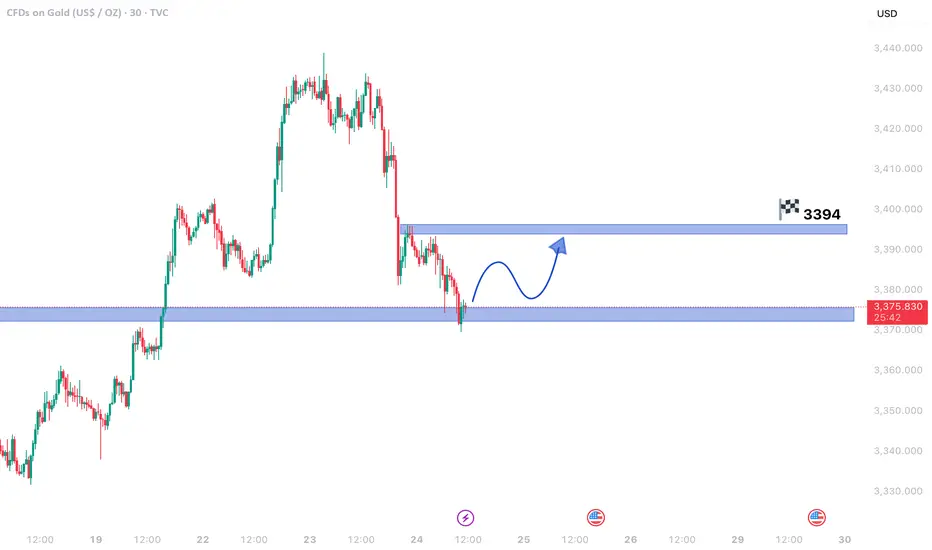
Gold Exhibiting Weak Bearish Momentum – Is a Rebound Imminent?Gold Exhibiting Weak Bearish Momentum – Is a Rebound Imminent?
The 30-minute chart reveals gold prices in a mild downtrend, but the sluggish decline hints at weakening bearish pressure. This could set the stage for a temporary price recovery before any further downward movement.
Critical Insights:
- Fading Bearish Strength: The downtrend persists, but its slowing pace suggests seller exhaustion.
- Key Support Zone: With prices hovering near a major support area, a bullish reversal becomes plausible.
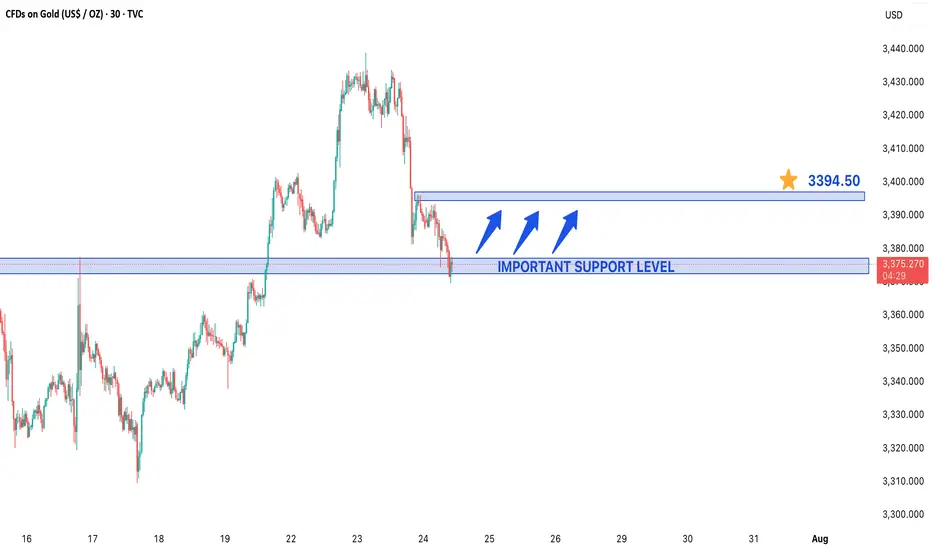
- Upside Potential: A resurgence in buying momentum may propel gold toward 3,394.60, a significant resistance level.
Market Dynamics:
1. Possible Short-Term Reversal: Shallow bearish trends near support often precede upward corrections.
2. Bullish Opportunity: A breakout past nearby resistance could fuel a rally toward 3,394.60, creating a swing trade setup.
3. Downside Risk: If support fails, the bearish trend may extend, though weak selling pressure limits immediate declines.
Strategic Approach:
- Entry Consideration: Long positions near current support levels could capitalize on a rebound.
- Risk Management: A drop below support would negate the bullish outlook, warranting a stop loss.
- Confirmation Signals: Bullish candlestick formations or increasing volume would strengthen reversal prospects.
Concluding Thoughts:
Gold’s tepid bearish momentum near a crucial support level raises the likelihood of a short-term bounce. Traders should watch for confirmation—if the recovery gains traction, 3,394.60 may come into play. Conversely, a support breakdown could renew downward pressure.
GOLD IN A WEAK BEARISH MOVE IN 30M TIME FRAME CHARTGold in a Weak Bearish Move – Temporary Rebound Ahead?
Gold prices are currently displaying a weak bearish momentum on the 30-minute chart, suggesting that the downtrend may be losing steam. Despite the downward movement, the sluggish pace indicates that sellers lack strong conviction, which could lead to a short-term price recovery before any further decline.
Key Observations:
- Weak Bearish Trend: The price is falling, but with decreasing momentum, often a sign of exhaustion among sellers.
- Critical Support Level: Gold is trading near a major support zone, where buying interest could emerge, triggering a bounce.
- Potential Rebound Target: If buyers step in, the price could rise toward 3,394.60, a key resistance level.
Market Implications:
1. Short-Term Reversal Likely: Weak bearish moves often precede temporary rallies, especially near strong support levels.
2. Bullish Scenario: A breakout above immediate resistance could push gold toward 3,394.60, offering a swing trading opportunity.
3. Bearish Continuation Risk: If support breaks, the downtrend may resume, but the current lack of strong selling pressure reduces immediate downside risks.
Trading Strategy:
- Buying Opportunity: Traders might consider long positions near support, targeting 3,394.60.
- Stop Loss: A break below the current support level would invalidate the rebound setup.
- Confirmation Needed: Watch for bullish candlestick patterns or rising volume to confirm the reversal.
Final Thoughts:
While gold remains in a short-term bearish phase, the weak downside momentum and proximity to support suggest a possible pullback. Traders should monitor price action closely—if the rebound holds, 3,394.60 could be the next target. However, a failure to hold support may extend the decline.
*Disclaimer: This analysis is for informational purposes only. Trade with proper risk management.*
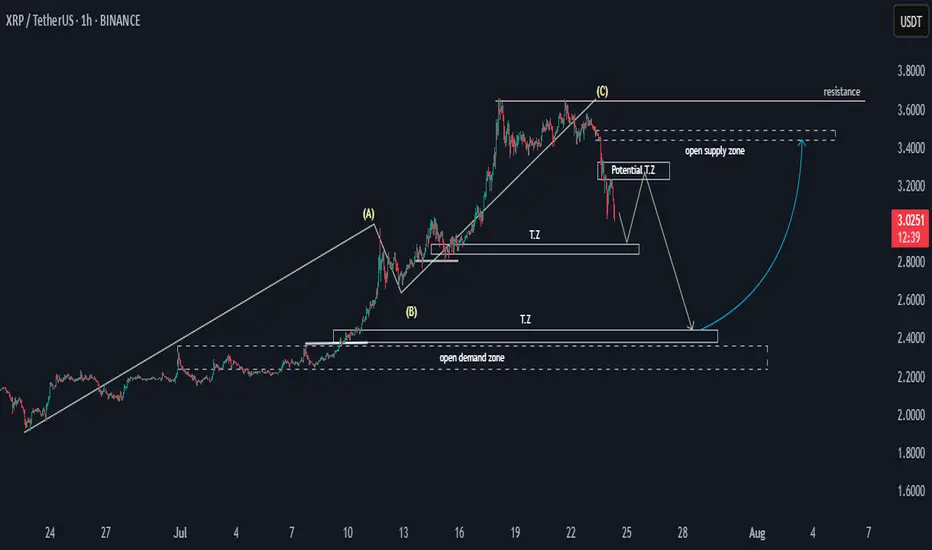
XRP Potential SND Flow MapHello,
This is a general overview of the XRPUSDT flow map, outlining potential price movements.
The price may experience a decline, followed by a pulse upwards before a final drop. Target zones have been identified, and following this, there is a possibility for the price to rally toward the 3.4 supply zone. This would establish the 2.4 to 2.2 range as a key potential bullish zone.
Happy Trading,
Khiwe.
Not trading advice
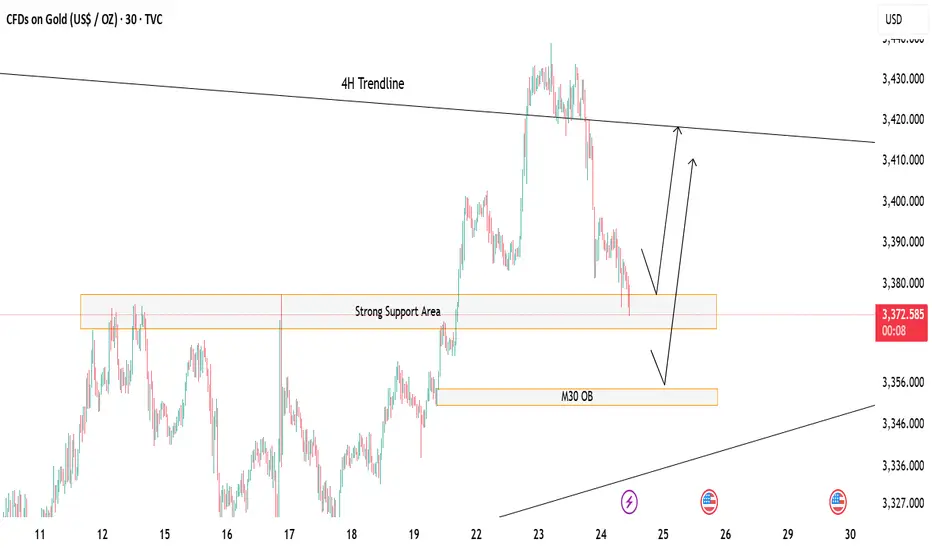
Gold at Key Decision Zone – Bounce or Break?Price is currently hovering above a strong support zone, showing potential for a short-term bounce. 🔁
If this zone holds, we could see a bullish reaction toward the 4H trendline resistance above. 📈
However, a break below may lead price to drop and tap into the M30 Order Block (OB) for a deeper mitigation before any move up. ⚠️
If this happen we could look for potential sell till the OB test otherwise the buying opportunity should focused more
🎯 Watch these key zones carefully – market is at a decision point!
Both buy and sell setups possible depending on how price reacts at these levels.
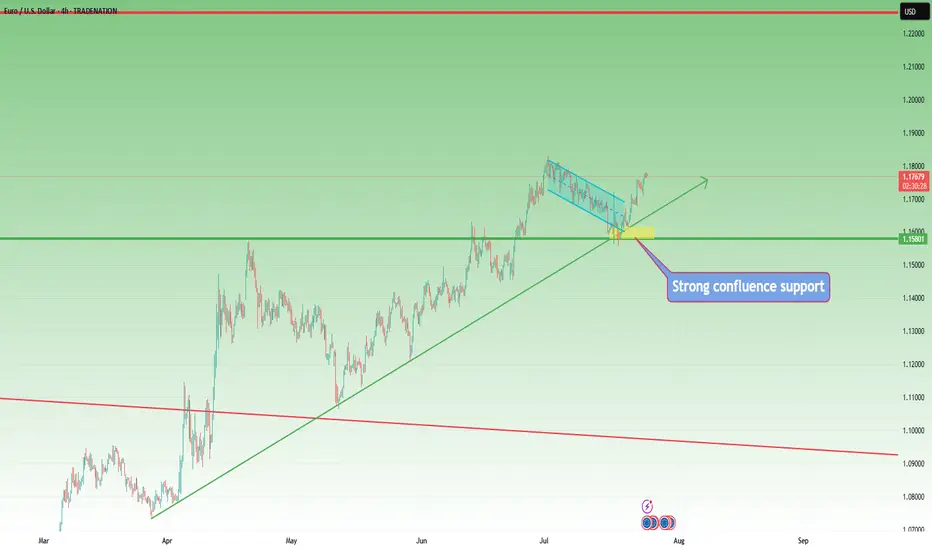
EURUSD – Bulls Still in Control, Trend ResumesIn my previous EURUSD analysis, I pointed out that the pair was nearing an important confluence support around 1.1620, and that – given the overall bullish trend – this zone could offer solid long opportunities.
What followed?
The market briefly dipped below that zone, even challenging the psychological 1.1600 round number. But instead of breaking down, bulls regrouped, stepped in with force, and pushed the pair aggressively higher.
📍 At the time of writing, EURUSD is trading at 1.1770, and my long trade is running with a comfortable 150 pips profit.
🔍 W hat’s Next?
The current structure suggests a continuation of the uptrend, and the logical technical target is the recent high at 1.1830.
Until proven otherwise, this is still a buy-the-dip market.
✅ Buying around 1.1700 could be a valid setup, especially if we see buying power on the intraday chart
⚠️ The Warning Sign
Despite the bullish bias, keep in mind:
If EURUSD drops and closes below 1.1670, the structure begins to shift — and this could signal a deeper correction or even trend reversal.
📌 Until then, the bias remains bullish, dips are to be watched for entries, and 1.1830 is the next checkpoint.
D isclosure: I am part of TradeNation's Influencer program and receive a monthly fee for using their TradingView charts in my analyses and educational articles.
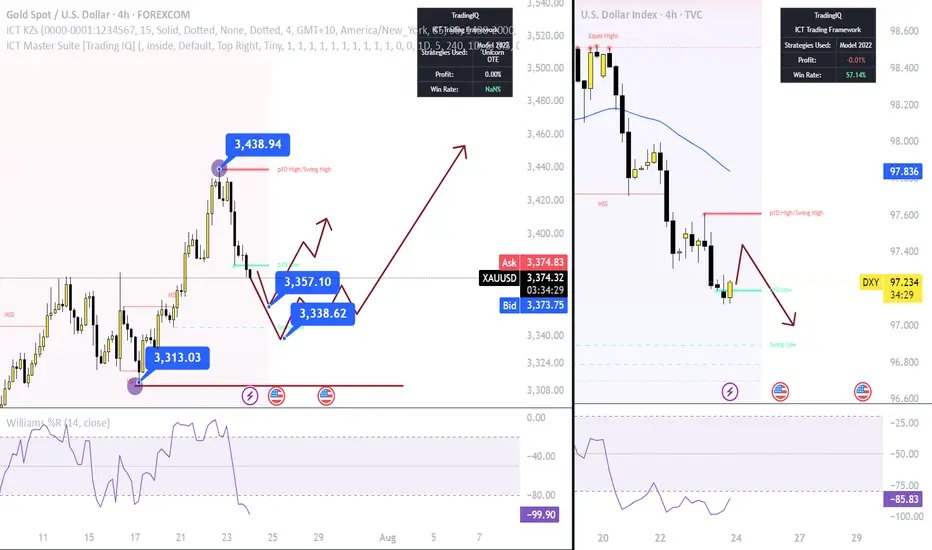
Gold at a Critical Reversal Zone – Waiting for Structural Break 📉 Gold Outlook – Corrective Dollar Strength & Potential Reversal Zones
🧭 Market Structure-Based Outlook with Multi-Timeframe Confluence
Gold is currently experiencing a controlled decline, primarily driven by a short-term corrective appreciation in the U.S. dollar.
This dollar strength is likely temporary and is expected to reverse toward the 3370–3354 zone — a technically significant area marked by previous liquidity sweeps and imbalance fills.
🔍 Technical Setup:
Bias (HTF): Bullish
Current Move (LTF): Corrective
Key Observation: No shift in long-term market structure on higher timeframes; price action remains within a bullish regime.
✅ Strategic Trade Plan:
We will not engage prematurely.
The optimal entry will only be considered upon a confirmed bullish market structure shift on the 15-minute timeframe — ideally a BOS (Break of Structure) followed by mitigation.
🛒 Entry Zone:
Around 3370 – 3354, contingent upon a clean bullish break in structure.
⛔ Invalidation Level (SL):
Below 3308 (structure invalidation + liquidity trap zone)
🎯 Profit Targets (Scaled):
TP1: 3400
TP2: 3430
TP3: 3500 – 3560
TP4 (Extended): 3600 – 3720
(Use partials & scale accordingly based on trade management plan)
🧠 Fundamental Confluence:
The macro picture remains supportive of higher gold prices.
Anticipated dovish shifts from the Federal Reserve, particularly in the form of rate cuts or forward guidance softening, may act as the macro catalyst for continuation toward new highs.
🛎 Conclusion:
While the current correction appears sharp, it lacks HTF structural reversal characteristics.
Patience and precision are essential — no entry should be considered without a 15m bullish break in structure.
GBPCHF NEXT BIG MOVE MIGHT OCCUR SOON!Price has been moving in a tight consolidation lately. Following the rebound we saw around 1.06900 level. From the technical standpoint, I’d anticipate a breakout above the trendline for more bullish price action continuation.

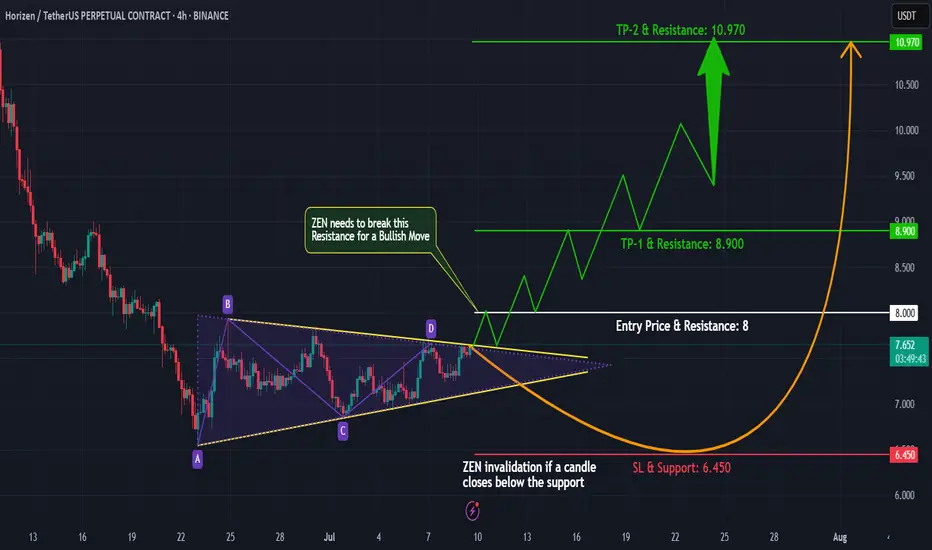
ZENUSDT | Triangle Breakout Setup Brewing!#ZEN is currently consolidating in a symmetrical triangle pattern on the 4-hour timeframe, following a strong bearish move. The price action has shifted to a sideways range, signaling a potential trend reversal or continuation setup in the making.
What to Watch:
We’re closely monitoring a bullish breakout from the triangle or resistance zone.
A confirmed breakout with a successful retest will trigger our long entry.
As always, proper risk management is key – wait for confirmation before entering.
Trade Plan:
✅ Wait for breakout above resistance
✅ Look for volume confirmation
✅ Enter on retest with a tight stop-loss
✅ Target recent highs for a solid R:R setup
What’s your take on #ZEN? Do you see a breakout coming or more chop ahead? Drop your thoughts in the comments!
Follow me for more real-time crypto setups and chart breakdowns!
#ZEN #CryptoTrading #PriceAction #TrianglePattern #BreakoutTrade #TechnicalAnalysis #ZENUSDT #Altcoins #TradingSetup #CryptoTA #BullishBreakout #SwingTrade #4hrChart #TradingViewIdeas
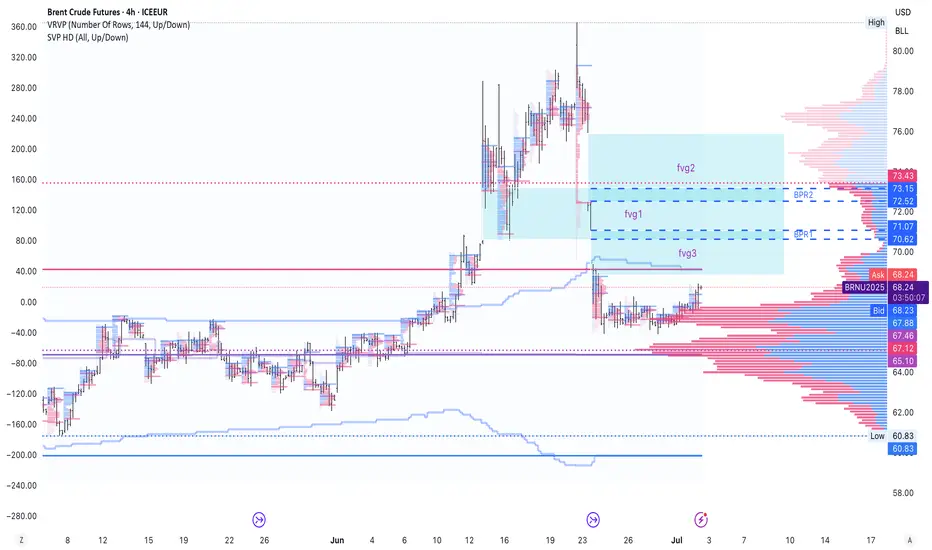
to identify BPRs on Brent Oil FuturesI am not good at the ICT price action style. So I got 2 questions for traders that know this well.
1. Did i draw the correct BPRs? I use both bars and volume profile to filter FVGs
2. Do you only use BPRs to do after break trend following or position closing, or you can actually use them in resistance reversal entry?
Need your help and advice mates.
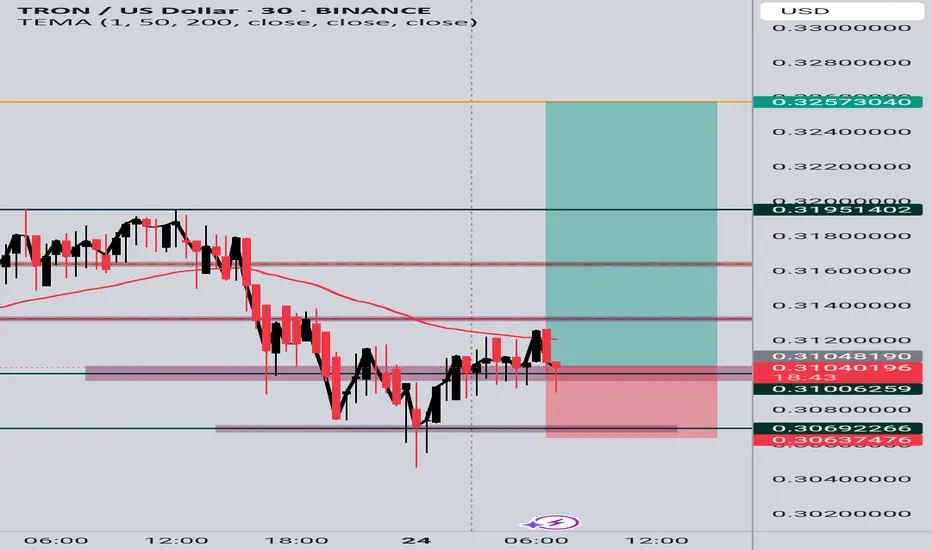
TRX/USD Long Setup (30m Chart)TRX/USD Long Setup (30m Chart)
Price formed a consolidation base around 0.3100 after a strong drop. I entered long on a potential bullish breakout above the short-term structure, targeting partial profits at key resistance levels:
TP1: 0.3195
TP2: 0.3257
Stop loss is set below recent support near 0.3063.
Entry is based on a possible reversal and EMA resistance break.
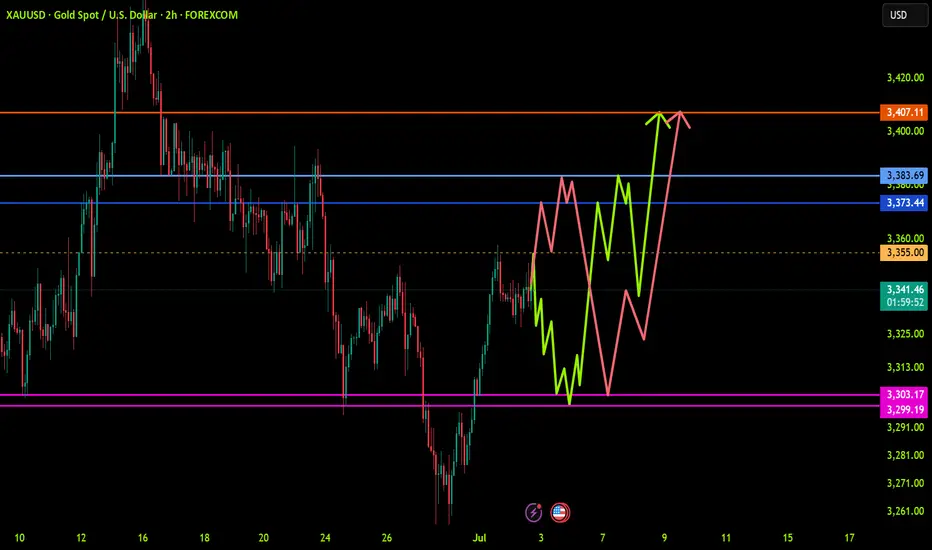
XAUUSD: Trend in 2H timeframevery important levels for GOLD, we have two trends,
Please pay special attention to the colored levels.
Trends are very accurate,
>>>>>>>>>>>>>>>>>>> The setup is very sensitive <<<<<<<<<<<<<<<<<<<<<<<<
Be careful
BEST
MT
Pending Orders Are Not Set in Stone – Context Still MattersIn a previous educational article, I explained why I almost never trade breakouts on Gold.
Too many fakeouts. Too many emotional traps.
Instead, I stick to what works:
• ✅ Buying dips
• ✅ Selling rallies
But even these entries — placed with pending orders — are not automatic.
Because in real trading, price is not just a number — it’s a narrative.
And if the story changes, so should the trade.
________________________________________
🎯 The Setup – Buy the Dip Around 3400
Let’s take a real example from yesterday.
In my analysis, I mentioned I would look to buy dips near 3400, a former resistance now acting as support.
Price dropped to 3405, just a few points above my pending buy at 3402.
We saw a clean initial bounce — confirming that short-term support was real.
But I missed the entry by 30 pips.
So far, so good.
But here’s the important part — what happened next changed everything.
________________________________________
🧠 The Rejection Shifted the Entire Story
The bounce from 3405 was immediately sold into at 3420, a newly formed short-term resistance (clearly visible on the 15-minute posted chart).
After that, price started falling again — heading back toward my pending order.
📌 At that point, I cancelled the order. Why?
Because the context had changed:
• Bulls had tried once — and failed at 3420
• Sellers were clearly active and waiting above
• A second drop into my level wouldn’t be a clean dip — it would be retest under pressure.
The market was no longer giving me a “buy the dip” setup.
It was showing me a failed recovery. That’s a very different trade.
________________________________________
💡 What If It Had Triggered?
Let’s imagine that price had hit 3402 first, triggering my order.
Then rebounded, failed at 3420, and started dropping again.
Even then, I wouldn’t hold blindly.
Once I saw the rejection at 3420, I would have understood:
The structure had shifted.
The bullish case is weakening.
Exit early — breakeven or small controlled loss.
________________________________________
🔁 Sequence > Level
This is the most important principle:
• ✅ First down, then up = healthy dip → shows buyers are still in control
• ❌ First up, then down = failed breakout → shows selling pressure is stronger
Two scenarios. Same price. Opposite meaning.
That’s why you should look for:
Not just where price goes — but how it gets there.
________________________________________
🔒 Pending Orders Are Conditional
Many traders treat pending orders like traps:
“Just let price come to my level, and I’m in.”, but you should refine a little
✅ Pending orders should be based on a conditional expectation
❌ Not a fixed belief that the zone must hold
If the market tells a different story, remove the order.
No ego. No drama. Just process.
________________________________________
📌 Final Thought
Trading isn’t just about catching a price.
It’s about understanding price behavior.
First down, then up = strength.
First up, then down = weakness.
Let the market show its hand — then decide if you want to play.
Disclosure: I am part of TradeNation's Influencer program and receive a monthly fee for using their TradingView charts in my analyses and educational articles.
GBPUSD InsightWelcome, everyone!
Please share your personal opinions in the comments. Don’t forget to hit the booster and subscribe!
Key Points
- Japanese Prime Minister Shigeru Ishiba has completely denied reports suggesting he might resign, indicating his intention to remain in office.
- The European Union is reportedly preparing retaliatory tariffs worth €100 billion in case negotiations with the United States break down.
- According to major foreign media outlets, the U.S. is close to agreeing on a plan to impose a 15% tariff on EU goods, including automobiles.
This Week's Key Economic Event
+ July 17: Eurozone June Consumer Price Index (CPI)
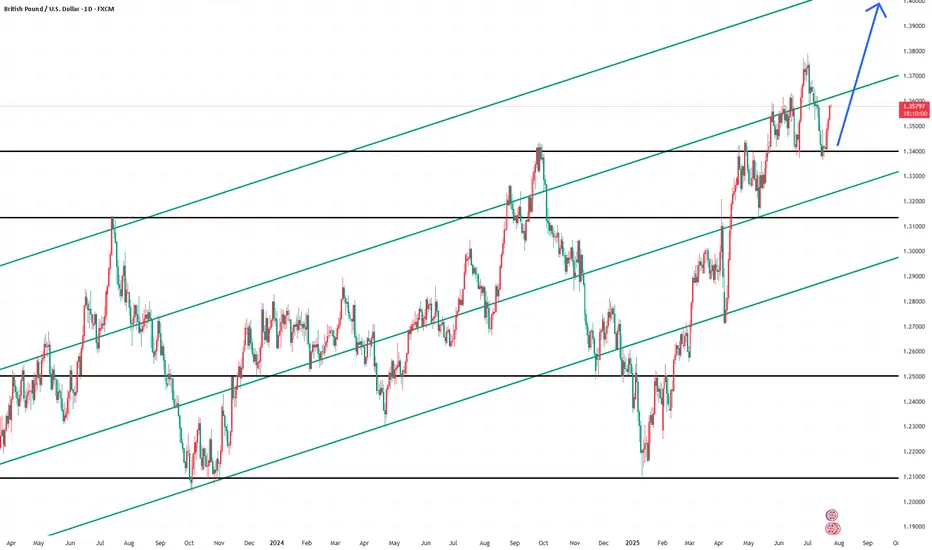
GBPUSD Chart Analysis
After confirming support at the 1.34000 level, the pair has rebounded and is maintaining an upward trend. The 1.36000–1.36500 range, where trendline resistance lies, will be a key hurdle. If it successfully breaks through this zone, the uptrend is expected to continue smoothly toward the 1.40000 level.
However, if the market unexpectedly shifts downward, we will promptly adjust our strategy.
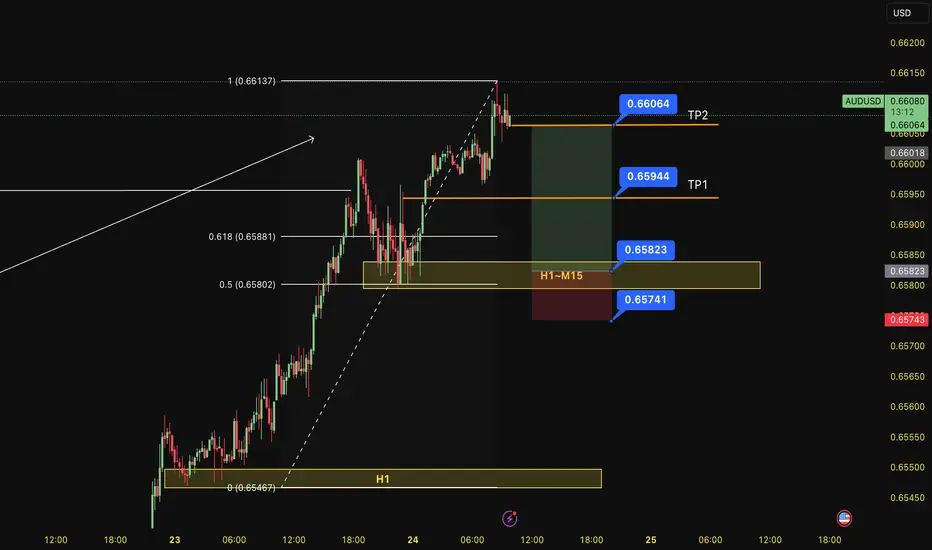
BUY AUDUSD 24.7.2025Confluence order: BUY at H1~M15
Type of order: Limit order
Reason:
- The price breakout H4 (the last top) confirming the uptrend.
- M15~FIBO 0,5-0,618 (same position)
Note:
- Management of money carefully at the price of sub key M15 (0,65944)
Set up entry:
- Entry buy at 0,65823
- SL at 0,65741
- TP1: 0,65944
- TP2: 0,66064
Trading Method: Price action (No indicator, only trend and candles)
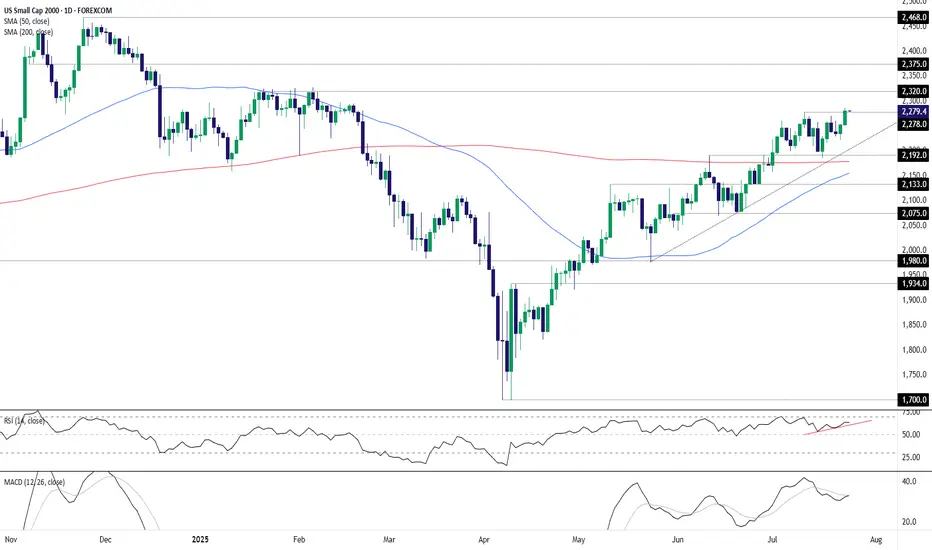
U.S. Small Caps Break Out: Dash for Trash Gathers SteamSitting in an obvious uptrend with momentum indicators skewing increasingly bullish, it looks like the U.S. small cap 2000 contract wants to go higher. The dash for trash is on!
Having just cleared the July 10 high of 2278, it’s provided a decent setup to initiate fresh longs, allowing for a stop beneath that level for protection against a reversal.
2320 screens as an initial target given the contract consistently struggled to break above it earlier this year. Beyond that, 2375 and the record high of 2468 are the levels to watch.
Good luck!
DS
AUDJPY Bullish Order Block In SightOANDA:AUDJPY Price finds Support at the Swing Low @ 95.629 and creates a Swing High @ 96.741!
Based on the ICT Method, the Swing Low broke Sell-Side Liquidity @ 95.995 and opened up a Bullish Order Block Opportunity @ 96.217!
Price is currently working down from 96.49 at the time of publishing but once Price visits the Order Block, this could deliver Long Opportunities!!
