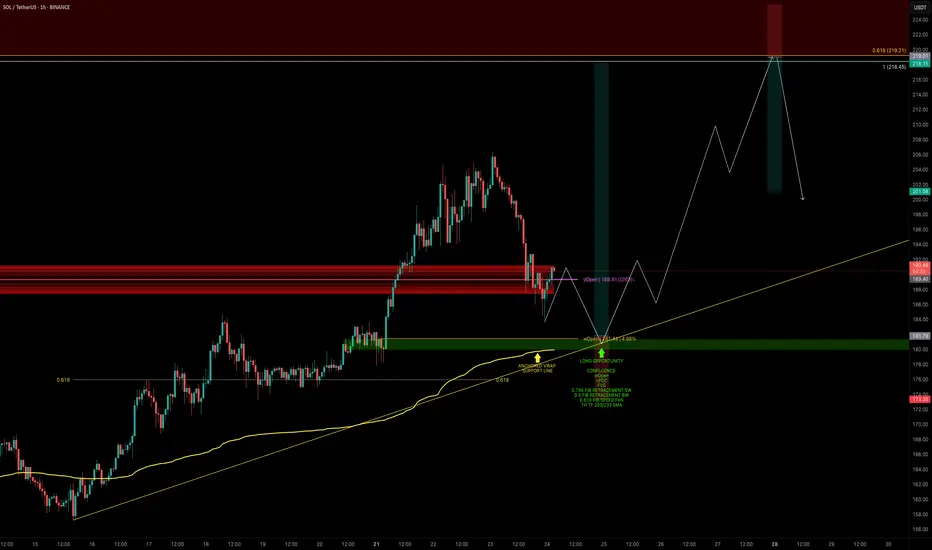
SOL — Bullish Retest in Motion: Time to Strike?SOL has finally broken through the $180 barrier decisively — a key zone it failed to clear back in May.
Now we’re seeing a retest, which may offer one final dip before continuation. Let’s break down the next high-conviction long opportunity.
🧩 Key Retest Zone: $182–$180
➡️ Retesting Prior Resistance as Support
SOL broke above $180 with conviction and is now pulling back.
➡️ First Reaction at $184
A clean bounce occurred at the anchored VWAP, but this might not be the final low.
➡️ Strong Confluence at $180–$182 Zone
This zone is packed with support elements:
Weekly Open (wOpen): $181.44
nPOC: $180.85
Anchored VWAP: ~$179.90
0.5 Fib retracement (of the larger wave)
0.786 Fib retracement (of the smaller wave)
0.618 Fib Speed Fan — projected for tomorrow’s price path
1H 200 & 233 SMAs supporting from below
SOL is currently trading at yOpen — another key pivot level to watch
🟢 Long Trade Setup
Entry: Laddered between $182–$180 (ideal long entry would be at wOpen)
Stop-loss: Invalidation at $173.35
Target (TP): TBFE 1.0: $218.45 / 0.618 Fib retracement: $219.21
R:R: ~1:4.5
Potential Move: ~+20%
🛠 Indicator Used: DriftLine — Pivot Open Zones
For this analysis, I’m using my own published indicator called "DriftLine – Pivot Open Zones " feel free to check it out on my profile.
It helps identify and visualise critical opens (daily, weekly, previous days), providing real-time support/resistance zones.
➡️ You can use it for free — just check my profile under “Scripts” and add it to your chart.
💡 Pro Tip: Support Zones Are Stronger with Confluence
Don’t rely on a single fib or level. When opens, VWAPs, SMAs, and fibs cluster, the probability of a strong reaction increases.
This is how smart traders define clear entries and invalidation.
_________________________________
💬 If you found this helpful, drop a like and comment!
Want breakdowns of other charts? Leave your requests below.
Support and Resistance
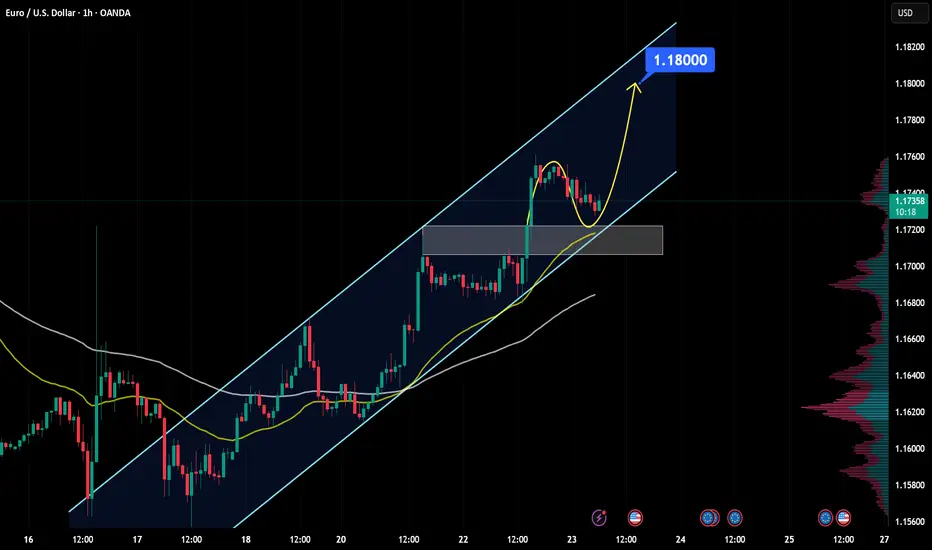
EURUSD Analysis - Can Buyers Push Price To $1.18000?Hello all dear traders!
EURUSD is trading within a clear bullish channel, with price action consistently respecting both the upper and lower boundaries. The recent bullish momentum shows that buyers are in control, suggesting further upside.
The price recently broke above a key resistance zone and is now coming back to retest it. If this level holds as support, it will consolidate the bullish structure and increase the likelihood of a move towards the 1.18000 target, which is in line with the upper boundary of the channel.
As long as the price remains above this support zone, the bullish outlook remains intact. However, a failure to hold this level could invalidate the bullish scenario and increase the likelihood of a deeper pullback.
Remember, always validate your setups and use appropriate risk management.
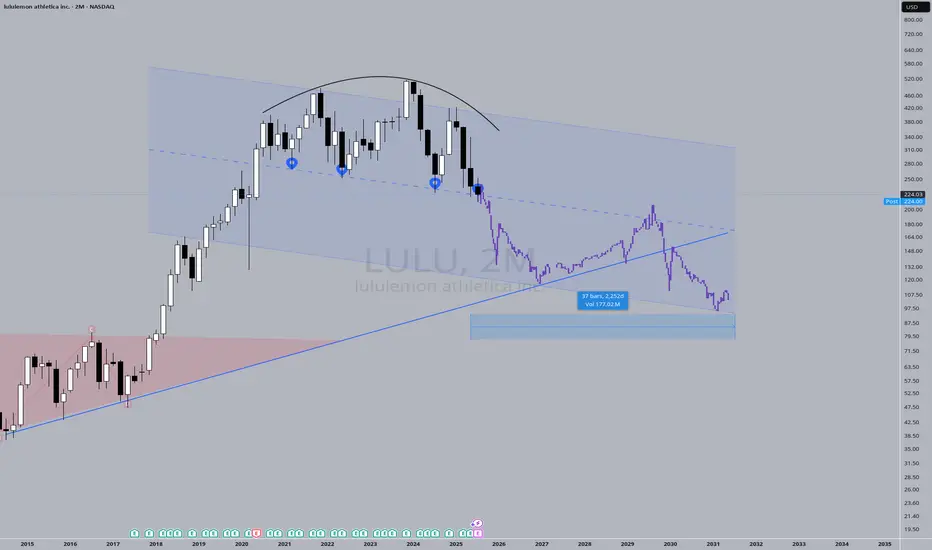
Mega-ultra macro LULU takePrice action has "knocked" on the support door FOUR times. It's got to give sometime soon. Fashion brands come and go, I think LULU has had it's time to shine, now it's time for another brand to emerge and take its place.
I say "Mega-ultra macro" to recognize the absurdity of a 6-year guess. The probability of accurately predicting price action for a 6-year window is low. But here's a prediction anyway.
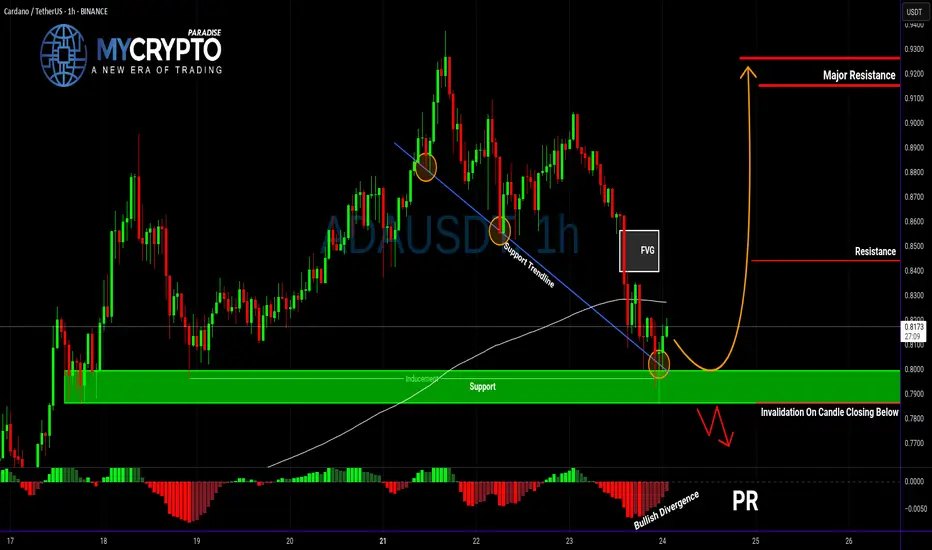
ADA About to Explode or Collapse?Yello Paradisers — is ADA gearing up for a breakout, or are we walking straight into a bull trap? After the recent pullback, the market is throwing mixed signals, but this setup is becoming too important to ignore. Here’s what we’re seeing right now on ADAUSDT.
💎ADA is currently showing positive signs of strength after a solid retracement. Current support zone is not only a historical price pivot, but it's also aligned with a supportive trendline, the 200 EMA, and a developing bullish divergence on the chart. All these factors combined are increasing the probability of a short-term bounce — but that doesn't mean we go in blind.
💎For aggressive traders, entering at the current price might make sense, especially if you’re targeting the first resistance level. However, it’s important to note that this entry offers a relatively limited reward compared to the risk — roughly a 1:1 risk-reward ratio — so it’s crucial to size your position accordingly and keep tight control over your stop loss.
💎If you're looking for a cleaner setup with a better risk-to-reward profile, patience is key. A more favorable scenario would be waiting for a proper pullback and a confirmed retest of the support zone. Ideally, you want to see a strong bullish candle at the support level to signal continuation — that’s when the setup shifts from average to high-probability.
💎But be cautious. If the price breaks down and closes a candle below our support zone, the entire bullish idea becomes invalid. In that case, it’s much wiser to step back and allow the market to develop more structure before re-engaging. Forcing trades in uncertain conditions is where most traders lose, and we don’t want to be part of that crowd.
🎖Strive for consistency, not quick profits. Treat the market as a businessman, not as a gambler. Be patient, Paradisers — only those who follow structured strategies and risk management will thrive in the long run.
MyCryptoParadise
iFeel the success🌴
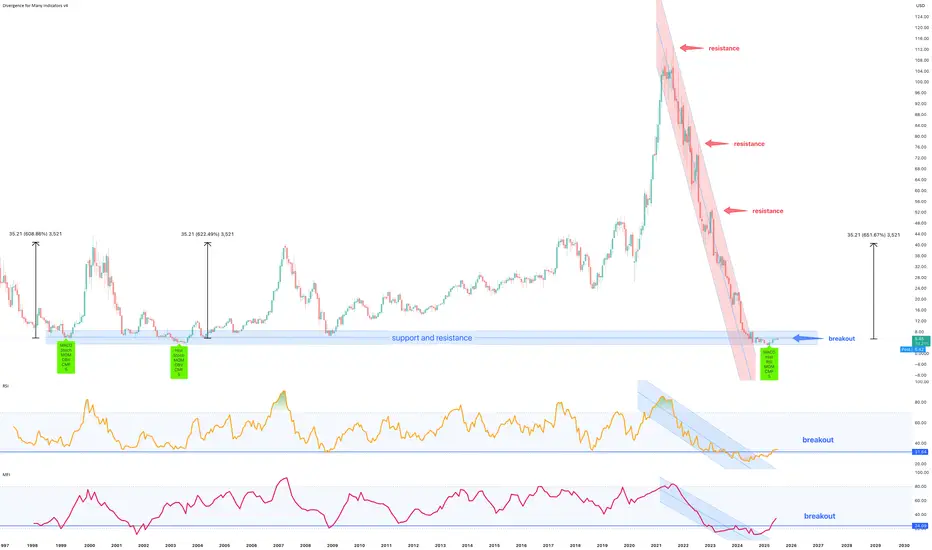
TTEC Holdings Inc, 500% return for the shrewd** long term forecast, the months ahead **
A 97% correction is shown on the above 16 day chart. As of 2021 price action has collapsed from $112 to circa $5 today. A number of reasons now exist for a bullish outlook.
Support and resistance
Price action, Relative Strength Index (RSI), and Money Flow Index both print resistance breakouts.
Look left. Price action is now on legacy support from 1999, 2003, and 2009 market bottoms. This is not the place to be a seller.
The trend
Something interesting in the RSI and MFI (orange and pink lines below chart). They are showing signs of a trend reversal, with higher highs and lower low prints after the breakouts. Exactly what happened in 1999, 2003, and 2009. A deja vu moment.
Positive divergence
Multiple oscillators print positive divergence with price action. Ready to be dazzled? Not only multiple oscillators as in previous years but the same oscillators!
The Stock
Two notes of interest,
1. No share splits.
2. Short interest 18%
Fundamentals
If you’re not chasing businesses who seek to implement AI into their operations, then you’re going to be miss out on some of the best returns in the years ahead. Crypto currency was yesterday, now in decline and dying. Today the narrative is AI, follow the money.
Is it possible price action continues to correct? Sure.
Is it probable? No
Ww
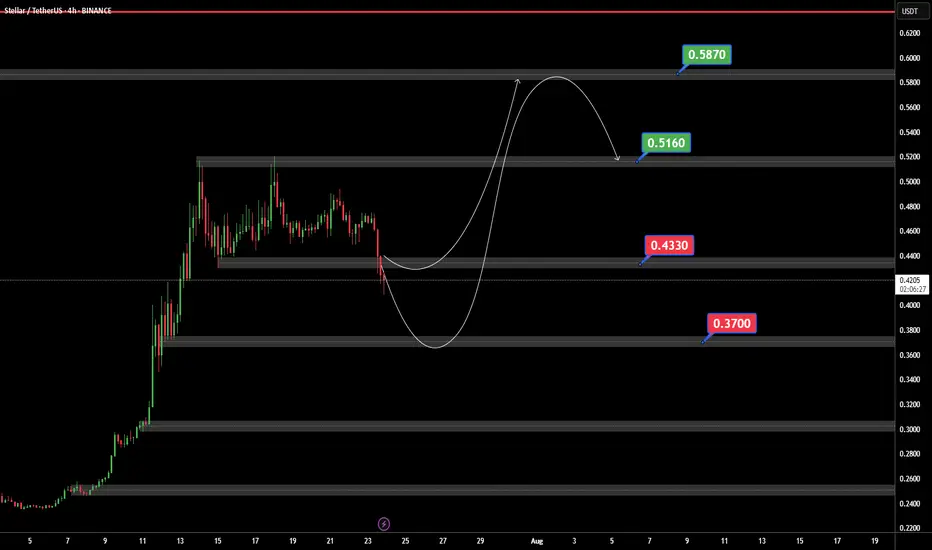
XLMUSDTIf BINANCE:XLMUSDT can support 0.4430 $ ready for jump to 0.5160 and best target in 0.5873 $.
But if XLM can price breaked 0.4330$ support we ready for a bear trend.
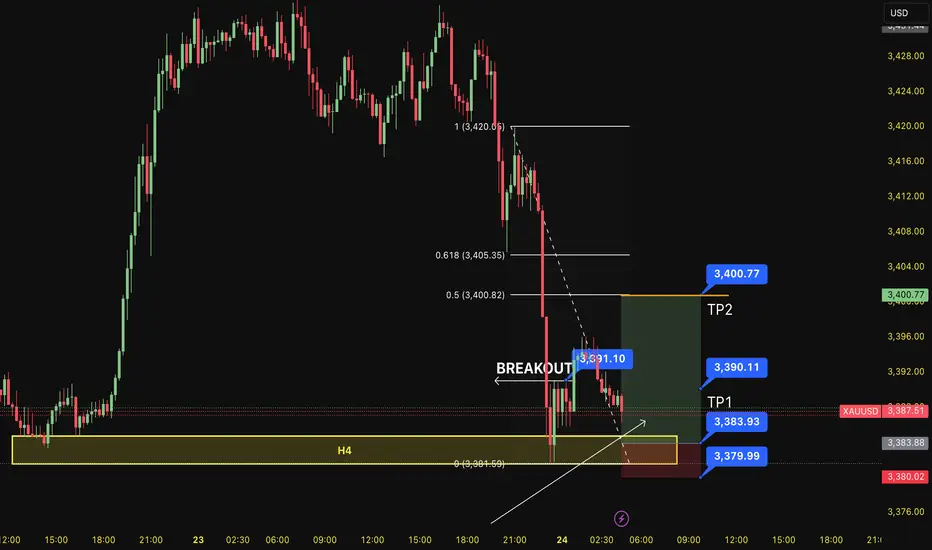
BUY XAUUSD 24.7.2025Counter-trend trade order: SELL at H4~H1~M15
Type of entry: Limit order
Reason:
- If the price breakout at 3,391 confirming the uptrend.
Note:
- Management of money carefully at the price of last top (3,390)
Set up entry:
- Entry sell at 3,383
- SL at 3,379
- TP1: 3,390
- TP2: 3,400
Trading Method: Price action (No indicator, only trend and candles)
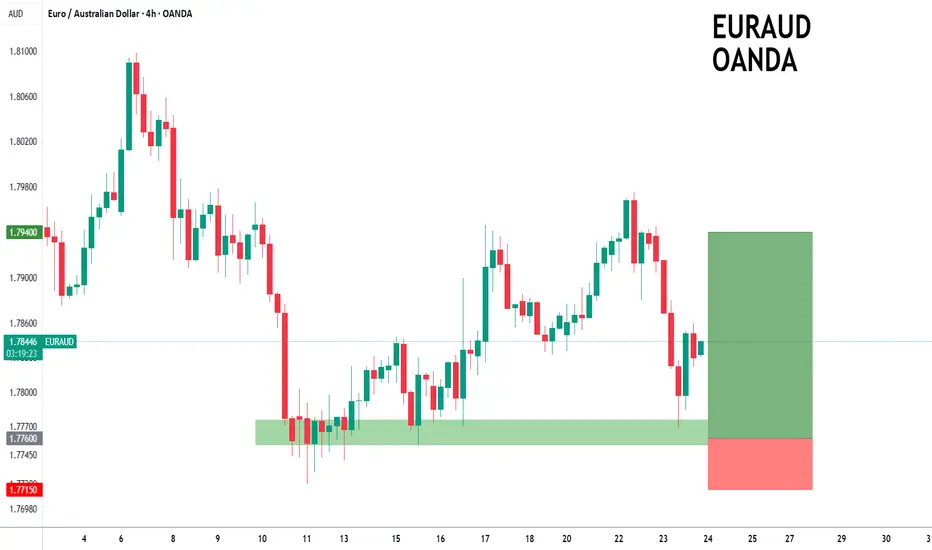
EURAUD to find buyers at previous support?EURAUD - 24h expiry
The primary trend remains bullish.
We are trading at oversold extremes.
Preferred trade is to buy on dips.
Risk/Reward would be poor to call a buy from current levels.
Bespoke support is located at 1.7760.
We look to Buy at 1.7760 (stop at 1.7715)
Our profit targets will be 1.7940 and 1.7960
Resistance: 1.7840 / 1.7900 / 1.7950
Support: 1.7750 / 1.7720 / 1.7700
Risk Disclaimer
The trade ideas beyond this page are for informational purposes only and do not constitute investment advice or a solicitation to trade. This information is provided by Signal Centre, a third-party unaffiliated with OANDA, and is intended for general circulation only. OANDA does not guarantee the accuracy of this information and assumes no responsibilities for the information provided by the third party. The information does not take into account the specific investment objectives, financial situation, or particular needs of any particular person. You should take into account your specific investment objectives, financial situation, and particular needs before making a commitment to trade, including seeking, under a separate engagement, as you deem fit.
You accept that you assume all risks in independently viewing the contents and selecting a chosen strategy.
Where the research is distributed in Singapore to a person who is not an Accredited Investor, Expert Investor or an Institutional Investor, Oanda Asia Pacific Pte Ltd (“OAP“) accepts legal responsibility for the contents of the report to such persons only to the extent required by law. Singapore customers should contact OAP at 6579 8289 for matters arising from, or in connection with, the information/research distributed.
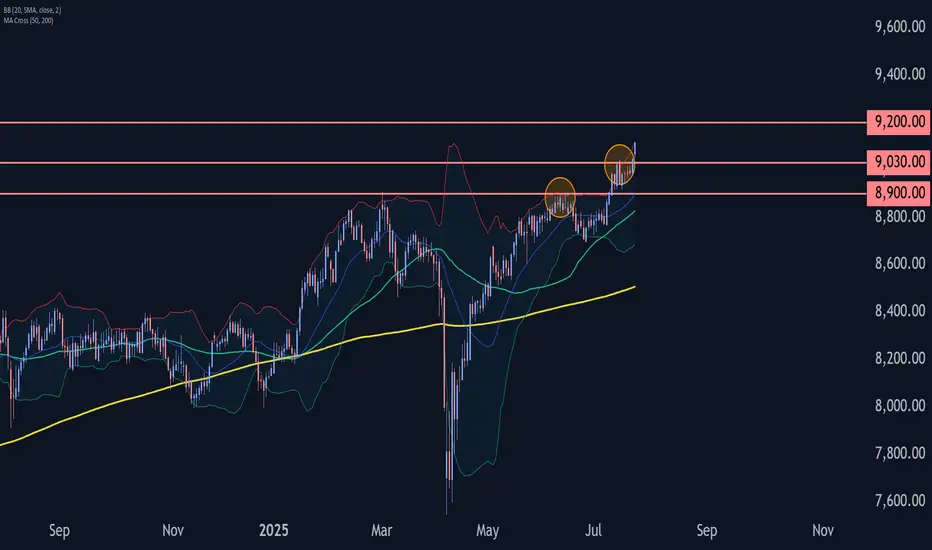
FTSE 100 Wave Analysis – 23 July 2025- FTSE 100 broke resistance level 9030.00
- Likely to rise to resistance level 9200.00
FTSE 100 Index recently broke above the resistance level 9030.00, which stopped the previous minor impulse wave 1 at the start of July.
The breakout of the resistance level 9030.00 continues the active minor impulse wave 3 – which belongs to the intermediate impulse wave (3) from the end of July.
Given the clear daily uptrend, FTSE 100 Index can be expected to rise to the next resistance level 9200.00 (target price for the completion of the active impulse wave 3).
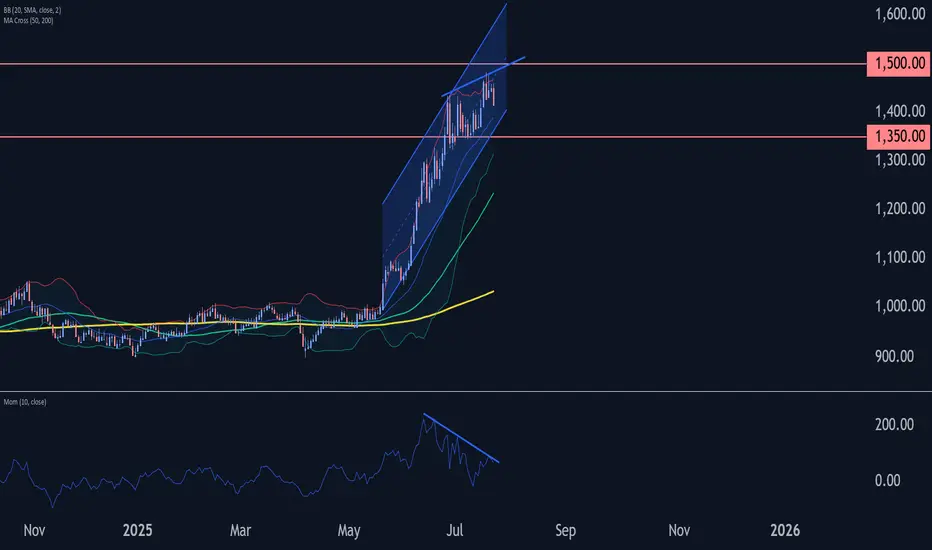
Platinum Wave Analysis – 23 July 2025- Platinum reversed from resistance zone
- Likely to fall to support level 1350.00
Platinum recently reversed down from the resistance zone located between the round resistance level 1500.00, upper daily Bollinger Band and the resistance trendline of the daily up channel from May.
The downward reversal from this resistance created the daily Japanese candlesticks reversal pattern Bearish Engulfing.
Given the weakening daily Momentum (showing bearish divergence), Platinum can be expected to fall to the next support level 1350.00 (low of the previous correction 4).
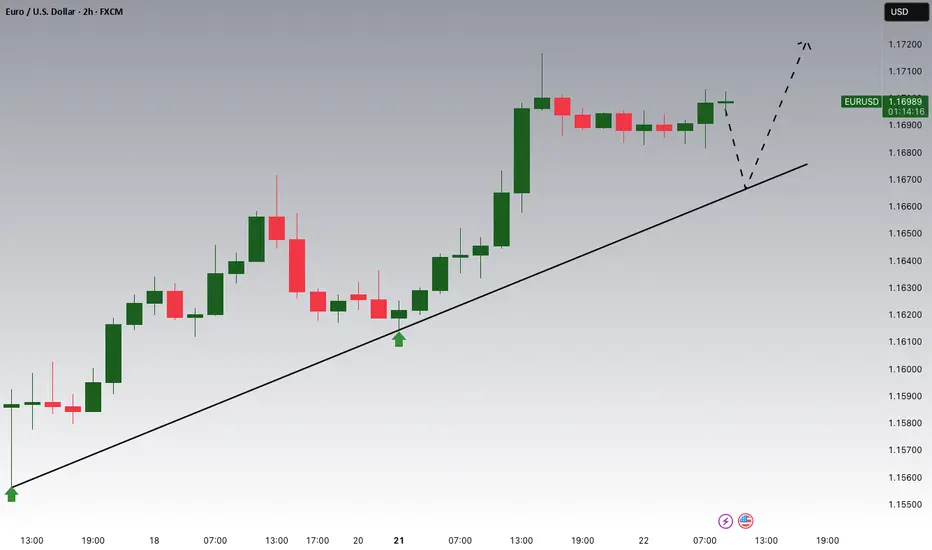
EURUSD Potential UpsidesHey Traders, in today's trading session we are monitoring EURUSD for a buying opportunity around 1.16650 zone, EURUSD is trading in an uptrend and currently is in a correction phase in which it is approaching the trend at 1.16650 support and resistance area.
Trade safe, Joe.
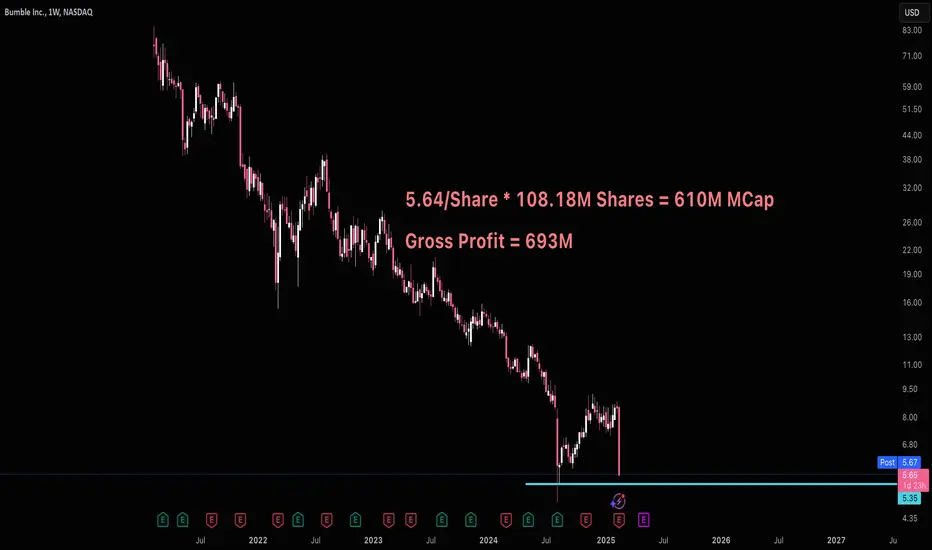
The Case For BumbleBumble has a yearly gross profit of 693M. Last year they repurchased 310M worth of stock.
Bumble at 5.64/share means it's entire market cap would be 610M or 80M less than one year's worth of profit. I don't understand how anyone could sell BMBL this low.
So while I'm not in love with BMBL's revenue growth, it's pretty clear this stock is significantly undervalued. 5.35 would be my buy target on support.
I'm interested to hear anyone else's take.
Good luck!
GBPNZD Elliotwaves updatePrice completed first wave of higher degree wave C. Currently price is on the lower degree wave 3. We should expect price to gain momentum to the downside creating lower lows to complete higher degree wave C. To take advantage of this short term bearish bias, one should find confluences that support a short trade.

EUR/USD Surges into Resistance Ahead of ECBEuro is poised to snap a two-week losing streak with EUR/USD up more than 1.2% since the Sunday open. The advance takes price back into weekly resistance ahead of tomorrow’s European Central Bank rate decision and the focus now shifts to the weekly close for guidance.
Euro plunged more than 2.3% off the June high with price briefly registering an intraweek low at 1.1557 before rebounding. The rally takes EUR/USD into resistance at the objective high-week close (HWC) / high-close at 1.1775- looking for a reaction off this mark with a weekly close above needed to keep the immediate advance viable into the close of the month.
Initial weekly support remains with the 2016 swing high at 1.1616 with the medium-term outlook still constructive while above the March trendline (red). Ultimately, a break below the 2020 / 2022 highs at 1.1497 would be needed to suggest a more significant high is in place / a larger correction is underway with subsequent support seen at the 2024 high close / May low-week close (LWC) at 1.1164.
A breach / close above this pivot zone exposes the upper parallel (blue), currently near 1.1840s, with the next major technical consideration eyed at 1.1917-1.2020- a region defined by the 100% extension of the 2022 advance and the 38.2% retracement of the 2008 decline (area of interest for possible top-side exhaustion / price inflection IF reached). Subsequent resistance objectives eyed at the 2021 HWC at 1.2227 and the 2018 high-close at 1.2456.
Bottom line: Euro rebounded just ahead of the March uptrend with the rally now testing the yearly high-close ahead of the ECB- watch the Friday close with respect to 1.1775. From a trading standpoint, a good zone to reduce portions of long-exposure / raise protective stops- losses would need to be limited to this week’s low IF price is heading higher on this stretch with a close above the upper parallel still needed to fuel the next major leg of the advance.
-MB

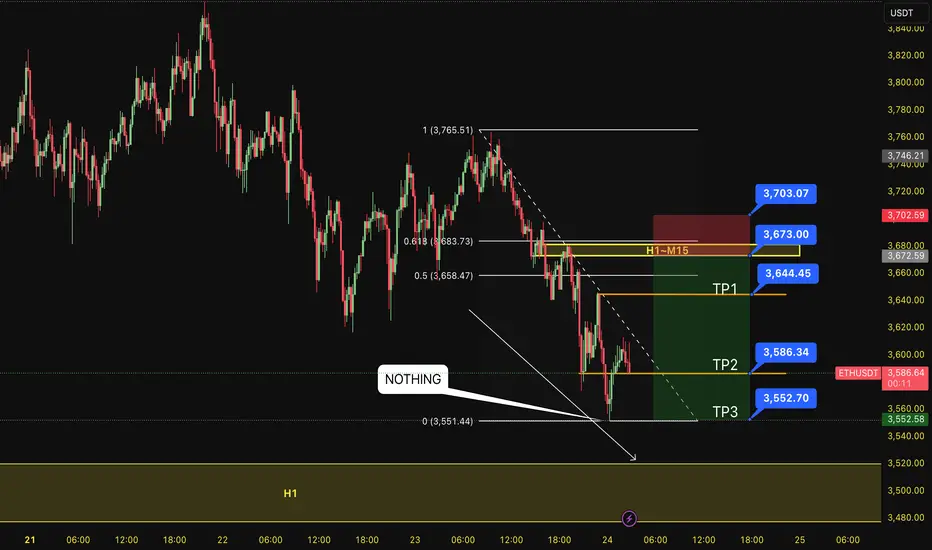
SELL ETH 24.7.2025Confluence trade order: SELL at H1~M15
Type of entry: Limit order
Reason:
- The bottom doesn't touch anything. It is expected to continue to decline into H1.
- Keylevel H1~M15~FIB 0,5-0,618
Note:
- Management of money carefully at the price of bottom (3,644)
Set up entry:
- Entry sell at 3,673
- SL at 3,703
- TP1: 3,644
- TP2: 3,586
- TP3: 3,552
Trading Method: Price action (No indicator, only trend and candles)
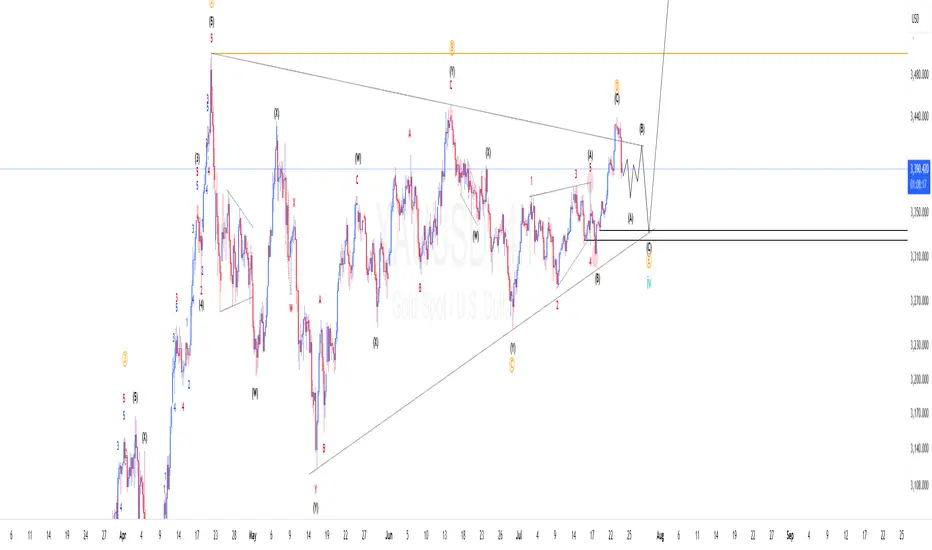
XAUUSD Elliotwaves updateWe are yet to complete wave 4. So far the structures supports the triangle correction and price completed wave "d" and started final wave "e". If we are correct we should expect price make another 3 waves down to complete wave 4 and then resume the bullish momentum. To take advantage of the overall trend one should find areas where price has high probability of finding support to take the trade.
PLTR moving higherPLTR expected to move higher.
The price is bouncing off the 20MA and respecting it.
Making new higher/highs and higher lows.
Earnings is due shortly, which could have a negative impact to the price.
However, the long term outlook for the company is still strong.
Anyone else have thoughts on this stock?

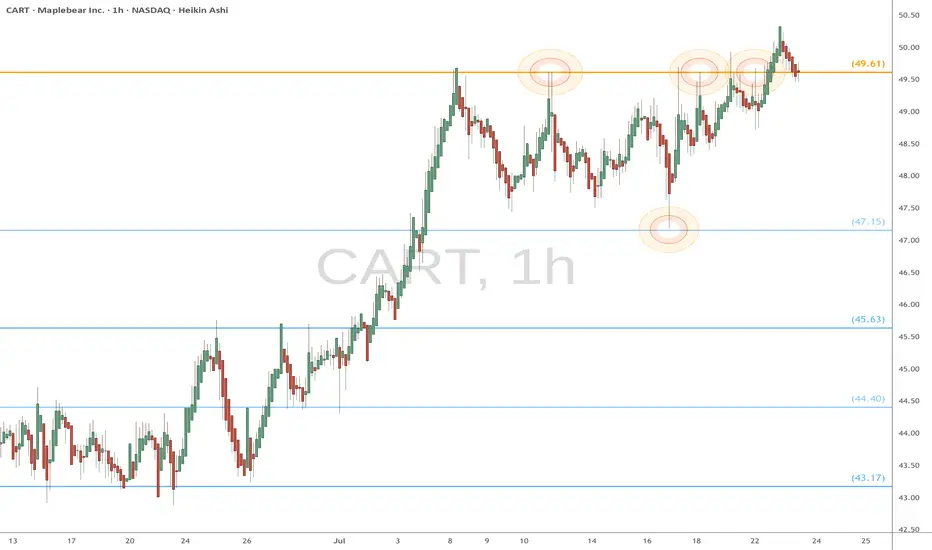
CART watch $49.61: Proven Golden Genesis fib holding up new ATHCART has been struggling against a Golden Genesis at $49.61
Many PINGs have made it clearly visible to the whole world.
If the Break-n-Retest holds, it should start next major leg up.
.
Previous Analysis that NAILED this exact fib for a MASSIVE short:
Hit BOOST and FOLLOW for more such PRECISE and TIMELY charts.
=========================================================
.
AUDJPY Wave Analysis – 23 July 2025- AUDJPY reversed from support zone
- Likely to rise to resistance level 97.40
AUDJPY currency pair recently reversed up from the support zone located between the pivotal support level 95.55 (former monthly high from March and May), 20-day moving average and support trendline of the daily up channel from May.
This support zone was further strengthened by the 38.2% Fibonacci correction of the upward impulse from June.
AUDJPY currency pair can be expected to rise to the next resistance level 97.40, former monthly high from February, which also stopped the earlier impulse wave earlier this month.

NZDUSD Wave Analysis – 23 July 2025
- NZDUSD reversed from support zone
- Likely to rise to resistance level 0.6100
NZDUSD recently reversed up from the support zone located between the key support level 0.5920 (which stopped wave 4in the middle of June), lower daily Bollinger Band and the support trendline of the daily up channel from April.
The upward reversal from this support zone started the active intermediate correction (2).
Given the clear daily uptrend, NZDUSD can be expected to rise to the next resistance level 0.6100, target price for the completion of the active correction (2) (which has been reversing the price from June).

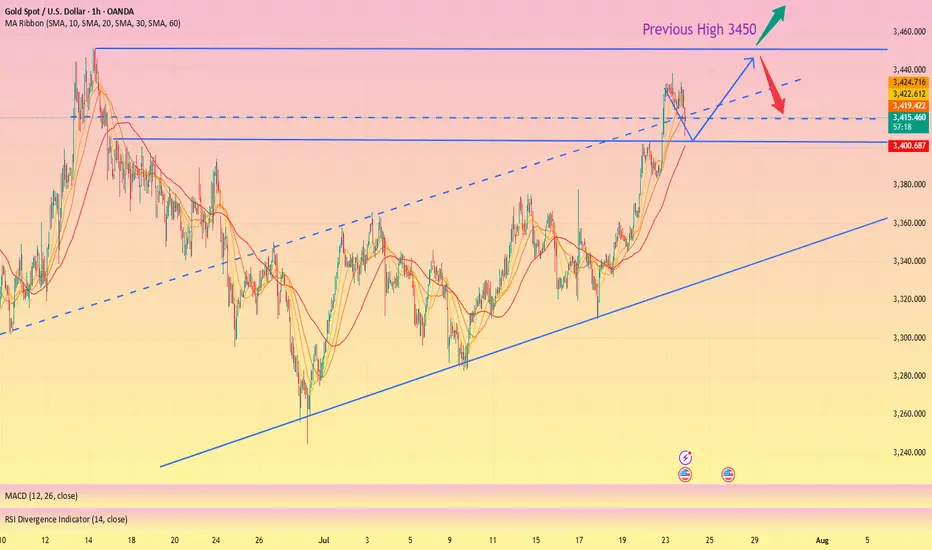
Perfect profit on short position, long TP 3450#XAUUSD
Gold is in an upward trend from the daily chart. From the technical indicators, the SMA5-SMA10 moving averages are golden crosses, BOLL opens upward, the K line runs on the upper track of the daily Bollinger Band, and the MACD continues to increase, indicating that the bullish trend remains unchanged📈.
The approaching August 1st tariff deadline, coupled with uncertainties such as the Federal Reserve, provide short-term support for gold🔍.
📊The current lower support is at 3410-3400. If it falls back to this level during the day, you can consider going long. Gradually check 3430 and 3440 on the upside, and pay close attention to the breakthrough of the 3450 level🏅. If it effectively breaks through 3450, gold is expected to break through the historical high. If it encounters resistance near 3450 as in the previous trend, you can consider shorting📉.
🚀BUY 3410-3400
🚀TP 3430-3440
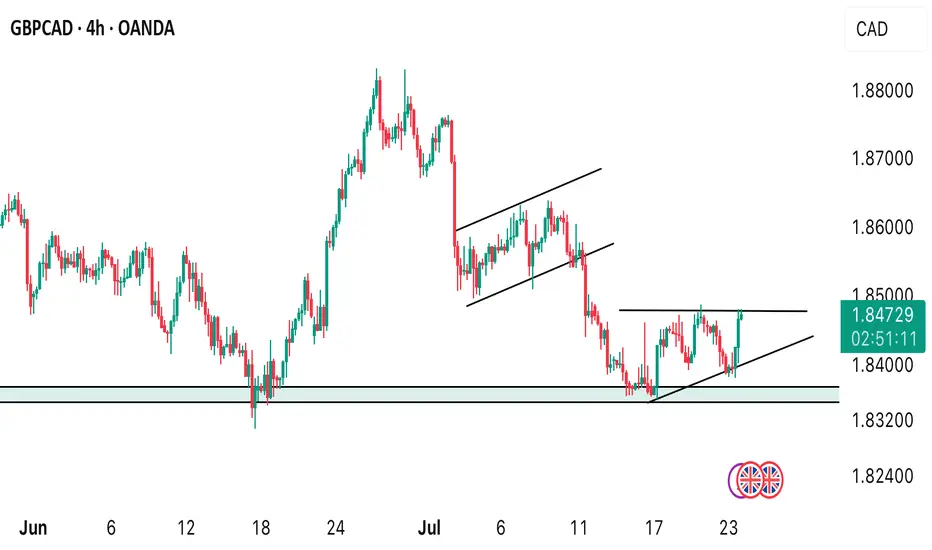
GBPCAD H4 TIMEFRAME. BIG MOVE IS EXPECTED!From the H4 timeframe, price aggressively pushed to the support level of 1.83460 we’re waiting for the next update on price to either see a rebound around the support level or a break below the level. We keep a close watch.
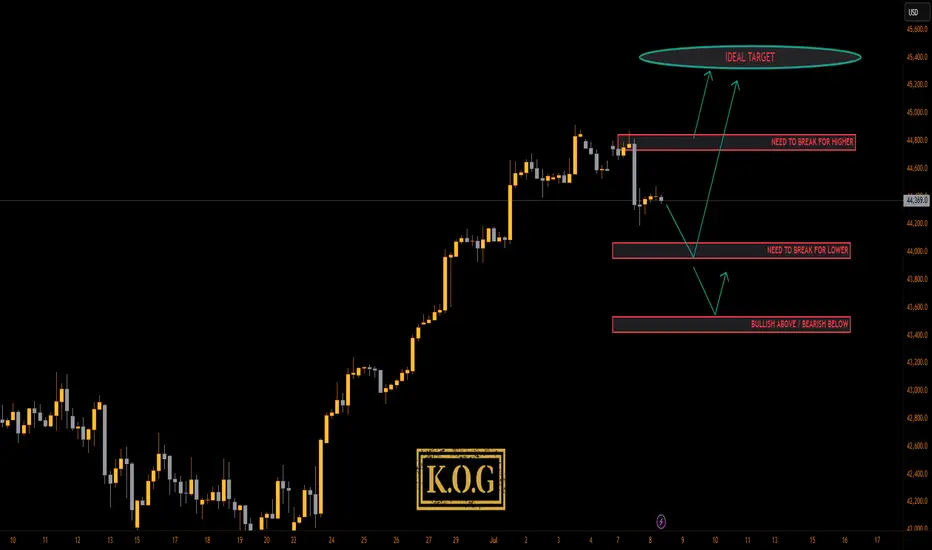
KOG - US30US30
Looking at this we have a clean reversal in play suggesting we’re going to get lower order regions before a potential RIP. The red boxes have been added and may give us opportunities to capture the tap and bounces on the smaller TFs.
If we can support lower, we could very well see this push up into the ideal target level we have illustrated.
Please do support us by hitting the like button, leaving a comment, and giving us a follow. We’ve been doing this for a long time now providing traders with in-depth free analysis on Gold, so your likes and comments are very much appreciated.
As always, trade safe.
KOG