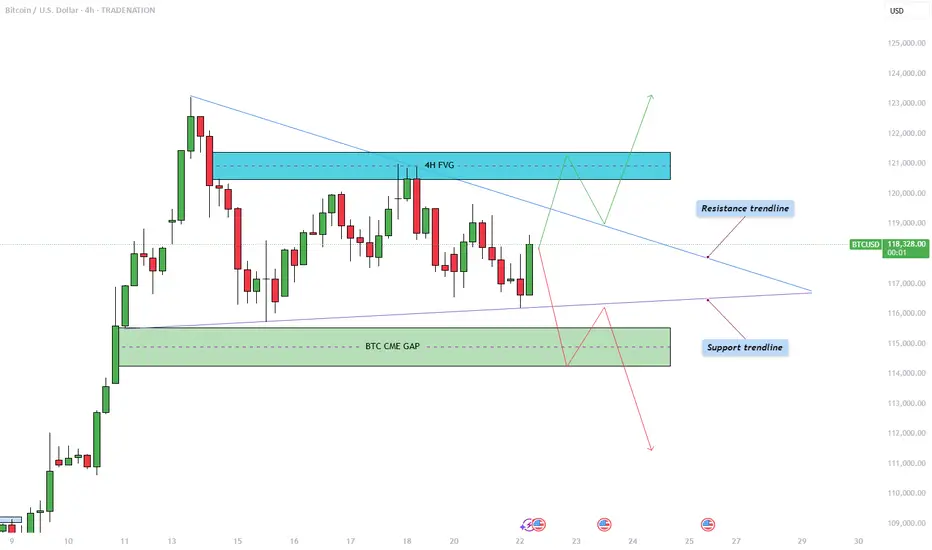
Bitcoin - Triangle pattern consolidation!The Bitcoin price action is currently coiling within a symmetrical triangle pattern on the 4-hour chart, as illustrated in the chart provided. After a significant bullish move earlier this month, BTC has now entered a phase of consolidation, marked by a series of lower highs and higher lows. This has formed a triangle pattern, suggesting an imminent breakout as price nears the apex. The upper boundary of the triangle acts as dynamic resistance, while the rising lower trendline provides firm support. Given the preceding upward momentum leading into this consolidation, the bias slightly favors a breakout to the upside, though the market can always surprise.
Bullish Scenario
In the bullish case, Bitcoin would need to break convincingly above the descending resistance trendline. Should that occur, the next key level to watch lies within the 4-hour bearish Fair Value Gap (FVG) between $120,500 and $121,400. This region represents an area of inefficiency where price moved rapidly in the past, and it is likely to attract selling pressure again. Bulls would ideally aim to reclaim this zone with strong momentum and potentially use it as support in a retest scenario. A successful retest of the triangle’s upper boundary could also trigger a liquidity grab above recent highs, particularly above the all-time high levels.
Bearish Scenario
On the flip side, a bearish breakout would involve BTC breaking below the ascending support trendline. If this happens, the most probable downside target would be the CME gap left behind from two weekends ago, located between $114,300 and $115,500. This price gap occurred due to the discrepancy between Friday’s closing price and Sunday’s opening price on the Chicago Mercantile Exchange, often a magnet for price reversion. After this gap is filled, it is possible that BTC sees a short-term bounce to retest the triangle from below, before potentially continuing lower to address further imbalances in price action.
How to Confirm a Valid Breakout
Trading triangle patterns can be deceptive, as BTC often exhibits false breakouts designed to trap traders on the wrong side. To confirm a valid breakout, it's crucial to observe at least a few 4-hour candles closing decisively above or below the triangle boundaries. Additionally, breakout strength should be accompanied by a noticeable increase in volume. A breakout without volume confirmation is often a sign of a fake move, and entering trades under such conditions can be highly risky.
Final Thoughts
BTC is currently consolidating within this symmetrical triangle formation, signaling a period of indecision and potential volatility ahead. While both bullish and bearish scenarios are plausible, it is essential to wait for clear confirmation before committing to a position. Patience and discipline are key, especially when navigating patterns prone to fake-outs. For now, remaining on the sidelines until a confirmed breakout occurs may be the most prudent strategy.
--------------------------
Disclosure: I am part of Trade Nation's Influencer program and receive a monthly fee for using their TradingView charts in my analysis.
Thanks for your support. If you enjoyed this analysis, make sure to follow me so you don't miss the next one. And if you found it helpful, feel free to drop a like and leave a comment, I’d love to hear your thoughts!
Support and Resistance
The callback continuity is poor, and the bulls are still strong📰 News information:
1. Geopolitical situation
2. Tariff retaliation
📈 Technical Analysis:
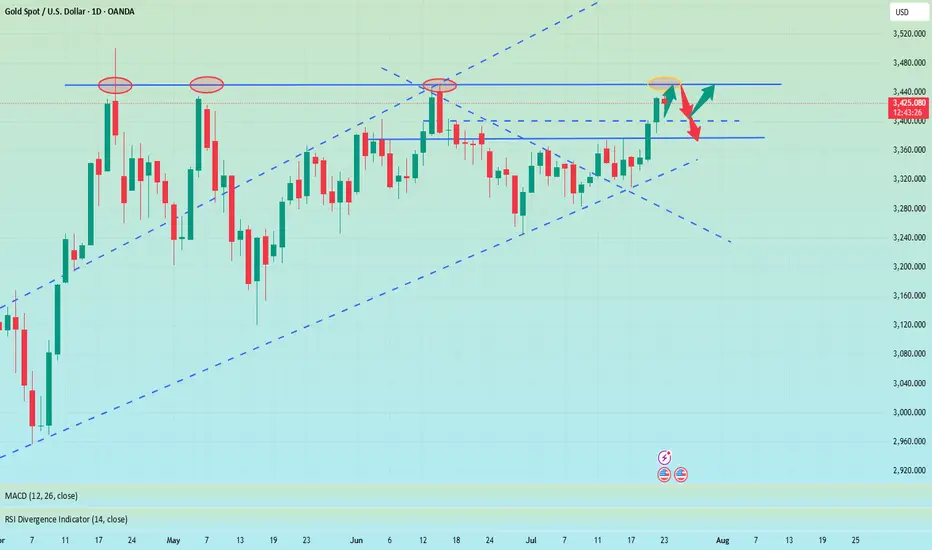
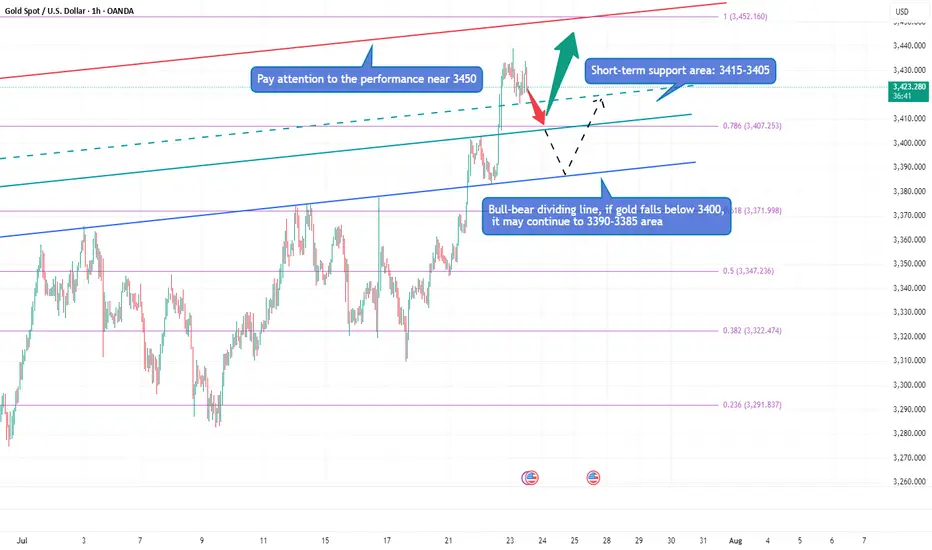
Trump continued to lash out at the Fed, but seemed to have backed off on whether to remove Fed Chairman Powell. The continuous rise of the gold index, once close to 3440, also ushered in a new high in more than a month. Next, we need to pay attention to whether gold can reach the 3450 mark.
Judging from the daily chart, there were three times when it touched around 3450 and then fell back. If it breaks through and stabilizes above 3450 this time, the historical high of 3500 may be refreshed. If it cannot effectively break through 3450, the probability of subsequent retracement is still very high.
From the hourly chart, the bottom support is almost at 3405-3400. However, the recent rhythm belongs to the consolidation of the Asian and European sessions, the US session has begun to rise, and the risk of serious overbought data indicators is still there. This is why I told everyone in the morning that we need to be vigilant about the current rise. Waiting for a pullback to go long is relatively more stable. I also explained in the morning that if it falls below 3405-3400, the decline may continue to around 3385. After all, the fundamental purpose of our trading is to make a profit, so we must minimize the foreseeable risks to the greatest extent possible.
On the whole, if there is an obvious stop-loss signal at 3405-3400, you can consider going long and looking at 3450. Once it falls below 3400, don't chase it easily, and pay attention to the possibility of a retracement below 3385.
🎯 Trading Points:
BUY 3405-3400
TP 3440-3450
In addition to investment, life also includes poetry, distant places, and Allen. Facing the market is actually facing yourself, correcting your shortcomings, facing your mistakes, and exercising strict self-discipline. I share free trading strategies and analysis ideas every day for reference by brothers. I hope my analysis can help you.
FXOPEN:XAUUSD OANDA:XAUUSD FX:XAUUSD FOREXCOM:XAUUSD PEPPERSTONE:XAUUSD TVC:GOLD
Nifty Analysis EOD – July 23, 2025 – Wednesday 🟢 Nifty Analysis EOD – July 23, 2025 – Wednesday 🔴
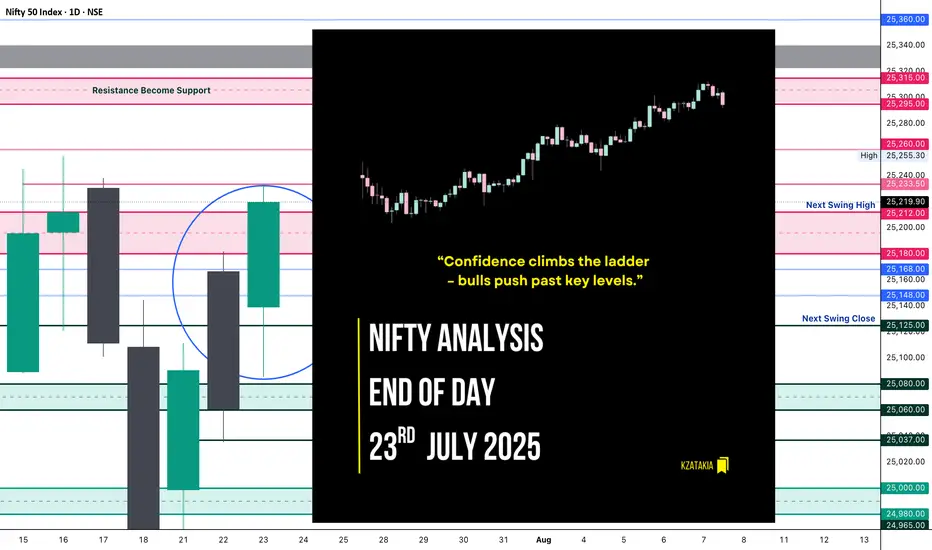
“Confidence climbs the ladder – bulls push past key levels.”
Nifty opened with a Gap Up of 78 points and initially retraced 54 points, finding solid footing around the CPR Zone. Once reclaimed VWAP, the index climbed in a methodical, low-volatility uptrend, breaking one resistance after another: CDH, R1, 25150, PDH, and the key zone 25200~25212 — finally touching the anticipated resistance at 25333, and closing just below that at 25219.90, close to the day’s high.
📌 Flashback from Yesterday's Note:
“If this is truly a retracement, 25K must hold in upcoming sessions, and bulls will need to reclaim 25,200 to regain their grip.”
👉 This expectation played out to perfection today — gradual yet confident bullish strength led Nifty to reclaim 25200 and close above it.
🔍 Today’s close of 25220 is higher than the last 7 sessions, suggesting a bullish shift in structure. However, bulls now face the real test — breaching the 25300 ~ 25350 resistance zone.
🕯 5 Min Time Frame Chart with Intraday Levels
🕯 Daily Time Frame Chart with Intraday Levels
🕯️ Daily Candle Breakdown
Open: 25,139.35
High: 25,233.50
Low: 25,085.50
Close: 25,219.90
Change: +159.00 (+0.63%)
Candle structure analysis:
Real body: Green body = 80.55 pts → strong bullish body
Upper wick: 13.60 pts → very small
Lower wick: 53.85 pts → moderate
Candle Interpretation:
The session opened stable, dipped to 25,085, but strong buyers showed up, helping price climb throughout the day and close near high. A firm green candle, signaling buyers in control.
Candle Type:
A Bullish Marubozu–like candle, not perfectly clean but represents strong continuation momentum.
Key Insight:
Close above 25200 confirms a bullish grip
If price holds above 25220–25250, next push could be towards 25280–25330
Immediate support now moves to 25,120–25,140
🛡 5 Min Intraday Chart
⚔️ Gladiator Strategy Update
ATR: 181.35
IB Range: 64.35 → Medium
Market Structure: Balanced
Trades Triggered:
⏱️ 10:45 AM – Long Entry → Trailing SL Hit (1:2.65 RR)
🔁 Support & Resistance Levels
Resistance Zones:
25,180 ~ 25,212
25,233
25,260
25,295 ~ 25,315
25,340 ~ 25,322 (Gap Zone)
Support Zones:
25,168
25,125
25,080 ~ 25,060
25,037
🧠 Final Thoughts
“Momentum is not magic—it’s built one level at a time.”
Bulls showed strength with control and consistency today. With 25200 reclaimed, they now hold the ball — next challenge lies at the gates of 25300–25350. Will they break through or pause for breath? Tomorrow holds the answer.
✏️ Disclaimer:
This is just my personal viewpoint. Always consult your financial advisor before taking any action.
Gold is surging, can it hit 3500?Due to the trade tensions caused by tariffs and the continued conflict between the White House and the Federal Reserve, gold continued to rise, and the current highest has reached around 3438. Obviously, after gold rose strongly and broke through the 3400 and 3420 areas, the bullish sentiment of gold has been ignited. Next, we need to pay attention to whether gold can test and stand firm at 3450.
Gold is currently extremely strong, and there is basically no room for retracement during the rise. As gold rises, the short-term support below has also moved up to the 3415-3405 area; and the upper side needs to pay attention to the breakthrough of the 3450 mark. If gold continues to break through 3450, then gold has the potential to challenge 3500 again; however, if gold still cannot effectively break through when it touches the area near 3500 again, the sentiment of gold cashing out and leaving the market may be stimulated, resulting in gold There may be room for retracement in the short term. If gold falls below 3400 during the retracement, the decline may continue to the 3395-3385 area.
Therefore, for the next short-term trading, we can first wait for the opportunity for gold to pull back, and then consider going long on gold with the 3415-3405 area as support; if gold does not give a chance to pull back, then when gold first touches the area around 3440-3450, we can consider starting to short gold.
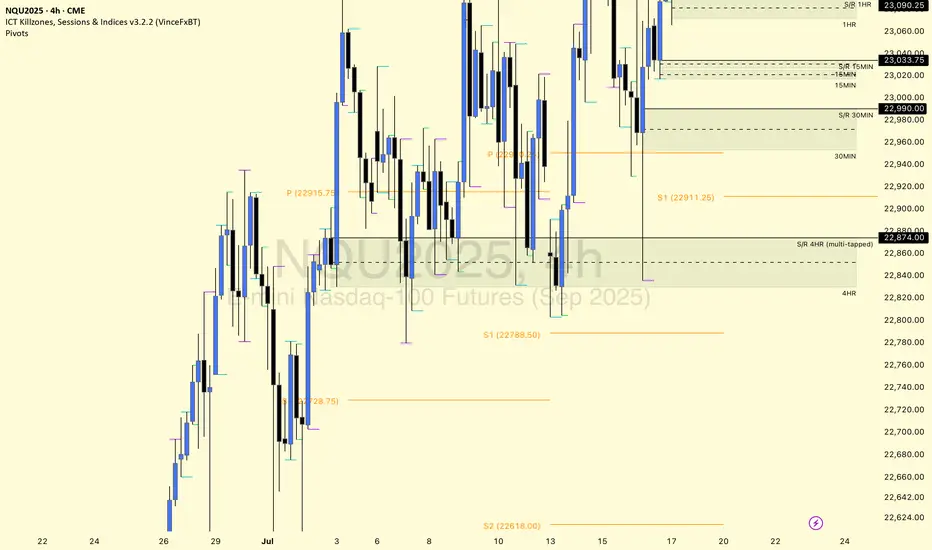
$NQ Supply and Demand Zones 7/23/25tradingview.sweetlogin.com
This SEED_ALEXDRAYM_SHORTINTEREST2:NQ chart is posted for my YouTube community.
The 1HR S/R level is holding price down well for now and we have tapped into the 4HR supply 2x so far. We have built up support that can use as potential bounce levels if* respected, but price needs to reclaim the S/R level and show higher lows. If not, a continuous close at lower lows with rejecting support at demand can show price dropping to 22830-23000 zones. The 4HR demand below has also been tapped into multiple times, so it's only a matter of time before it can no longer hold up (it's pretty much invalidated at this point lol).
AVGO Long1. Broader Market Structure
1.1 Change of Character (CHoCH)
A clear Change of Character occurred at $290.53, where price broke below a prior higher low. This was a key early signal of a potential bearish reversal, as bullish momentum began to weaken and sellers stepped in with conviction.
1.2 Break of Structure (BOS)
Following the CHoCH, a Break of Structure was confirmed at $289.29. Price broke below the prior swing low, confirming a transition to a bearish market structure and validating the developing downtrend.
2. Supply and Demand Zones
Supply and demand zones are pivotal in understanding institutional behavior and predicting likely areas of price reaction.
2.1 Demand Zones (Green)
These zones mark levels where buying pressure has historically been strong, often signaling areas of institutional accumulation.
Zone A: $276.00 – $277.50
Most recent reaction zone with a long lower wick on July 23.
Indicates strong buy-side interest and likely first level of defense if price pulls back.
Zone B: $270.00 – $272.50
A deeper demand zone, formed around July 14–15.
Represents a base for the previous bullish rally and acts as a swing-level support.
Zone C: $269.00 (extreme low)
A structural low marking the last major demand level before a trend breakdown.
A violation here would shift sentiment toward a longer-term bearish outlook.
2.2 Supply Zones (Red)
These are areas of historical selling pressure, often aligning with distribution phases or resistance from unfilled institutional sell orders.
Zone X: $282.50 – $284.00
Formed during the sharp selloff on July 22.
The first upside resistance where sellers may re-enter.
Zone Y: $288.00 – $290.53
High-timeframe supply aligning with the CHoCH and swing high.
Significant distribution zone that must be broken decisively to confirm bullish reversal.
3. Price Action Within the Bordered Region
Price is currently trading around $279.58, just above the local demand zone.
Expecting a pullback into the $276–$277.50 zone (Zone A), allowing liquidity collection and re-entry from institutional buyers.
If this demand zone holds and price forms a higher low, a bullish continuation is likely—targeting the $282.50–$284.00 supply zone.
A further break above this area could attempt to revisit the macro supply at $288–$290.53.
Invalidation: A clean break and close below $276.00 would expose the price to deeper downside into Zone B or Zone C.

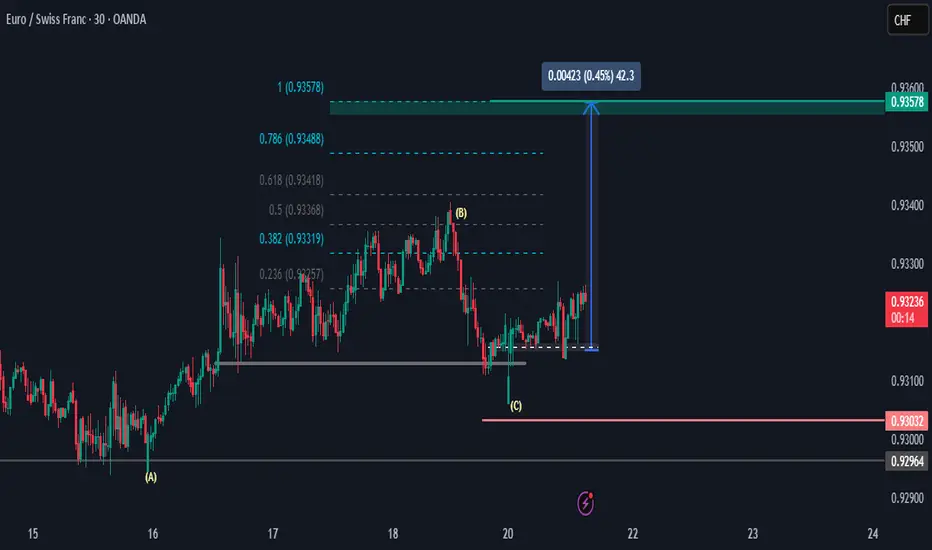
EURCHF Price Is looking UpHi there,
The EURCHF looks bearish at the M30, with the first resistance target potentially being 0.93319. I anticipate for the price to reach above area (B) into the 0.93419 price area for a potential push up to the 0.93488 area, and if momentum is strong in the higher time frames, then the bias is set for 0.93578.
Happy Trading,
K.
Not trading advice.
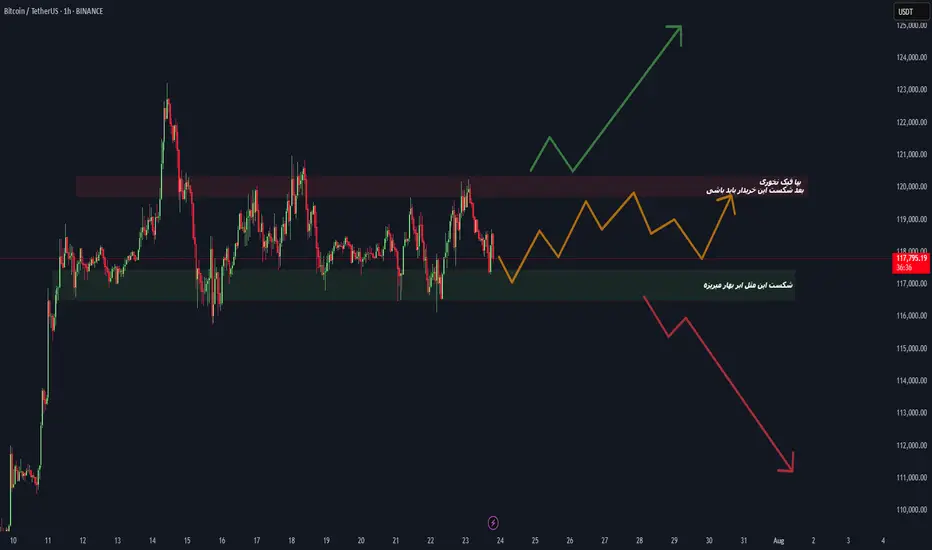
BTC at Make-or-Break Level! Which Side Are You On?#Bitcoin #BTCUSDT #CryptoTrading #TradeWithMky
📉 Scenario 1 – Bearish Breakdown
If BTC loses the green zone (~117K), expect a heavy drop toward 113K and beyond. This is a key demand zone — break it, and bears dominate.
📈 Scenario 2 – Bullish Reversal
Watch for accumulation between the green & red zones. A breakout above the red supply zone (~119K) will signal buyers are back in charge.
🗣️ As the chart says: "بیا فیک نزن، بعد شکست این محدوده باید بخری!"
🚀 Whether you're a breakout trader or a range player — this is the zone to watch.
📊 Chart by TradeWithMky — Where Altcoins Speak Louder than Bitcoin!
👇 Share your thoughts and setups below! Let's ride this move together.
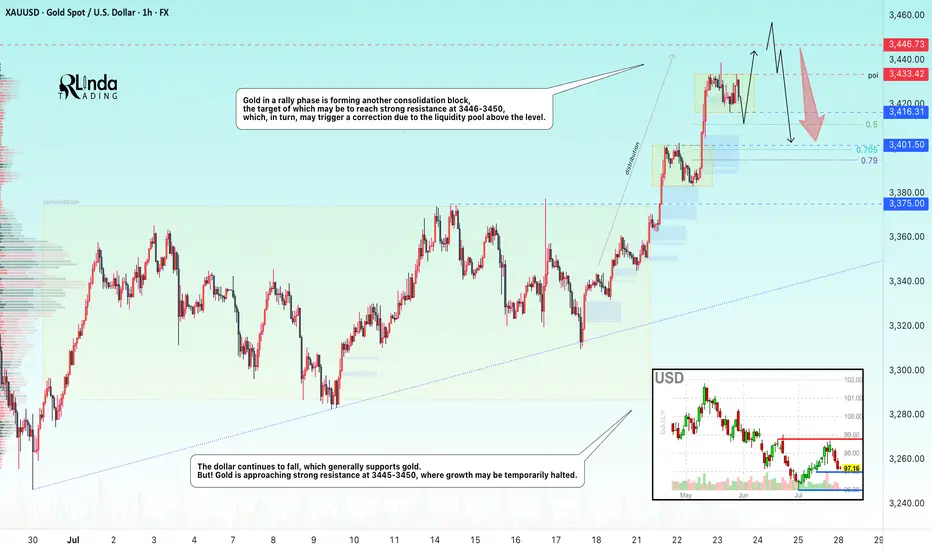
GOLD → Consolidation before the next jump to 3450?FX:XAUUSD continues to rally, with the price updating its local high to 3438 and moving into consolidation, possibly for another jump...
After hitting a five-week high of $3,438, traders are taking a break. Optimism is fuelled by Trump's statements about the largest deal with Japan and negotiations with Canada, but uncertainty about the details of the agreements and political instability in Japan are keeping caution in check. The market is waiting for further signals on trade and political issues, which remain key factors for gold.
Technically, the dollar continues to fall, which generally supports gold. But! Gold is approaching strong resistance at 3445-3450, where growth may be temporarily halted.
Resistance levels: 3433, 3446
Support levels: 3416, 3401, 3375
As part of a local correction, gold may test consolidation support or 0.5-0.7f before continuing to rise. There are quite a few orders in the 3433-3446 zone, and it will be difficult to break through this area to reach the target. Consolidation before this level may help the rise to continue.
Best regards, R. Linda!
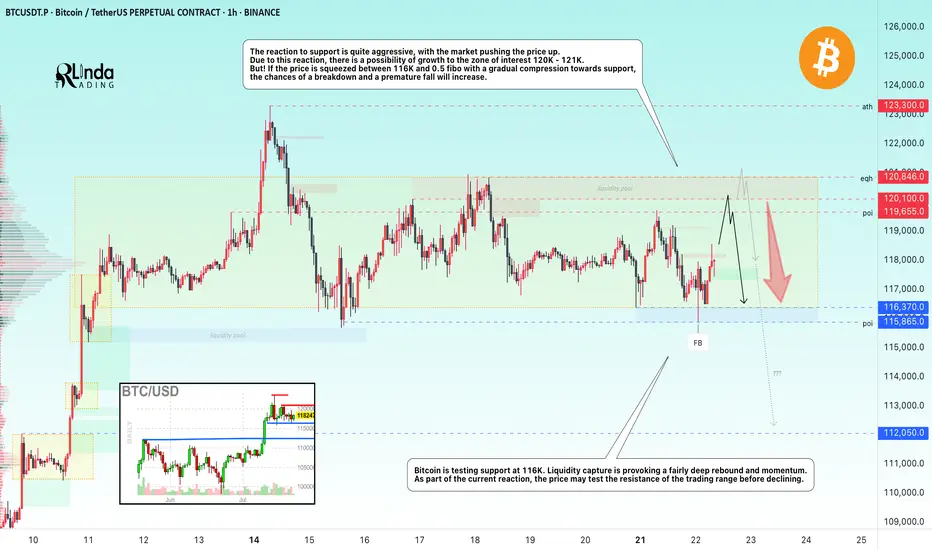
BITCOIN → Consolidation and compression to 116K. Correction?BINANCE:BTCUSDT.P continues to consolidate, with the price testing support at 116K, leaving behind the zone of interest at 120K-121K. Are there any chances for further growth?
(Alternative scenario (if growth to 120K does not occur))
Fundamentally, there is nothing particularly new, and the hype surrounding Bitcoin is stagnating. Technically, on D1, consolidation is underway with pressure from bears against the backdrop of an outflow of funds into altcoins. However, the dominance index is starting to rise, which could trigger some correction in the market. The price on the working timeframe, without updating local highs, is testing lows, and the latest retest of the liquidity zone is provoking a fairly aggressive reaction that could bring the price to retest the zone of interest at 120K-121K.
But! If the price is squeezed between 116K and 0.5 Fib with a gradual squeeze towards support, the chances of a breakdown and a premature fall will increase.
Support levels: 116370, 115860
Resistance levels: 119650, 120100
Technically, the market needs a breather or correction, which is generally a sign of health. The nuance with Bitcoin is that below 115860 there is no support until 112K, and if the market breaks the current consolidation boundary, the further correction could be quite deep. In the current situation, I do not yet see any drivers or reasons for another rally.
Best regards, R. Linda!
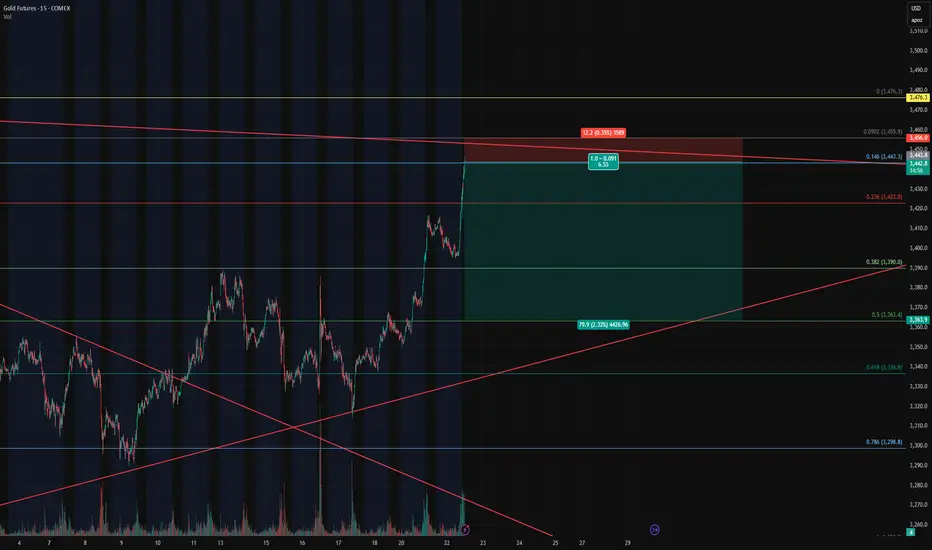
Gold Futures – Closing Longs and Flipping Short at Key Fib🔴 Gold Futures – Closing Longs and Flipping Short at Key Fib Confluence
Instrument : Gold Futures – COMEX ( COMEX:GC1! )
Timeframe : 15-Minute
New Position : Short
Entry Zone : ~3442
Target : ~3362
Stop Loss : ~3458
Risk/Reward : Approx. 6.5+
Setup Type : Reversal from Overextension / Fib Resistance
💡 Trade Recap & Strategy Shift
We’ve officially closed both our recent long entry and our larger swing long position, locking in substantial profit on this move off the 0.618 retracement.
Now, we’re flipping short based on the following:
Price reached the 0.146 Fib extension from the previous retracement leg, a level often overlooked but powerful when confluence lines up.
Trendline resistance from the upper channel has been tagged.
Momentum is showing early signs of stalling after a strong vertical push — textbook overextension.
The rally into this level lacked divergence or structural buildup, increasing the chance of a snapback.
🛠️ Short Setup Details
Entry: 3442 (after signs of exhaustion near Fib confluence)
Target: 3362 (prior structure + 0.382 retracement)
Stop Loss: 3458 (just above high / resistance zone)
Risk/Reward: 6.5:1 — excellent profile for a countertrend play.
📌 Watch For
A break below 3390 will be key confirmation of momentum shifting back down.
Failure to hold 3442 on a retest will invalidate the short and re-open the door for a squeeze higher to 3476/3480.
With trend exhaustion in sight and high confluence resistance overhead, we’re taking the opportunity to pivot short — fully aware of the volatility this region can bring.
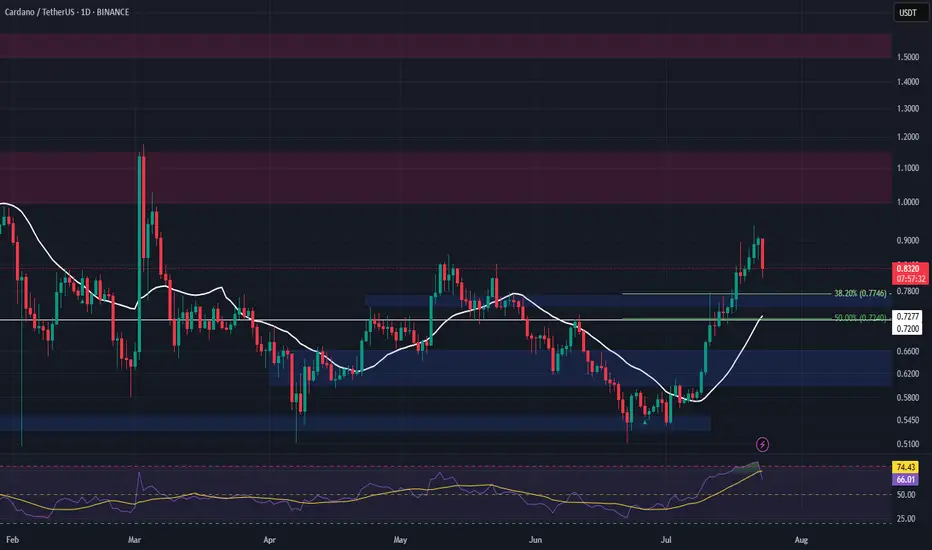
ADA Spot Entry – Pullback Opportunity AheadADA has reached a major resistance zone, and with the broader market appearing overbought, a healthy pullback looks likely. We’re watching for a dip into the next key support area to accumulate for spot holdings.
📌 Trade Setup:
• Entry Zone: $0.75 – $0.77
• Take Profit Targets:
o 🥇 $1.00 – $1.15
o 🥈 $1.50 – $1.60
• Stop Loss: Just below $0.72
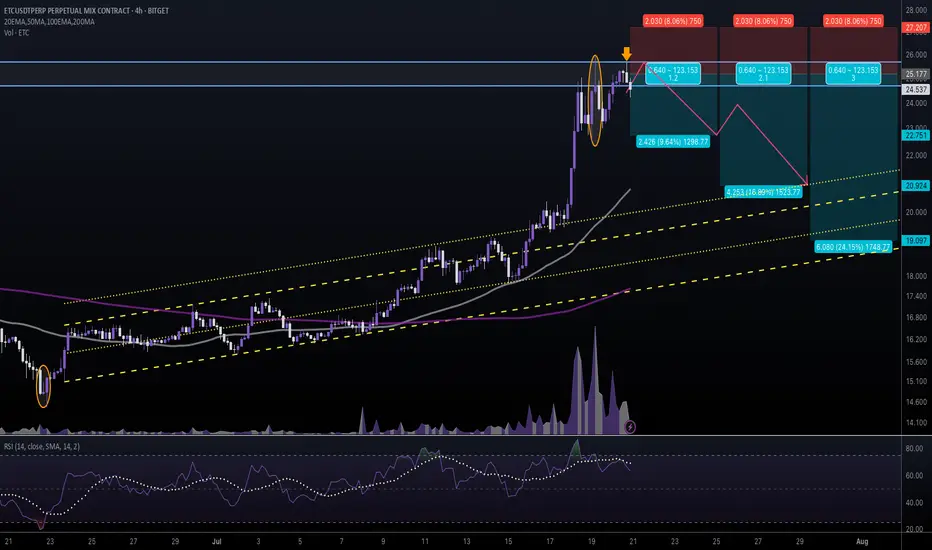
#ETCUSDT #4h (Bitget Futures) Ascending channel retestEthereum Classic printed two evening stars in a row, looks locally topped and ready for correction towards 50MA & 200MA supports.
⚡️⚡️ #ETC/USDT ⚡️⚡️
Exchanges: Bitget Futures
Signal Type: Regular (Short)
Leverage: Isolated (5.0X)
Amount: 5.0%
Entry Zone:
24.679 - 25.675
Take-Profit Targets:
1) 22.751
2) 20.924
3) 19.097
Stop Targets:
1) 27.207
Published By: @Zblaba
CRYPTOCAP:ETC BITGET:ETCUSDT.P #4h #EthereumClassic #PoW #L1 ethereumclassic.org
Risk/Reward= 1:1.2 | 1:2.1 | 1:3.0
Expected Profit= +48.2% | +84.5% | +120.7%
Possible Loss= -40.3%
Estimated Gaintime= 1-2 weeks
Hyperliquid is retesting the $44 level ┆ HolderStatKUCOIN:HYPEUSDT has flipped $0.074 into support. Holding this level could trigger a move to $0.088. Structure favors bulls.

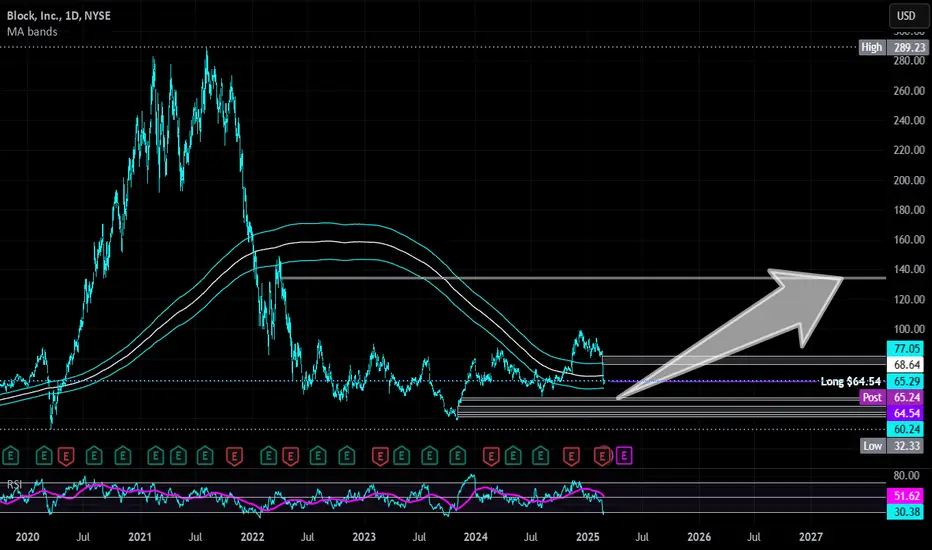
Block | XYZ | Long at $64.84Block's NYSE:XYZ revenue is anticipated to grow from $24 billion in FY2024 to $32 billion in FY2027. With a current price-to-earnings ratio of 13.8x, debt-to-equity ratio of 0.36x, and rising cash flow in the billions, it's a decent value stock at its current price. Understandably, there is some hesitation among investors due to competitive fintech market and economic headwinds. But, like PayPal NASDAQ:PYPL , growth is building.
From a technical analysis perspective, the price dropped to within my historical simple moving average bands. Often, but not always, this signals a momentum change and the historical simple moving average lines indicate an upward change may be ahead. While the open price gaps on the daily chart in the $40s and GETTEX:50S may be closed before a true move up occurs, NYSE:XYZ is in a personal buy zone at $64.84.
Targets:
$80.00
$90.00
$100.00
[*) $134.00 (very long-term)
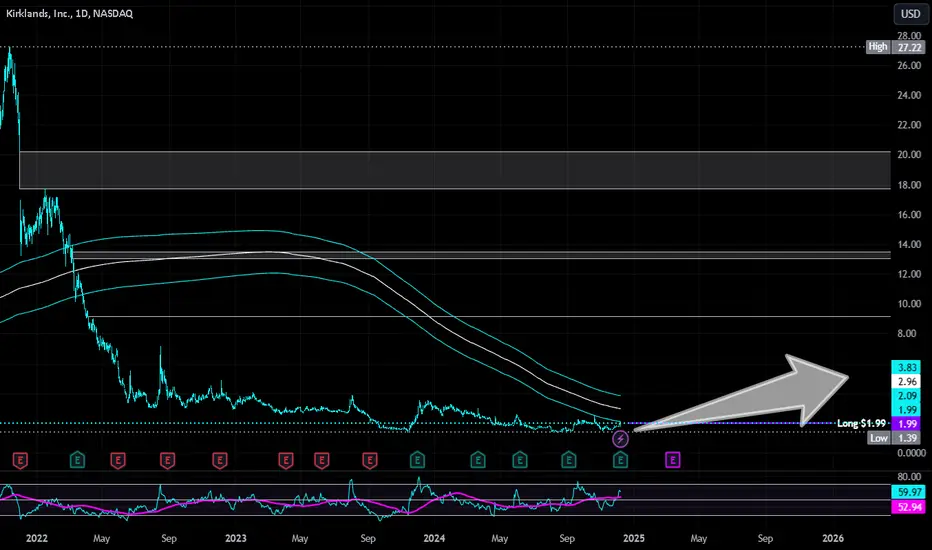
Kirklands | KIRK | Long at $1.99Kirklands $NASDAQ:KIRK. A strong move may be brewing... The historical simple moving average (SMA) is flirting with the price and has yet to break the barrier - which often results in a sharp price increase. The downward trend is finally starting to reverse based on this measure, too. While it may not soar to crazy highs like in 2021, the chart setup is exactly what I like to see for an anticipated move up as it consolidates. A 12M float and 7% short interest could get the ball rolling if/when the price breaks into the historical SMA.
Fundamentally, NASDAQ:KIRK is a small-cap with $114 million in sales. It recently partnered with NYSE:BYON as an exclusive licensee of Bed Bath & Beyond neighborhood stores, positioning the company as a multi-brand retailer. The first Bed Bath & Beyond neighborhood store is planned for a 2025 opening. Could this be the force for a future price move? Time will tell.
At $1.99, NASDAQ:KIRK is in a personal buy zone.
Target #1 = $2.50
Target #2 = $2.75
Target #3 = $3.00
Target #4 = $4.00
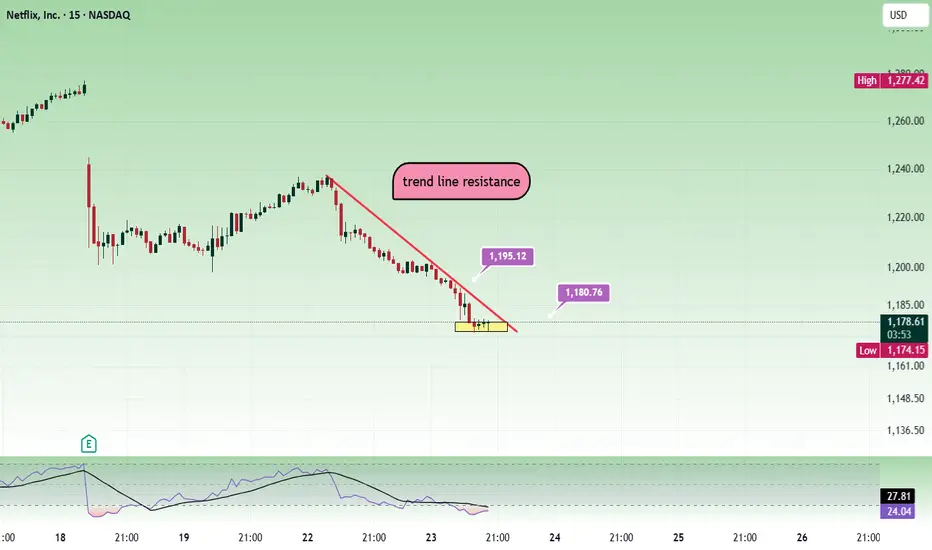
NetflixMay be people are not watching Netflix nowadays and the price is falling. 1200 is a strong resistance.
Sell below 1180 with the stop loss of 1195 for the targets 1165, 1150, 1130 and 1115.
Price can pull back towards 1190 and then fall. Its better to see bearish confirmation and trade.
Always do your own analysis before taking any trade.
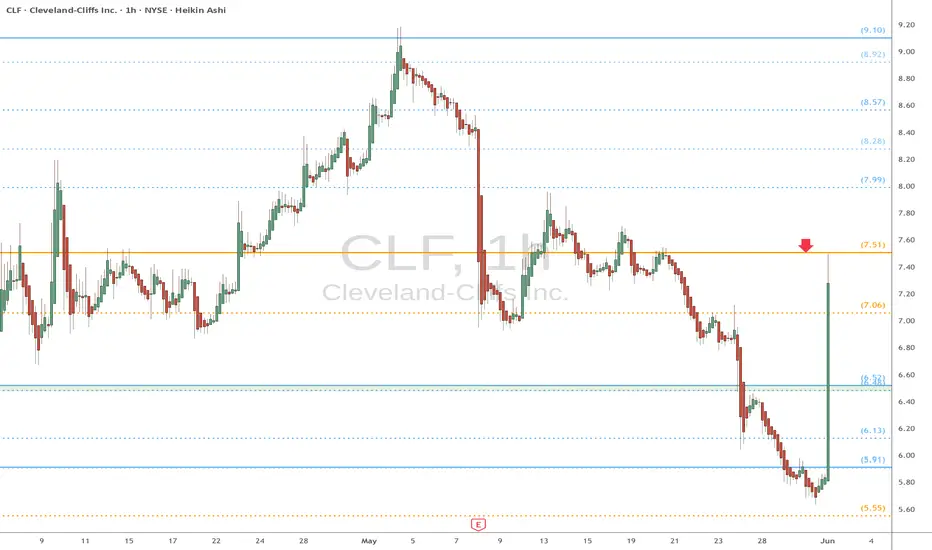
CLF heads up at $7.51: Golden Genesis fib may give a Dip buyCLF shot up strong after Trump increased tariffs on Steel.
It has just hit a Golden Genesis fib that may give us a dip.
Looking for a dip to $7.06 fib or a Break-n-Retest of 7.51
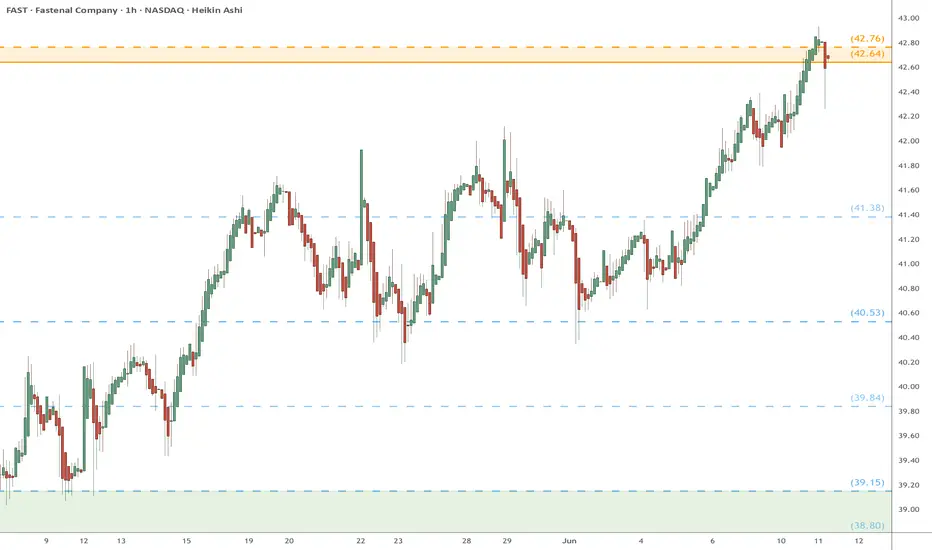
FAST watch $42.64/76: Double Golden zone holding up new ATH FAST has been grinding higher into ATH territory.
Struggling against Double Golden zone $42.64-42.76
Look for a Break-n-Retest as the likely next move.
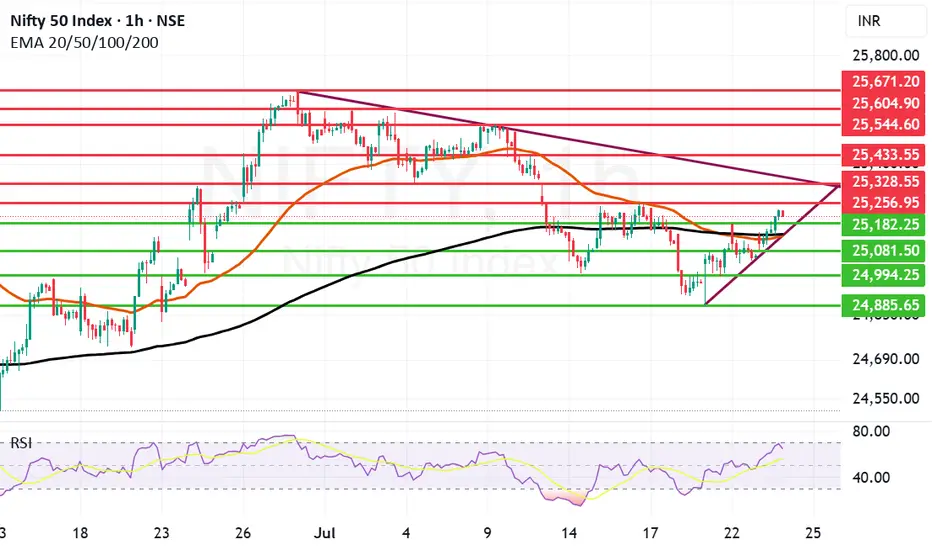
Strong Comeback by Nifty few Resistances ahead.Nifty made a remarkable comeback today ending 159 points up closing at 25219. Infosys has posted better than expected result and as of now the Infosys ADR is up by 1.26%. So if there is a turnaround in the IT sector we can see Nifty fly upwards.
The next resistance ahead of Nifty is at 25256 if we get a closing above this the next will be at 25328. These 2 will be critical resistances to cross. Once we get a closing above 25328 Nifty can target 25433 and 25544. Above 25544 Nifty becomes very strong. In case Nifty is not able to cross 25256 or 25328 levels the supports for Nifty are at 25182. After this zone there is a dual support of Mother and Father line of Hourly chart at 25136 and 25142.
These are very strong supports. (Thus the zone between 25182 to 25136 is full of supports). We hope that these supports are held. In case we get a closing below 25136 Nifty will again fall into bearish territory and can plunge towards 25081, 24994 or even 24885.
The shadow of the candles right now is positive but 2 very important resistances mentioned earlier are yet to crossed so game is in balance but only slightly in favour of Bulls.
Disclaimer: The above information is provided for educational purpose, analysis and paper trading only. Please don't treat this as a buy or sell recommendation for the stock or index. The Techno-Funda analysis is based on data that is more than 3 months old. Supports and Resistances are determined by historic past peaks and Valley in the chart. Many other indicators and patterns like EMA, RSI, MACD, Volumes, Fibonacci, parallel channel etc. use historic data which is 3 months or older cyclical points. There is no guarantee they will work in future as markets are highly volatile and swings in prices are also due to macro and micro factors based on actions taken by the company as well as region and global events. Equity investment is subject to risks. I or my clients or family members might have positions in the stocks that we mention in our educational posts. We will not be responsible for any Profit or loss that may occur due to any financial decision taken based on any data provided in this message. Do consult your investment advisor before taking any financial decisions. Stop losses should be an important part of any investment in equity.
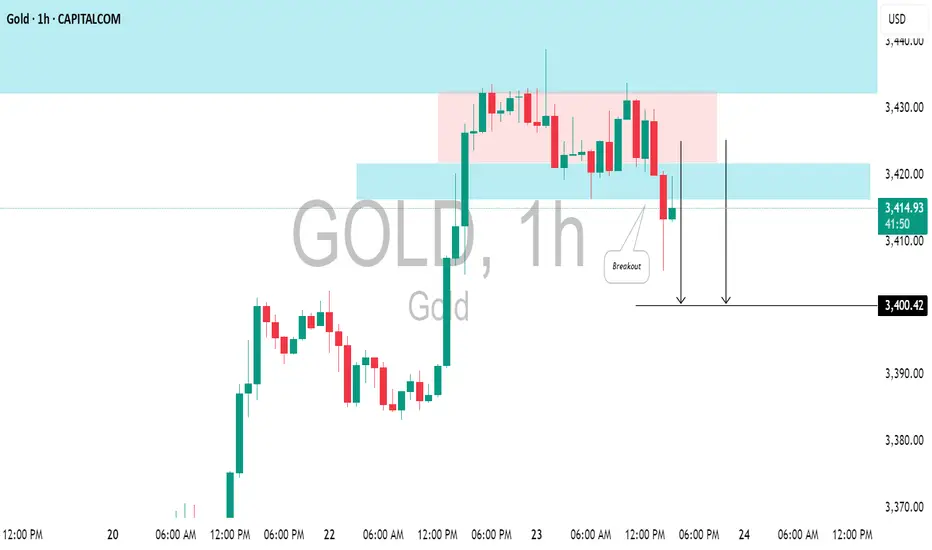
GOLD(#XAUUSD): Pullback From Resistance ConfirmedGOLD could retreat from the highlighted resistance level.
I observed a horizontal trading range pattern following a test of significant intraday resistance, along with a breach of its support level marked by a strong bearish candle.
Target - 3400.
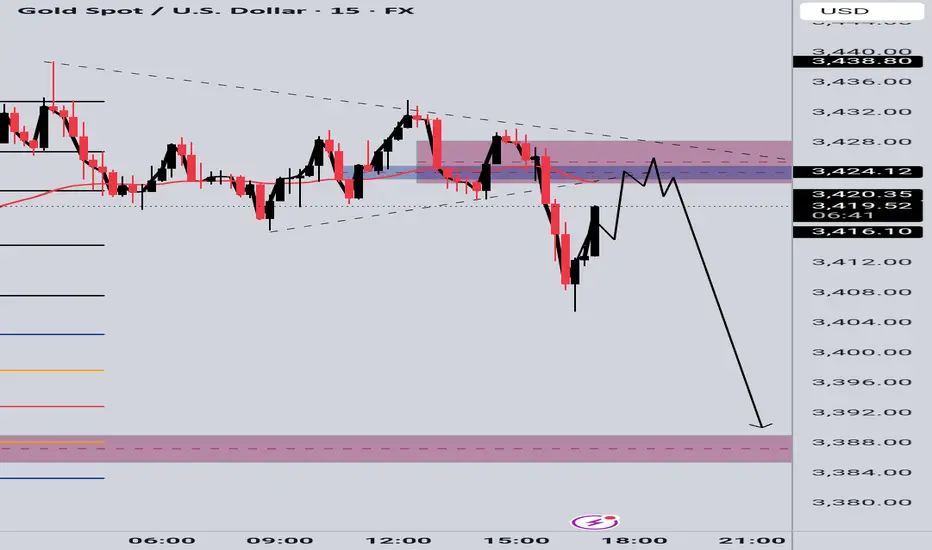
GOLD SELL SETUPWe failed the bullish momentum on previous chart ,now aiming for the continuation to the downside;
🔹 Entry Zone: 3425–3430 (Supply Rejection)
🔸 Trendline Break + Liquidity Sweep Confirmed
🎯 Targets:
— TP1: 3410
— TP2: 3388 (Major Demand Zone)
🔒 Bearish momentum building, watching for continuation toward the lower zone.
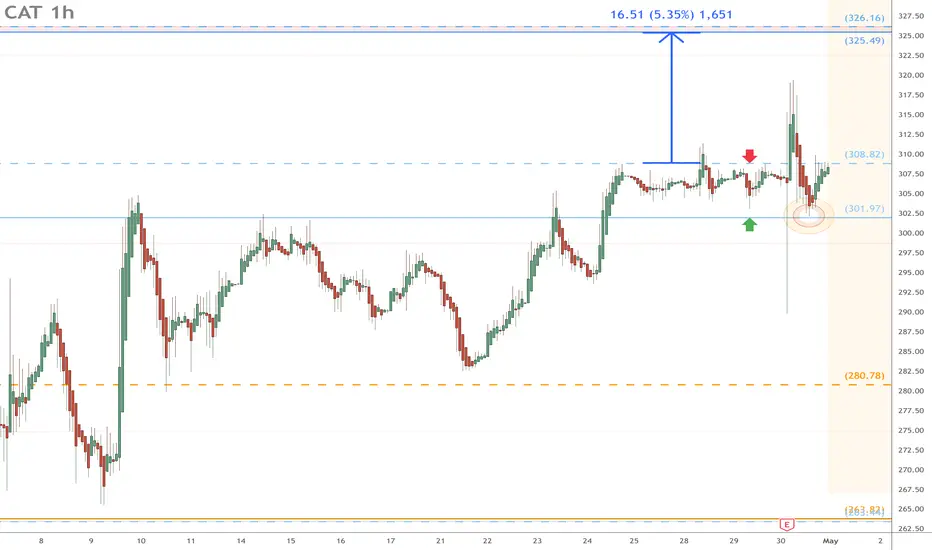
CAT watch $308 above 302 below: Major fibs define range to breakCAT just released Earnings report with small "miss".
Price oscillating between major fibs $301.97-308.82
If Bull, look for a pop to tight zone $325.49-326.16