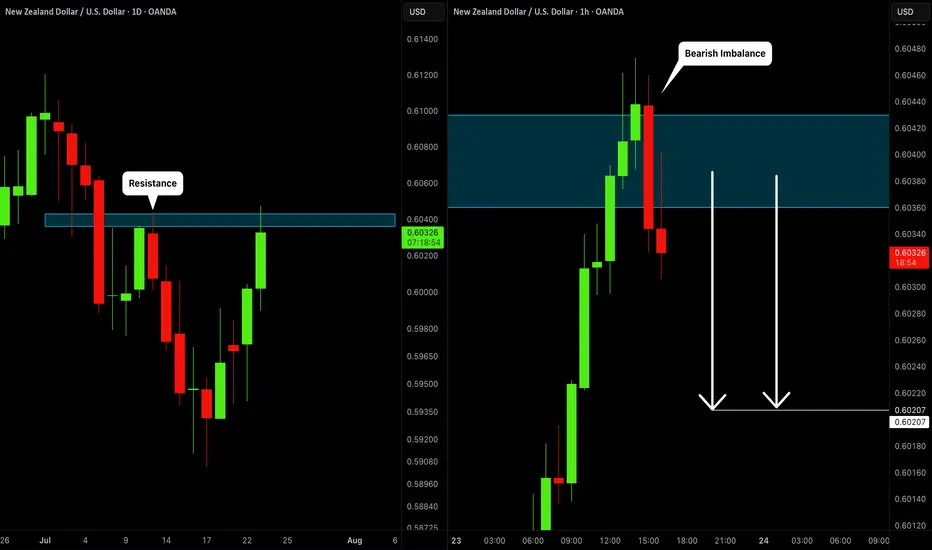
NZDUSD: Time For Pullback 🇳🇿🇺🇸
I think that NZDUSD will retrace from the underlined resistance.
As a confirmation, I spotted a bearish imbalance candle on an hourly time frame
after its test.
There is a high chance to see a retracement.
Goal - 0.602
❤️Please, support my work with like, thank you!❤️
Support and Resistance
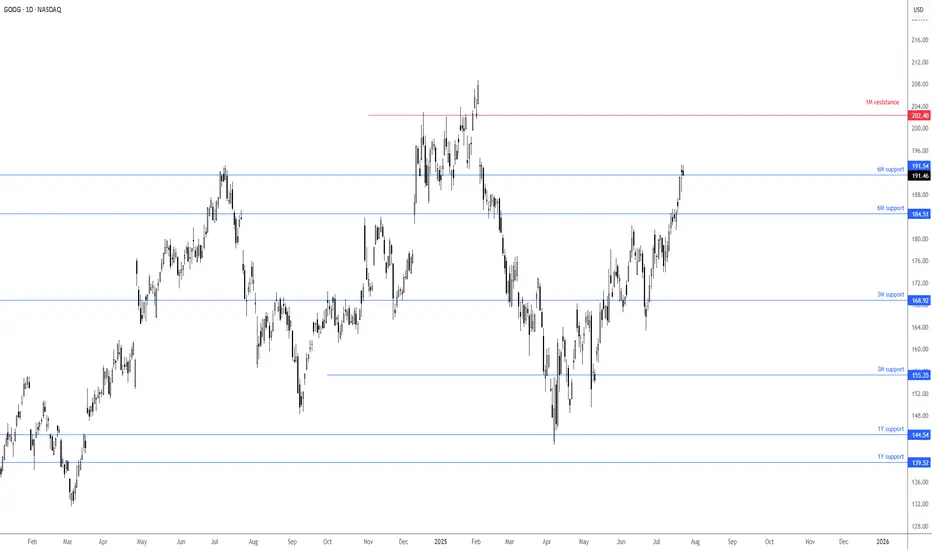
Google trading north of support ahead of earnings!Ahead of today’s Q2 earnings release, you can see the price of Alphabet is trading just above a 6M support at US$191.54. Finding acceptance north of this support level could prompt buyers to change gears and potentially target a 1M resistance level at US$202.40. If price makes it above here, you will likely see the Stock challenge all-time highs of US$208.70, formed in early February this year. Failure to hold above US$191.54, nevertheless, could see price action target 6M support at US$184.51.
FP Markets Research Team.
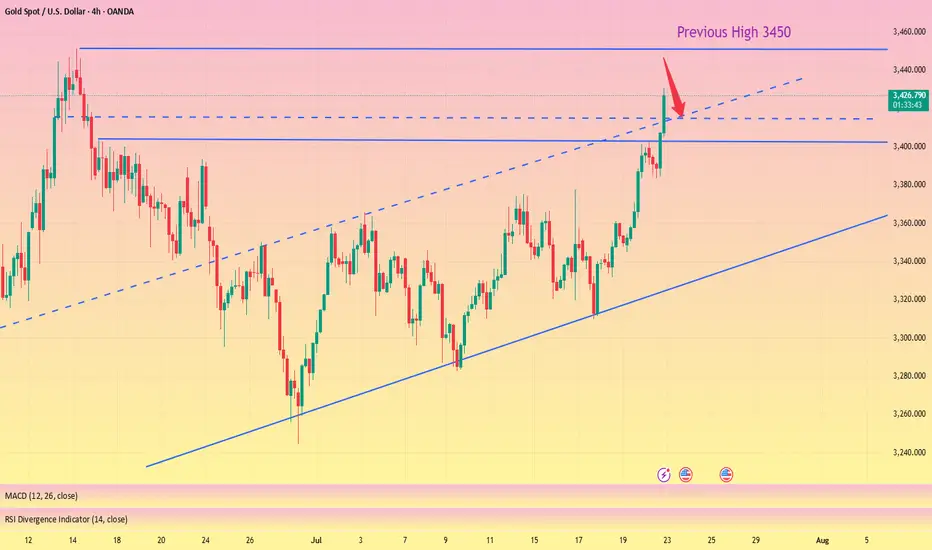
The real target of gold is more than 3400
💡Message Strategy
The United States has recently made frequent moves in global tariff policies. Treasury Secretary Bensont has clearly set August 1 as a hard deadline for tariff negotiations among countries. At present, EU trade negotiations have been decoupled from the issue of sanctions against Russia and Ukraine, while Japan's negotiations are progressing smoothly.
These dynamics reflect that the United States is reshaping the global trade pattern through differentiated strategies, and countries are forced to adjust their economic and trade policies under the pressure of tariffs. As the deadline approaches, gold is facing a test of long and short positions.
The White House's pressure on the Federal Reserve is still fermenting. The US Treasury Secretary said that the Federal Reserve should cut interest rates now, but at the same time said that there is no sign that Powell should resign now. If he wants to leave early, he should do so. Powell gave a public speech yesterday, but to the disappointment of the market, he did not mention monetary policy and the possibility of resignation. However, Trump's pressure on the Federal Reserve has taken effect, and the market has turned its attention to interest rate cuts.
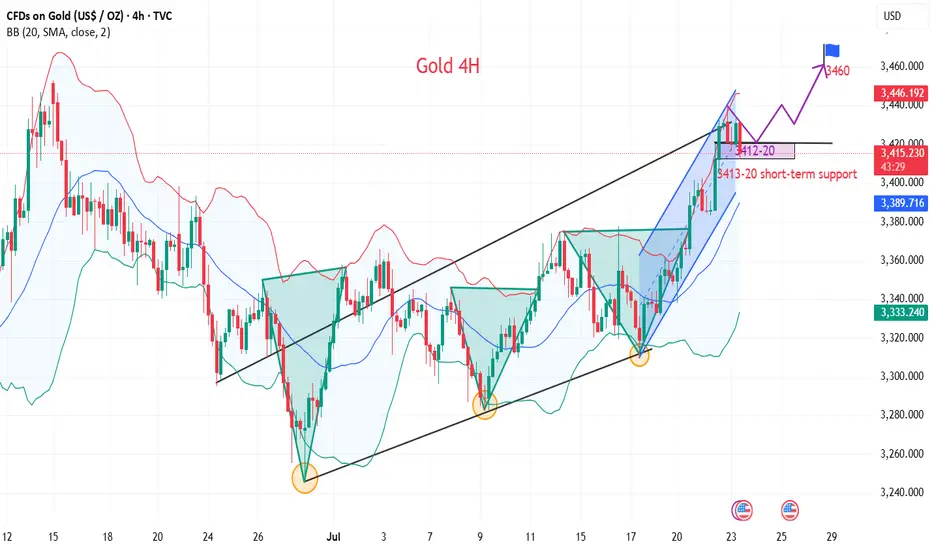
📊Technical aspects
Yesterday, Tuesday, we believed that the trade negotiations between Europe and the United States were on the verge of breaking down, which led to a rise in risk aversion in the market, boosted gold safe-haven buying, and supported the price of gold to a one-month high.
Therefore, we suggest that you take a bullish approach in terms of operation. Pay attention to the support below at $3,380, and pay attention to the breakthrough of $3,402 above. As expected, it broke through to $3,440, reaching our expected profit target.
From the 4H trend structure, gold has been climbing rapidly along the upward channel recently. It broke through yesterday and took the 3400 mark in one fell swoop, reaching our expected target of 3440. At present, gold is blocked and falls back on the channel boundary support.
At the same time, the 1-hour RSI broke through the upward trend line support and tested the resistance again, releasing a callback signal in the short term. It is necessary to pay attention to the possibility of short-term adjustments. Today, we can focus on the key resistance around 3415 and try long opportunities.
💰Strategy Package
Long Position:3410-3420,SL:3390,Target: 3440,3460
Gold breaks new high, expect a pullback in the evening#XAUUSD
After the rapid rise of the previous day, the gold market has fallen into an overbought state, but yesterday's increase of nearly $60 still provided solid support for the bulls. It is expected that the market will show repeated fluctuations in the future⚖️.
In terms of operation, it is recommended to pay close attention to the gains and losses of the 3,400 mark. If it is successfully broken through, it is expected to further test the 3,420-3,425 and 3,450 lines; on the downside, pay attention to the top and bottom conversion support of 3,403📈.
📊At present, you can consider shorting near 3430, defending 3440, and aiming at 3410💡
🚀SELL 3430-3440
🚀TP 3415-3405
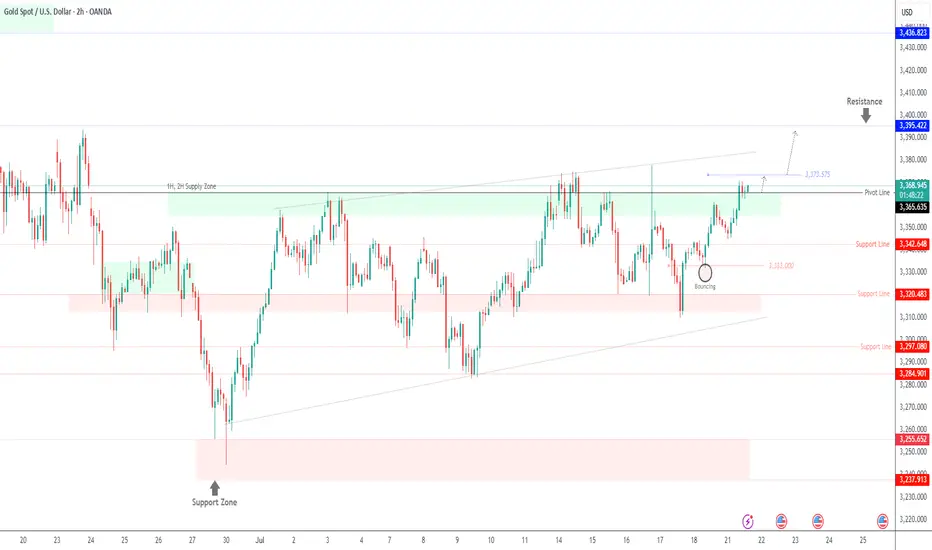
GOLD | Bullish Bias Amid Fed & Trade Policy UncertaintyGOLD | Bullish Bias Amid Fed & Trade Policy Uncertainty
Gold prices edge higher as markets weigh conflicting signals from the Federal Reserve and renewed trade policy uncertainty. Diverging opinions among Fed officials regarding the inflationary impact of President Trump's proposed tariffs have fueled demand for safe-haven assets.
While some members like Waller and Bowman appear open to rate cuts, others remain cautious about lingering inflation risks, adding to market volatility.
Technical Outlook:
Gold maintains bullish momentum above 3365. A break and hold above this pivot supports continuation toward 3375, and if momentum builds, toward 3385 and 3395.
However, any sustained move below 3365 may trigger a bearish correction toward the support zone between 3355 and 3342.
Pivot Line: 3365
Resistance Levels: 3375 · 3385 · 3395
Support Levels: 3355 · 3342
Bias: Bullish above 3365
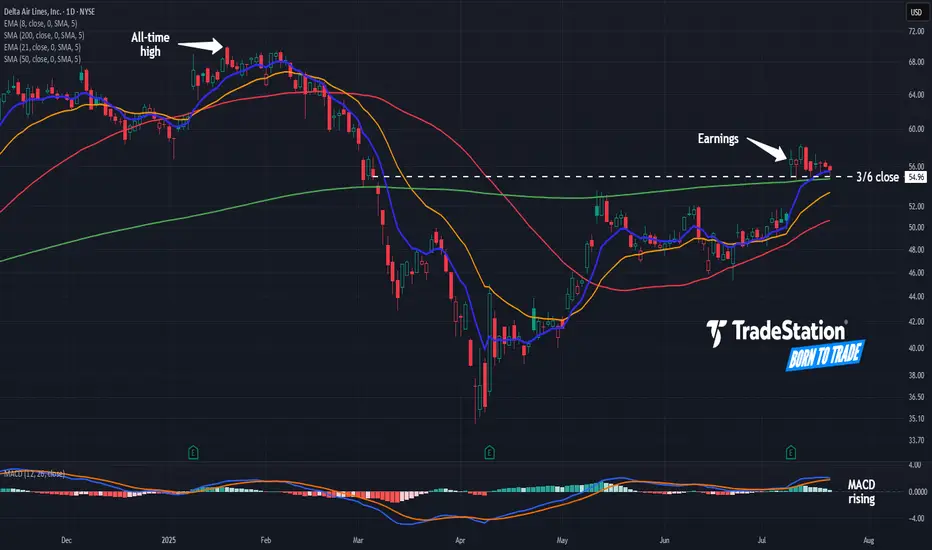
Delta Airlines: Where’s the Pullback?Delta Airlines rallied two weeks ago on strong earnings, and some traders may see further upside.
The first pattern on today’s chart is the tight consolidation pattern since July 10. The lack of pullback could reflect a lack of selling pressure in the transport stock.
Second, DAL has remained above the March 6 closing price of $54.96 and its 200-day simple moving average. Has new support been established above the pre-earnings highs?
Third, the 8-day exponential moving average (EMA) is above the 21-day EMA. MACD is also rising. Those signals may be consistent with short-term bullishness.
TradeStation has, for decades, advanced the trading industry, providing access to stocks, options and futures. If you're born to trade, we could be for you. See our Overview for more.
Past performance, whether actual or indicated by historical tests of strategies, is no guarantee of future performance or success. There is a possibility that you may sustain a loss equal to or greater than your entire investment regardless of which asset class you trade (equities, options or futures); therefore, you should not invest or risk money that you cannot afford to lose. Online trading is not suitable for all investors. View the document titled Characteristics and Risks of Standardized Options at www.TradeStation.com . Before trading any asset class, customers must read the relevant risk disclosure statements on www.TradeStation.com . System access and trade placement and execution may be delayed or fail due to market volatility and volume, quote delays, system and software errors, Internet traffic, outages and other factors.
Securities and futures trading is offered to self-directed customers by TradeStation Securities, Inc., a broker-dealer registered with the Securities and Exchange Commission and a futures commission merchant licensed with the Commodity Futures Trading Commission). TradeStation Securities is a member of the Financial Industry Regulatory Authority, the National Futures Association, and a number of exchanges.
TradeStation Securities, Inc. and TradeStation Technologies, Inc. are each wholly owned subsidiaries of TradeStation Group, Inc., both operating, and providing products and services, under the TradeStation brand and trademark. When applying for, or purchasing, accounts, subscriptions, products and services, it is important that you know which company you will be dealing with. Visit www.TradeStation.com for further important information explaining what this means.
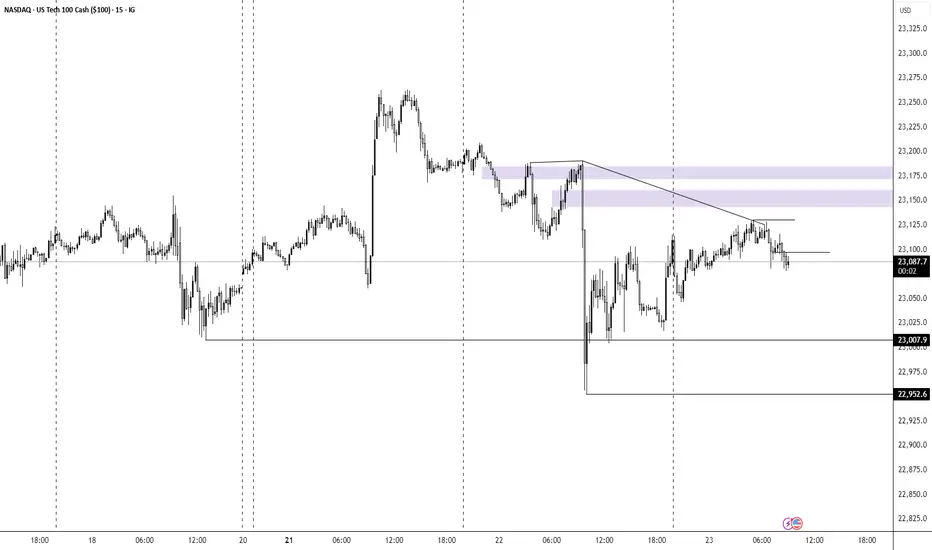
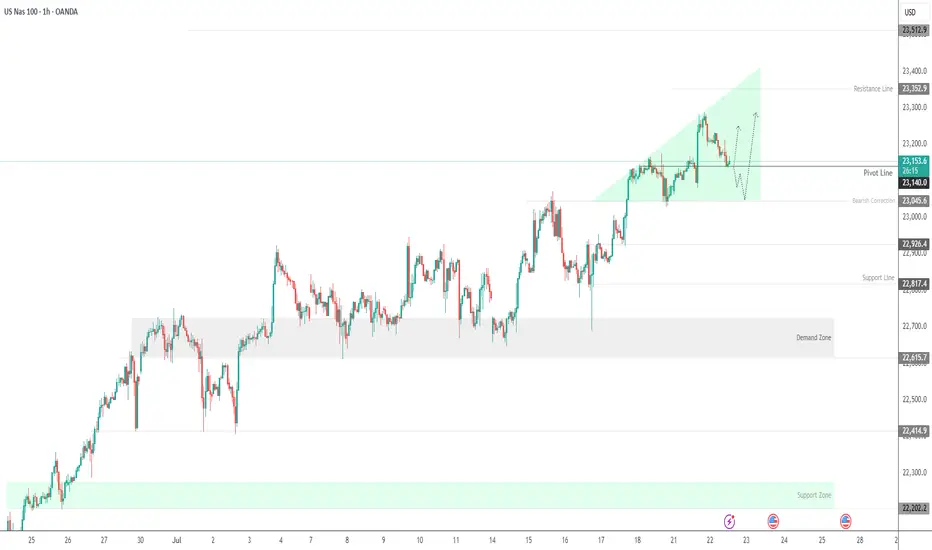
USNAS100 Eyes 23350 Ahead of Powell & Earnings StormUSNAS100
The price maintains bullish momentum, as outlined in the previous idea, with a clean rejection from the 23280 zone. Today, volatility is expected to increase ahead of Jerome Powell’s speech and a wave of key earnings reports.
As long as price holds above 23140, the outlook remains bullish toward 23230 and 23350.
A short-term correction toward 23045 is possible if we get a 1H close below 23140.
Resistance: 23230 · 23350 · 23510
Support: 23045 · 22920
Gold is Targeting Fresh HighsHey Traders, in today's trading session we are monitoring Gold for a buying opportunity around 3,410 zone, Gold is trading in an uptrend and currently is in a correction phase in which it is approaching the trend at 3,410 support and resistance area.
Trade safe, Joe.
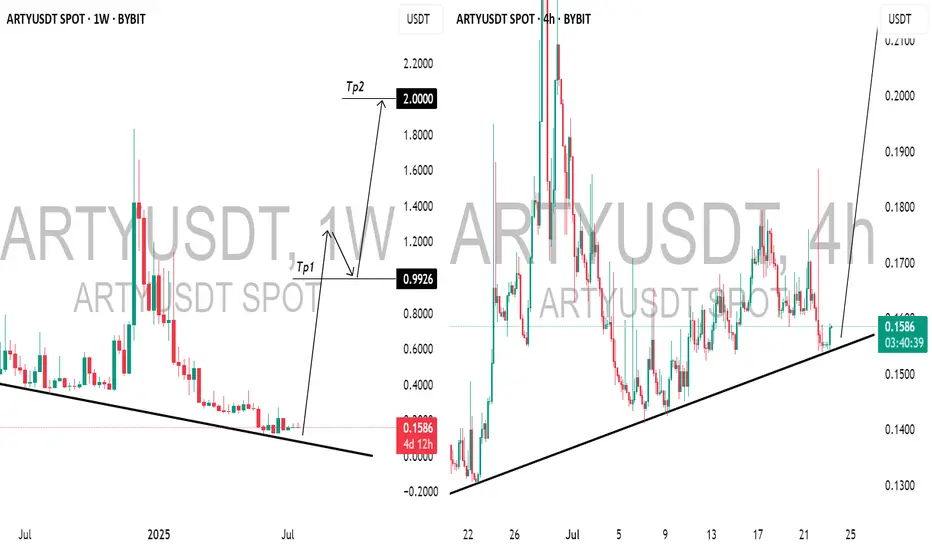
ARTFACT (ARTYUSDT): Bullish Outlook ExplainedThis morning, while analyzing 📈ARTY on a weekly chart, I noticed a promising bullish signal following a test of a falling trend line.
The price has been adhering well to a rising trend line on the 4-hour chart, and after a recent test, we observed a positive bullish reaction, prompting me to enter a long position.
Recently, early investors took profits from three years of staking, alleviating sell pressure. Additionally, Artyfact has introduced its first Play-and-Earn mode, which is expected to attract hundreds of thousands of new players.
This surge in interest will likely increase the demand for AMEX:ARTY and drive up its price, as players can only purchase gaming NFTs using $ARTY.
I believe the price has good potential to rise to 1.00 then to 2.00 soonest.
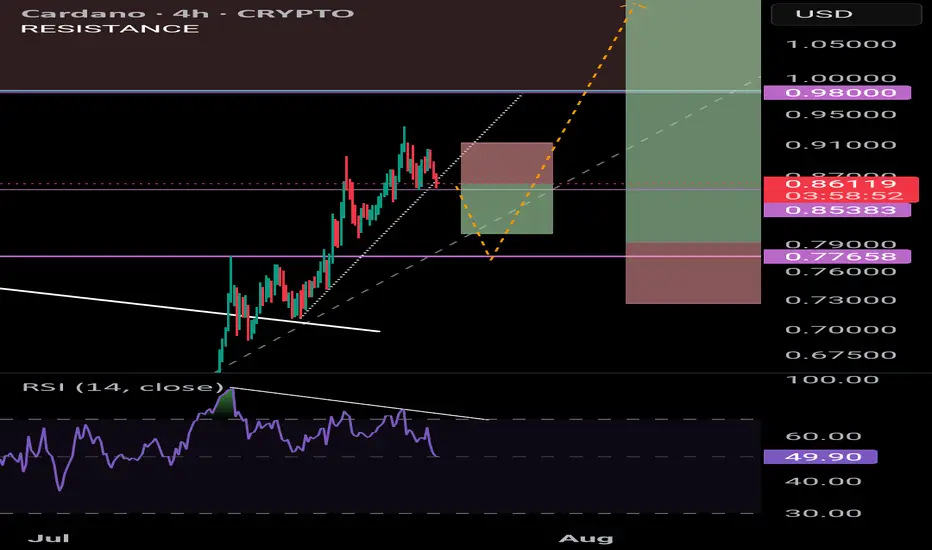
ADA - pull back then blast offIf ADA breaks below 0.85 I believe the next level of support will be @ 0.78 - this price level acted as resistance and was the Weekly high on 3 x occassions. Thus it is assumed that resistance will flip into support.
Bearish div. Suggests a move down as well as a break in the uptrend.
Entry @ 0.79
TP 1: 1.13
TP2: 1.43
TP3: 2.00
You could take a small short position now and profit in the event that price does start to retrace to 0.78 (ish)
GBPNZD - Looking To Sell Pullbacks In The Short TermM15 - Strong bearish move.
No opposite signs.
Expecting bearish continuation until the two Fibonacci resistance zones hold.
If you enjoy this idea, don’t forget to LIKE 👍, FOLLOW ✅, SHARE 🙌, and COMMENT ✍! Drop your thoughts and charts below to keep the discussion going. Your support helps keep this content free and reach more people! 🚀
-----------------------------------------------------------------------------------------------------

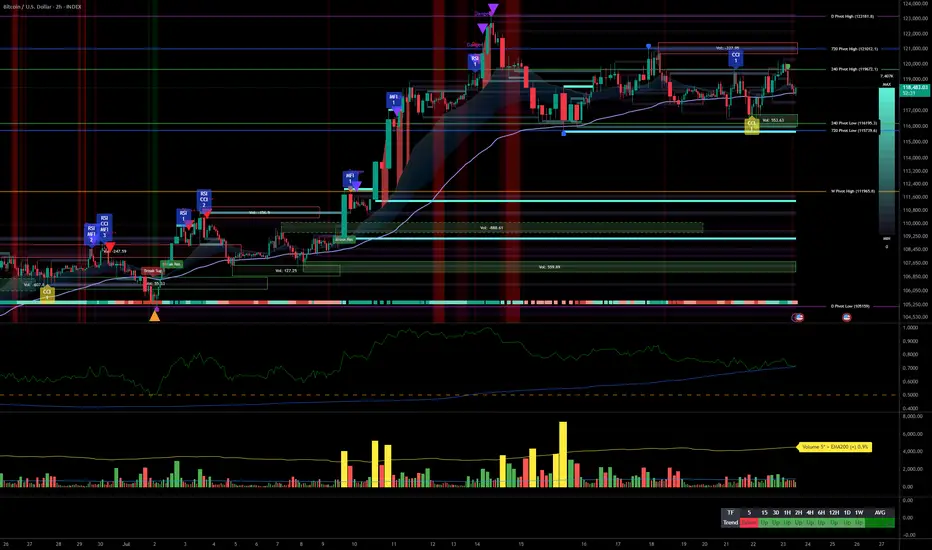
Bitcoin Reinforced Bullish Trend, Range Focus & Key Volumes__________________________________________________________________________________
Technical Overview – Summary Points
➤ Strong bullish momentum across all main timeframes
➤ Key supports: 117600–116500 (short term), 115736/114000 (swing pivot)
➤ Major resistances: 119676, 120998, 123218 (potential short-term distribution risk)
➤ Volumes normal, no climax nor flush
➤ Risk On / Risk Off Indicator: "Strong Buy" bias (all TFs except 30min/15min neutral)
➤ ISPD DIV: No significant divergences
➤ Market consolidating in tight range below immediate resistance
__________________________________________________________________________________
Strategic Summary
➤ Dominant bias: strong bullish on all major TFs
➤ Opportunities: buy on pullback to 117600–116500 support, or on confirmed breakout 119676/120998, targets: 123218–130000
➤ Risk zones: clear break below 115736/114000 or extreme bearish volume
➤ Macro catalyst: No major impact expected short term. Watch Powell/Fed news, possible volatility without trend shift.
➤ Action plan: Prioritize long entries with stops (~2% below support pivot), partial profit taking above 123k, strict risk management in case of behavioral reversal or abnormal volume.
__________________________________________________________________________________
Multi-Timeframe Analysis
Daily/12H/6H/4H/2H/1H :
- All trend signals bullish (Risk On / Risk Off Indicator "Strong Buy", MTFTI "Strong Up")
- All major supports below price
- No structural weakness
- Consolidation range just below 119676–120998 resistance
30min/15min :
- Neutral setup, lack of directional momentum
- Normal volumes, no excessive activity
- Flat consolidation, market awaiting catalyst
Risk On / Risk Off Indicator : Fully confirms momentum. Shifts neutral short-term, no sell or reversal signal.
Key summary :
- Bullish trend dominant
- Major supports well below, immediate risk is low unless flash volume spike or sudden news
- Closely monitor the market under major resistance clusters
__________________________________________________________________________________
Cross-Analysis & Strategic Synthesis
Perfect convergence Daily to 1H: "Strong Up" momentum, bullish Risk On / Risk Off Indicator, healthy volumes
Active consolidation on 30min/15min: market awaits catalyst, no notable bearish strength
Structured pivot supports: 117600–116500, 115736/114000
Key resistances: 119676, 120998, 123218 (potential distribution/resistance zone)
Preferred entries: support pullback or confirmed breakout above 120k
Limited macro risk short term. Focus on Powell/Fed news and US calendar events (see table)
On-chain: Short-term holders profit-taking in progress, alert if deterioration accelerates
Plan: Partial profit taking above 123k extension, systematic stops below 115736 on invalidation
__________________________________________________________________________________
Professional Summary
BTC market shows a strong multi-timeframe bullish impulse, underpinned by robust sector and trend signals. Maintain risk discipline: key supports remain solid, but major resistance cluster requires increased vigilance for volume spikes or air pockets. Partial profit-taking recommended above 123–130k. R/R >2:1 for buys on pullback, strict stop loss in case of technical or behavioral invalidation.
__________________________________________________________________________________
LONG ON GBP/CADGBP/CAD is now at a major key area/demand zone after completing its pullback phase.
I expect price to now rise to the next level of supply or previous high.
looking to catch 200-400 pips throughout the week.

LMT: Lookheed Martin Dropped on Earnings 23-07-2025The dividends now is around 3% which is good for a strong company like Lookheed Martin. But as we are seeing a drop in company profits & Equity, and the stock price is near to a support level, we have to monitor the stock for the next few days or weeks. If all is ok, I will consider buying it.
Disclaimer: This content is NOT a financial advise, it is for educational purpose only.

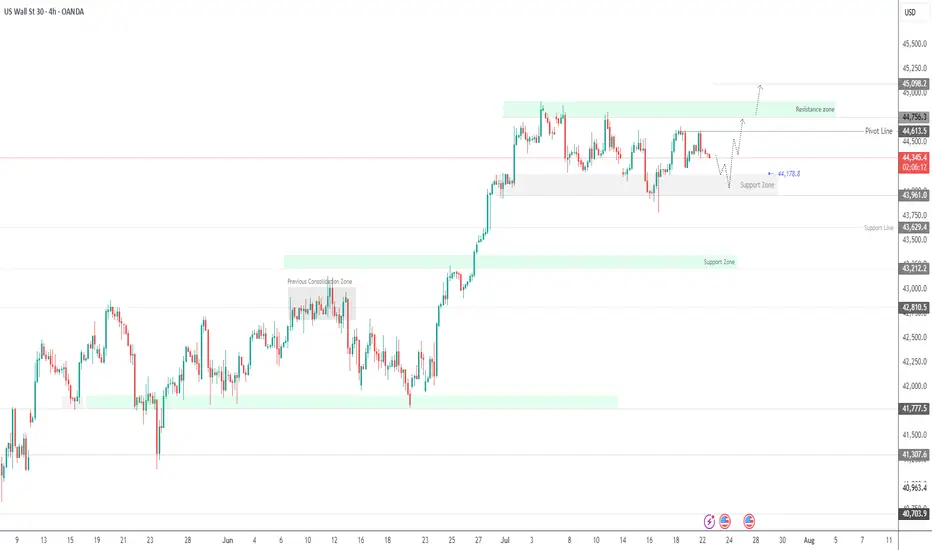
Dow Set for Volatile Move as Earnings, Tariff Risks CollideUS30 OVERVIEW
The price is currently consolidating between 44,180 and 44,620, awaiting a catalyst. Today’s earnings reports are expected to heavily influence Dow Jones price action.
If earnings come in strong, the index is likely to push toward 44,620 and 44,760. A confirmed stability above 44,620 would strengthen the bullish case, potentially opening the path toward a new all-time high near 45,100.
However, a break below 44,180 would signal bearish momentum, with potential downside toward 43,960. Additional pressure could come from escalating tariff tensions, further weakening sentiment.
Resistance: 44,620 · 44,760 · 45,100
Support: 44,180 · 43,960 · 43,630
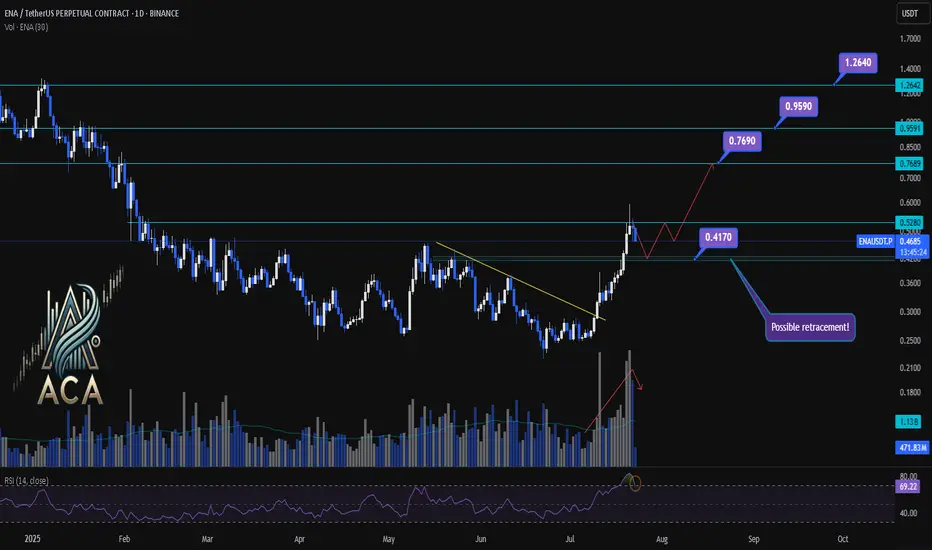
ENA/USDT Chart Analysis | Volatility Signals & Bullish TriggersENA/USDT Chart Analysis | Volatility Signals & Bullish Triggers
🔍 Let’s dive into the ENA/USDT perpetual contract and analyze recent price action, focusing on momentum shifts and key breakout scenarios.
⏳ Daily Overview
The daily chart shows that ENA recently reentered the overbought zone on the RSI, which can serve as a potential trigger for traders watching momentum shifts. Earlier, price action broke decisively above a long-standing descending trendline, resulting in a rapid, nearly 100% surge, a classic RR2 move off the trendline. This breakout coincided with a visible uptick in trading volume, confirming strong demand behind the move.
Now, during the ensuing rest or correction phase, trading volume is decreasing—often a constructive sign suggesting either profit-taking or a healthy pullback rather than panic selling.
🔺 Bullish Trigger & Setup:
- RSI Signal: Reentry into the RSI overbought zone is a potential long trigger, especially if confirmed by price action.
- Confirmation Level: A daily close with strong volume above $0.528 would add conviction to a bullish setup.
- Trendline Reference: The break above the recent trendline fueled the rapid advance, showing the importance of watching such key resistance levels.
📊 Key Targets (on further bullish confirmation):
- $0.769 — First upside resistance.
- $0.959 — Next bullish target.
- $1.264 — Extension target if momentum continues and broader market sentiment remains supportive.
🚨 Conclusion:
Eyes are on the $0.528 level—closing above it with volume, especially while RSI holds in the overbought zone, could provide the next strong entry signal. Current declining volume during pullbacks suggests this is likely a profit-taking phase or standard correction, not bearish capitulation. Keep monitoring RSI, volume profile, and price closes for the next actionable opportunity.
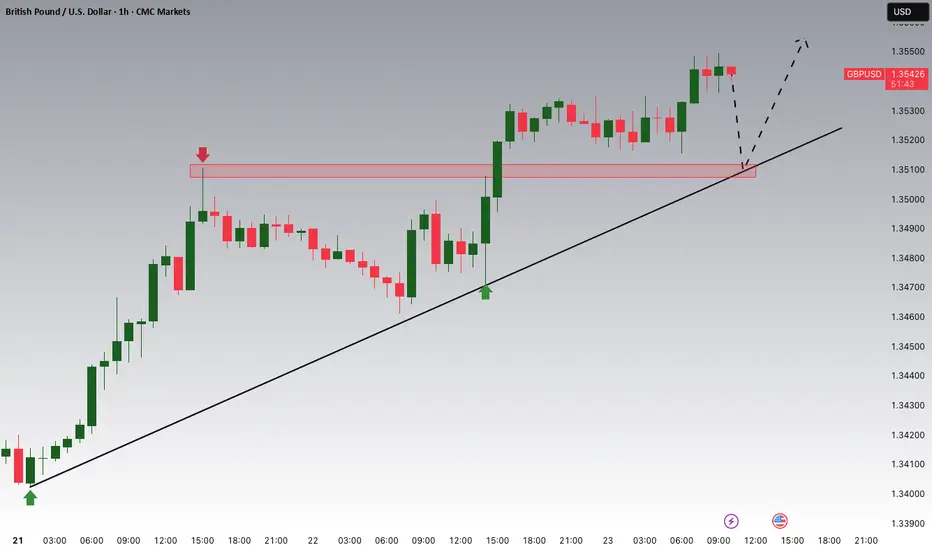
GBPUSD Potential UpsidesHey traders, in today's trading session we are monitoring GBPUSD for a buying opportunity around 1.35100 zone, GBPUSD is trading in an uptrend and currently is in a correction phase in which it is approaching the trend at 1.35100 support and resistance area.
Trade safe, Joe.
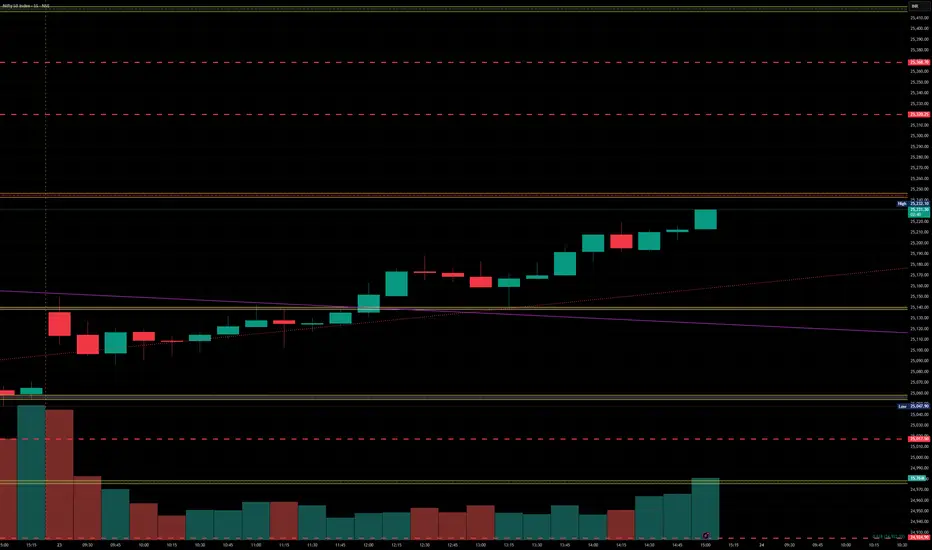
Nifty levels - Jul 24, 2025Nifty support and resistance levels are valuable tools for making informed trading decisions, specifically when combined with the analysis of 5-minute timeframe candlesticks and VWAP. By closely monitoring these levels and observing the price movements within this timeframe, traders can enhance the accuracy of their entry and exit points. It is important to bear in mind that support and resistance levels are not fixed, and they can change over time as market conditions evolve.
The dashed lines on the chart indicate the reaction levels, serving as additional points of significance to consider. Furthermore, take note of the response at the levels of the High, Low, and Close values from the day prior.
We hope you find this information beneficial in your trading endeavors.
* If you found the idea appealing, kindly tap the Boost icon located below the chart. We encourage you to share your thoughts and comments regarding it.
Wishing you success in your trading activities!
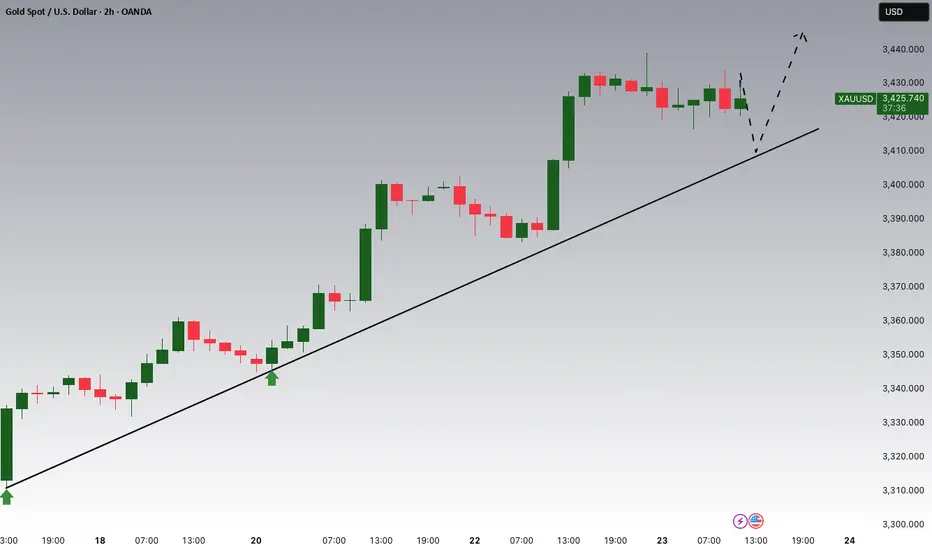
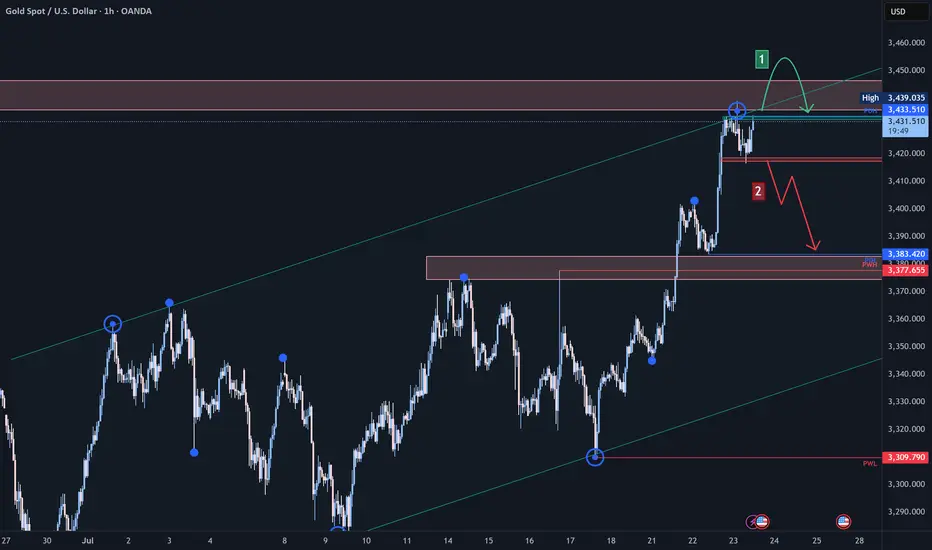
Gold (XAU/USD) Technical Analysis:Gold is currently retesting the $3,440 zone — a key level for the next move.
🔹 Bullish Scenario:
If the price breaks and holds above $3,440, we may see a continuation toward $3,455, where a pullback or bearish correction could occur.
🔹 Bearish Scenario:
If selling pressure increases and the price breaks below $3,420 with confirmation, a move down to retest the $3,385 area is likely.
⚠️ Disclaimer:
This analysis is for educational purposes only and does not constitute financial advice. Always do your own research before making any trading decisions.
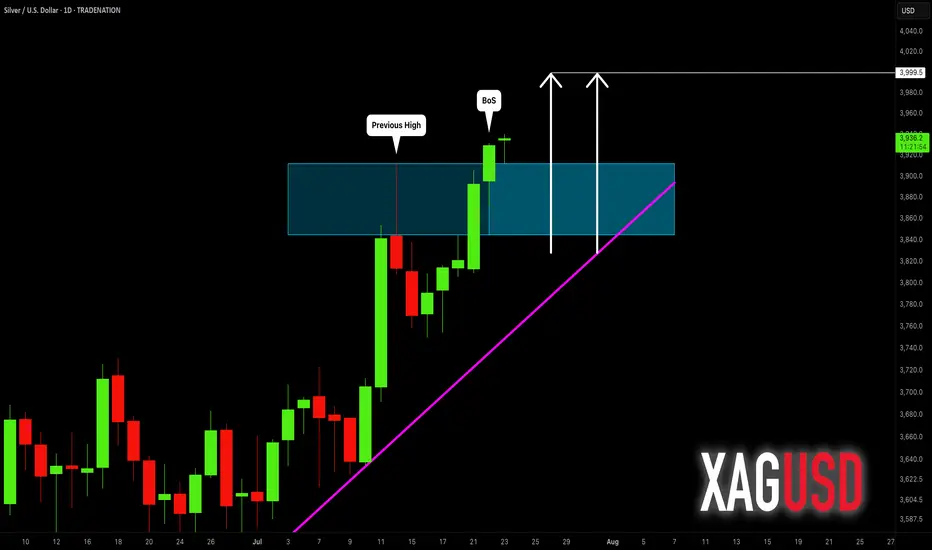
SILVER (XAGUSD): Confirmed Break of Structure
Silver updated a year's high yesterday, breaking a strong daily resistance.
With a confirmed Break of Structure BoS, we can expect that
the market will rise even more.
The next strong resistance is 40.
It is a round number based psychological level.
It can be the next goal for the buyers.
❤️Please, support my work with like, thank you!❤️
I am part of Trade Nation's Influencer program and receive a monthly fee for using their TradingView charts in my analysis
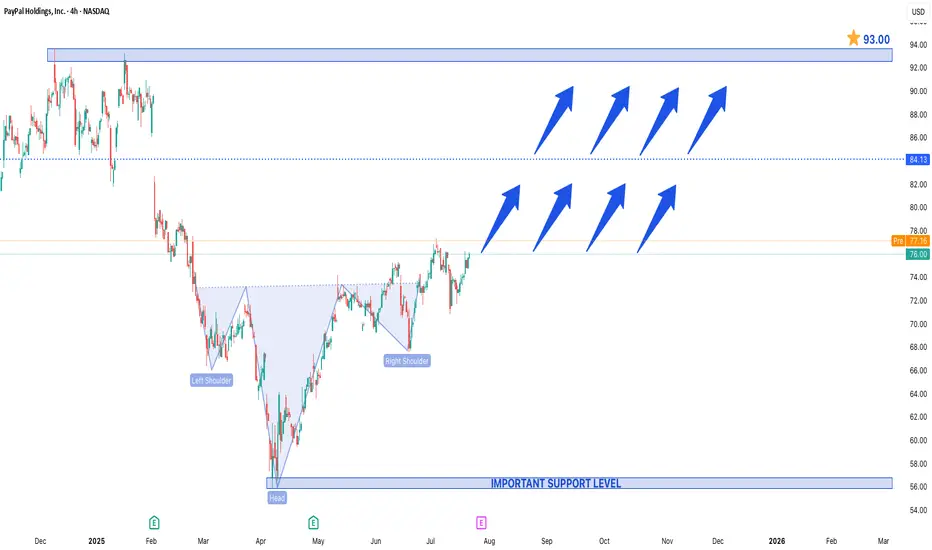
Head & Shoulders Pattern Spotted in PayPal Holdings IncHead & Shoulders Pattern Spotted in PayPal Holdings Inc.
A Head & Shoulders (H&S) pattern has been identified in PayPal Holdings Inc. (PYPL), but unlike the traditional bearish reversal setup, this could be an inverse Head & Shoulders, signaling a potential bullish turnaround.
Key Observations:
1. Left Shoulder – A decline followed by a rebound.
2. Head – A deeper low, then a recovery.
3. Right Shoulder – A higher low, suggesting weakening selling pressure.
4. Neckline Break – A decisive close above the resistance (neckline) confirms the bullish reversal.
Price Projections:
- Support at $55 – This level has held strong, acting as a critical demand zone. A bounce from here could fuel the next rally.
- Upside Target at $93 – A successful breakout above the neckline could propel PYPL toward $93, representing a ~40% upside from current levels.
Why This Matters for Traders:
- Bullish Momentum – The pattern suggests that sellers are exhausted, and buyers are stepping in.
- Volume Confirmation – Increasing volume on the breakout would strengthen the bullish case.
- Market Sentiment Shift – If PayPal sustains above key resistance, it could attract institutional interest.
Trading Strategy:
- Stop Loss – Below $55 for risk management.
- Target – $93, with interim resistance near $75 and $85.
Final Thoughts:
While technical patterns are not foolproof, the inverse H&S in PYPL suggests a potential trend reversal. If the breakout holds, $93 could be the next major target, making PayPal an interesting watch for swing traders and investors.
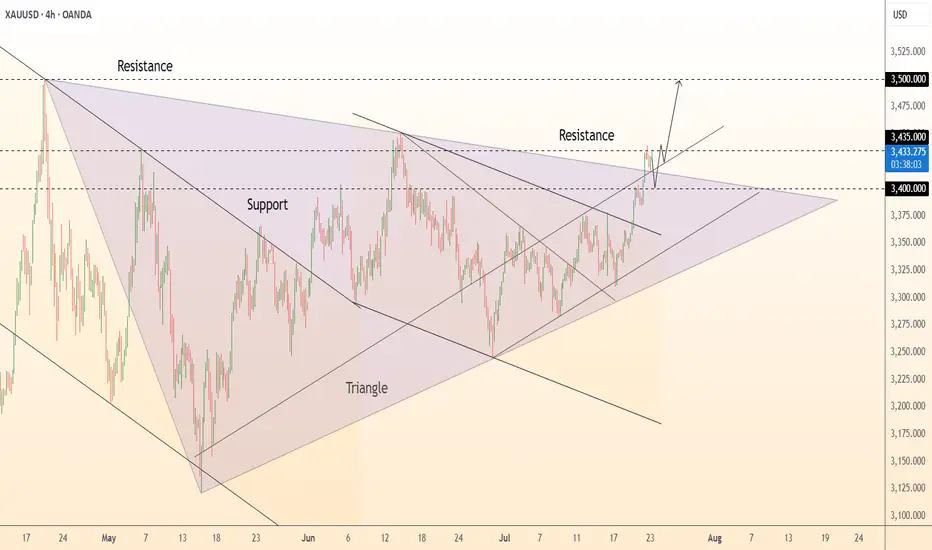
DeGRAM | GOLD exited from the triangle📊 Technical Analysis
● Price has burst above the five-month symmetrical-triangle ceiling at 3 400, converting that line into support; the breakout’s measured move targets the June peak 3 435 and aligns with the rising-channel top near 3 500.
● A tight bull flag is forming on higher-lows inside the new micro up-trend; repeated bids on pull-backs to 3 400-3 405 confirm fresh demand and favour continuation.
💡 Fundamental Analysis
● Gold is buoyed by a softer USD and safe-haven demand as trade frictions grow and Fed guidance turns less certain, keeping XAU/USD firm above $3 400.
✨ Summary
Buy 3 400-3 410; sustained trade over 3 435 eyes 3 500. Bull view void on an H4 close below 3 360.
-------------------
Share your opinion in the comments and support the idea with a like. Thanks for your support!