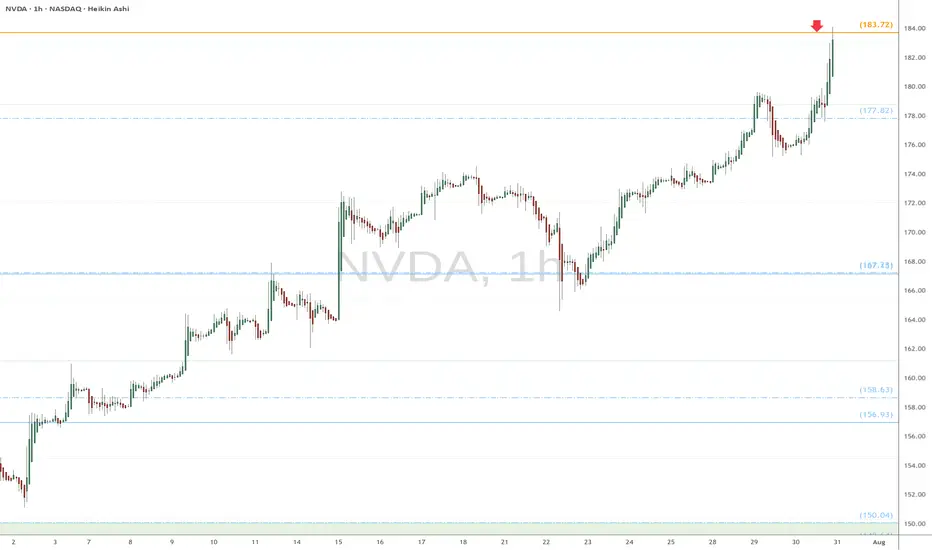
NVDA heads up at $183.72: Golden Genesis fib to mark a TOP?Chips have been flying high since the April lows.
NVDA has just hit a Golden Genesis fib at $183.72
This is a "very high gravity" fib so expect a reaction.
It is PROBABLE that we "orbit" this fib a few times.
It is POSSIBLE that we reject to form a major top.
It is PLAUSIBLE that we Break-n -Retest to continue.\
.
See "Related Publications" for previous EXACT plots ------>>>>>>>>
Such as this post at the last Golden Genesis:
Hit the BOOST and FOLLOW for more such PRECISE and TIMELY charts
============================================================
.
Support and Resistance
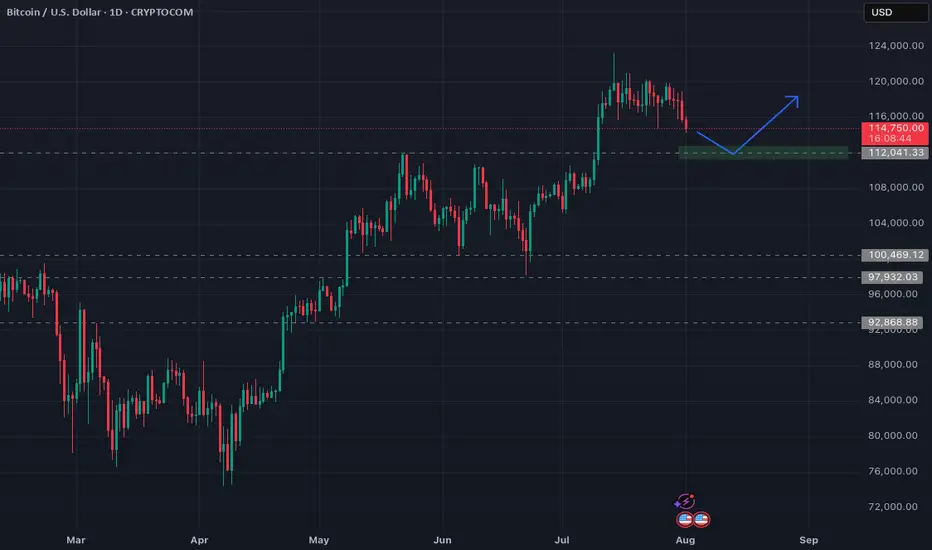
Bitcoin FOMC aftermath & plan aheadHi all,
As you may have noticed, Wednesday's FOMC meeting delivered a less-than-optimistic outlook. The absence of rate cuts, combined with uncertainty about potential cuts in September, triggered a downward move in the markets.
Bitcoin is currently trading 7% below its high from July 14th. I anticipate a relatively shallow downtrend and plan to add to my position around $112,000.
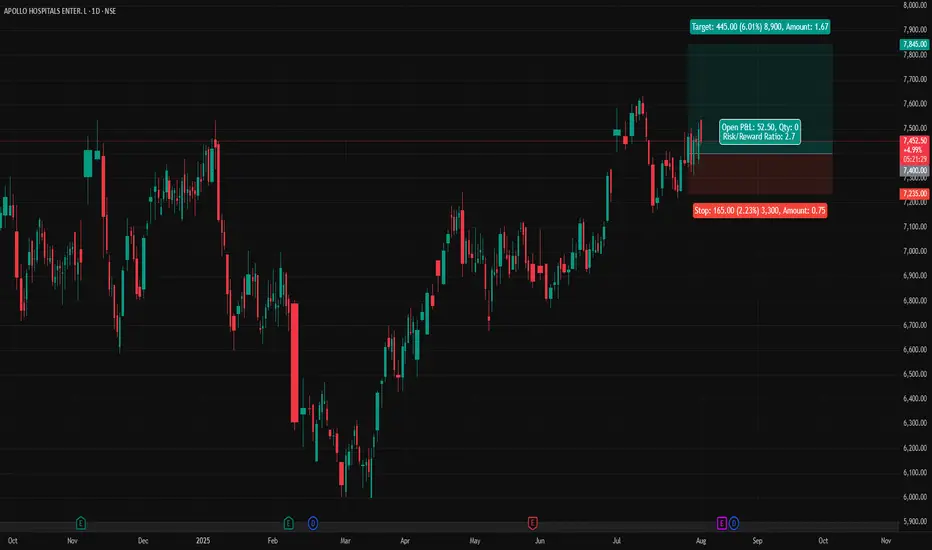
APOLLOHOSP - Apollo Hospitals (Daily chart, NSE) - Long PositionAPOLLOHOSP - Apollo Hospitals Enterprise Ltd. (Daily chart, NSE) - Long Position
Risk assessment: Medium {support structure integrity risk}
Risk/Reward ratio ~ 2.7
Current Market Price (CMP) ~ 7450
Entry limit ~ 7400 on Aug. 01, 2025
Target limit ~ 7845 (+6.01%; +445 points)
Stop order limit ~ 7235 (-2.23%; -165 points)
Disclaimer: Investments in securities markets are subject to market risks. All information presented in this group is strictly for reference and personal study purposes only and is not a recommendation and/or a solicitation to act upon under any interpretation of the letter.
LEGEND:
{curly brackets} = observation notes
= important updates
(parentheses) = information details
~ tilde/approximation = variable value
-hyphen = fixed value
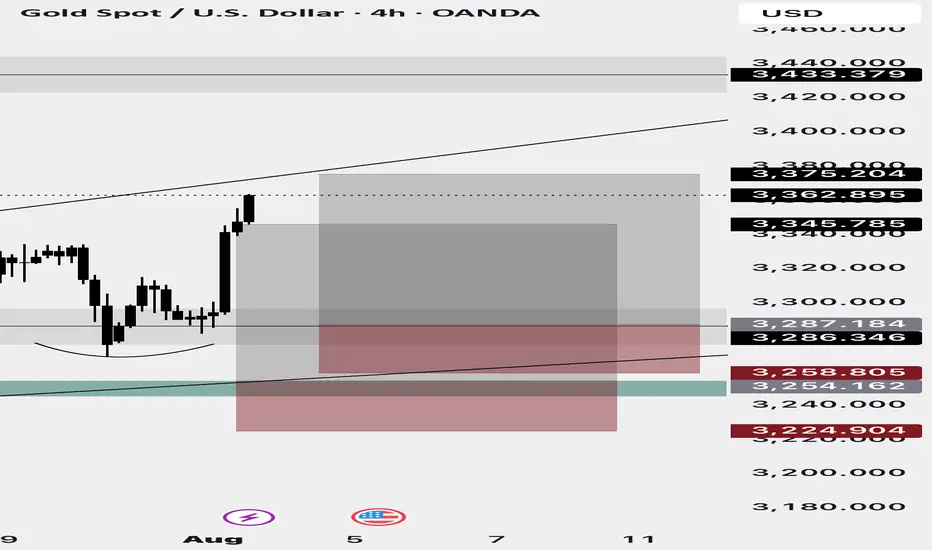
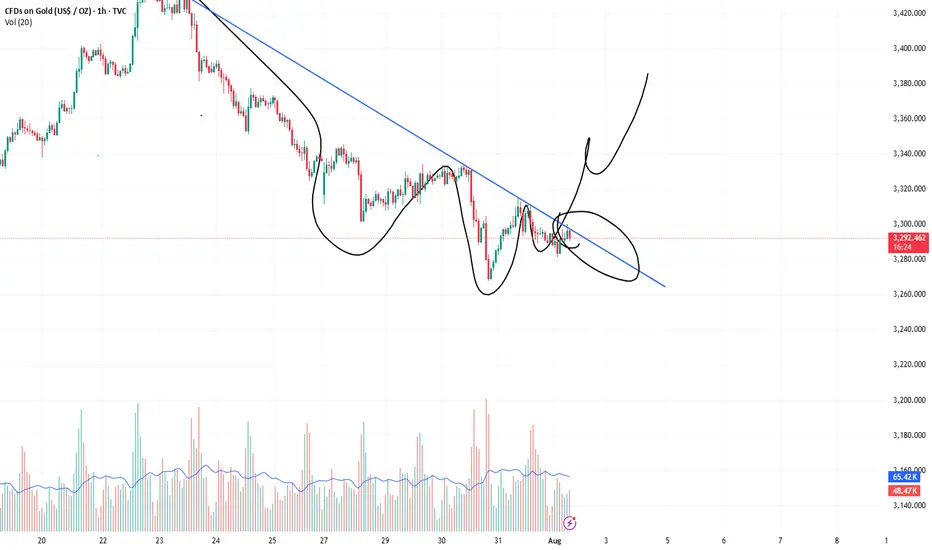
XAUUSD TRADE UPDATE MISSED TRADE Hey everyone here’s a trade recap of the week at first we were interested to take buys at 3254 zone as first entry and scale in at 3287 zone but price pulled down slightly missed the first entry and I didn’t execute & the second entry didn’t execute that too and market skyrocket if price activated the first entry we would’ve caught a huge trade today,the first one didn’t activated so I didn’t execute the second entry which is the 3287 zone that buyers came in so we move on and I will keep on sharing potential good setups and have a beautiful weekend guys….
New targets for Reddit RDDT In this video I recap the previous reddit analysis where we looked for the long which is playing out really well .
I also look at the current price action and simulate what I think could be a target for the stock moving forward using Fib expansion tools as well as levels below for price to draw back too.
Welcome any questions below the chart . Thanks for viewing

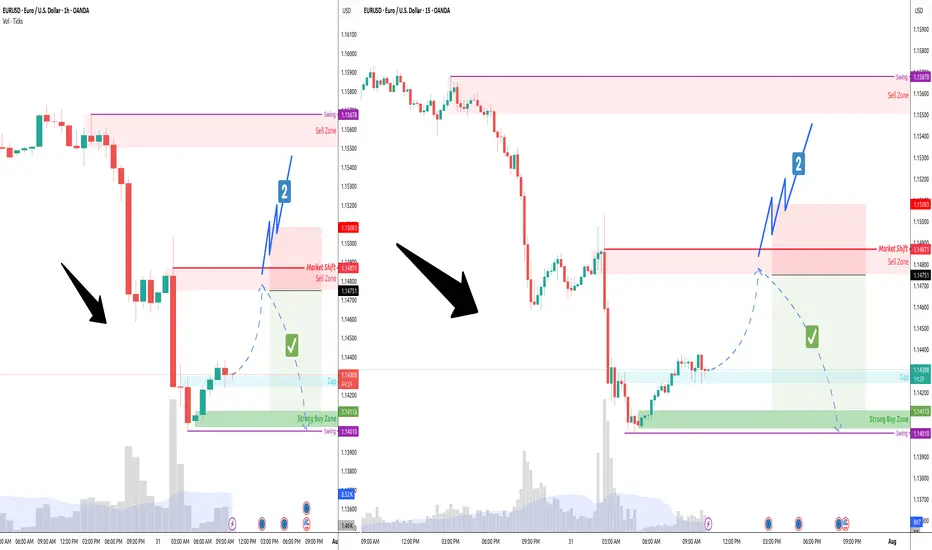
EURUSD 60/15 Pullback ShortOverall down trend. Now the price is located at the defending gap and stay above. Expected to break up and reach the sell zone then drop. Set alarm on lower sell zone and monitor.
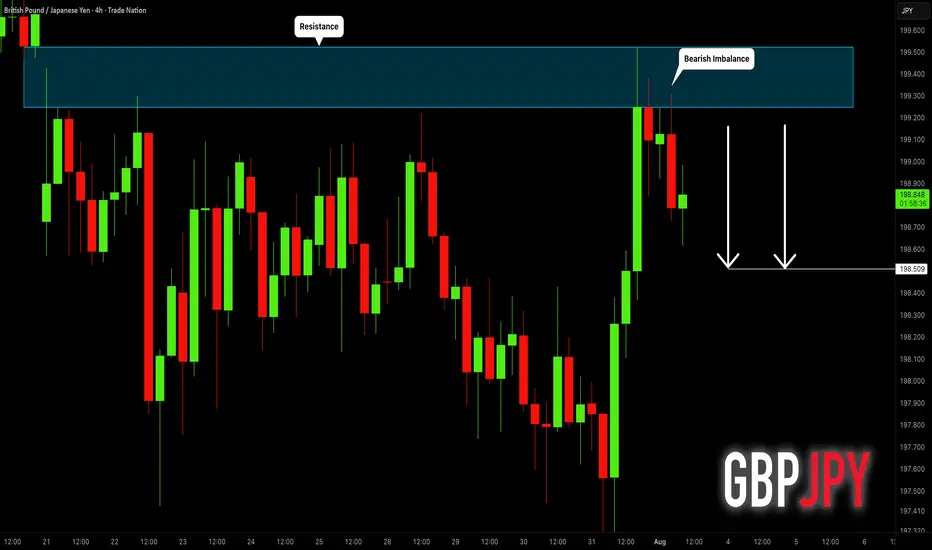
GBPJPY: Pullback From Resistance 🇬🇧🇯🇵
I think that GBPJPY will pull back from a wide
intraday supply area.
As a confirmation, I see a bearish imbalance candle that
is formed after its test.
Goal - 198.51
❤️Please, support my work with like, thank you!❤️
I am part of Trade Nation's Influencer program and receive a monthly fee for using their TradingView charts in my analysis.
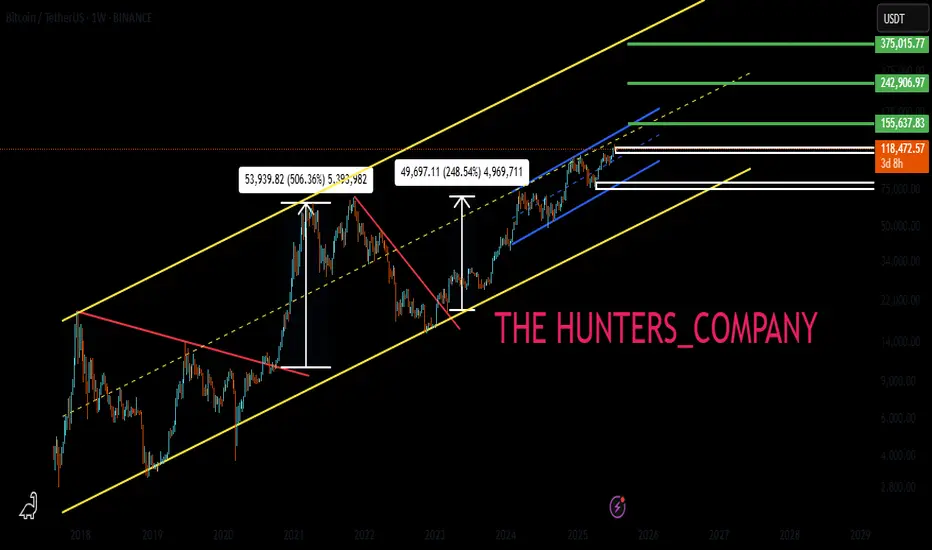
BTC : The future of Bitcoin...Hello friends🙌
👀According to the price history, the price has always been bullish and is in a long-term bullish channel.
📈Now that the price is struggling in the middle of the channel and is gathering strength for a big move, which is expected to break the middle of the channel in the form of a resistance or middle channel, the price will move to the ceiling of the channel.
⚠Don't forget risk and capital management.
🔥Follow us for more signals🔥
*Trade safely with us*
NFP data is positive, the bullish trend remains unchanged#XAUUSD
The current market, influenced by data such as NFP, remains bullish, even briefly pushing towards the 4H upper limit of 3350, reaching a high near 3354.📈
In the short term, gold still has upward momentum and could even reach the previous high resistance level near 3375.🐂
Currently, gold is undergoing a technical correction and needs to begin a pullback to accumulate more bullish momentum, giving traders who previously missed the opportunity to get on board.🚀
As resistance continues to rise, support below will also rise. 📊If gold retreats below 3335-3315, consider going long.📈
🚀 SELL 3335-3315
🚀 TP 3350-3375
XAUUSD ultra-short-term sell trade.The hourly chart still shows a downward trend. Short-term downward pressure will continue. If you want to trade in the London market, consider selling at high levels and pursuing short-term trend trading.
3300-3295 SELL
TP3285-3280
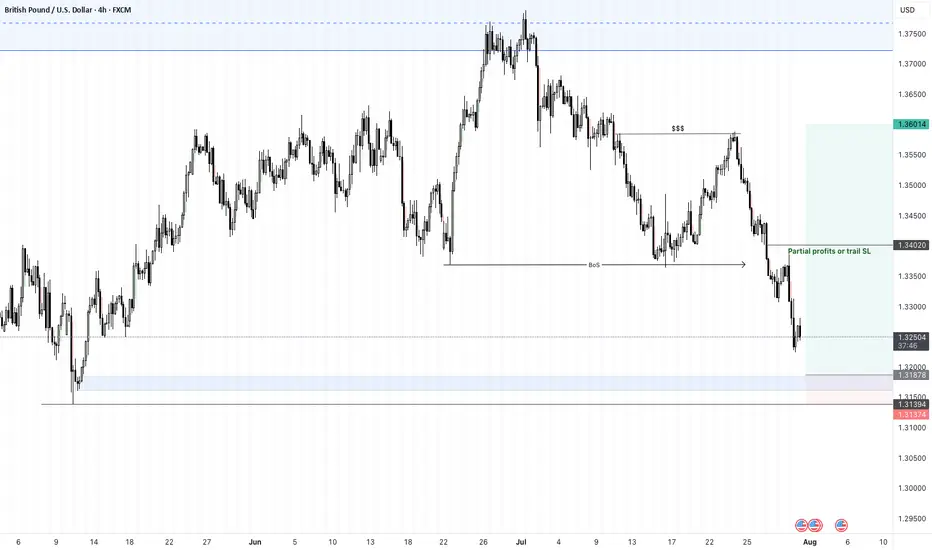
GBPUSD - 31/7/25 - Bullish reversalThe setup is not great, but im expecting a pull back on the dollar which should result in a bullish move on the GBP and EUR.
There is an extreme zone that i would like price to reach to with the possibility of not taking out the previous HL. But lets see.
+ve:
1. Extreme zone that resulted in the bullish move.
2. slight imbalance above the extreme zone
3. Dollar setting up for a pull back that will result in a bullish move on GBP
4. TP is just above the equal high liquidity zone
-ve:
1. close to the higher low and that may be swept
Silver under pressure!Silver prices dropped sharply following a sudden plunge of over 20% in U.S. copper futures, triggered by a surprise decision from the Trump administration to cancel import tariffs on refined copper. This move caused turmoil in the markets and impacted related assets such as silver.
From a technical perspective, silver is trading in a general downtrend on the 4-hour chart, forming lower lows and lower highs, maintaining a bearish structure.
If the price rises to the 37.034 level, it is likely to reverse downward to continue the bearish trend, targeting the 36.45 and 35.60 levels in the medium to long term.
However, if the price climbs above 37.26 and closes a 4-hour candle above that level, the bearish scenario would be invalidated, and this breakout could signal a trend reversal from bearish to bullish.

ETHUSD BROKE THE LOWER BORDER OF THE WEDGE. PRICE IS MOVING TOWAETHUSD BROKE THE LOWER BORDER OF THE WEDGE. PRICE IS MOVING TOWARDS THE LOCAL SUPPORT.
Yesterday, Ethereum saw its largest monthly increase since July 2022, thanks to strong inflows into exchange-traded funds and increased activity in the Ethereum treasury. US exchanges are working to obtain regulatory approval for a standardized framework for listing crypto funds. Coinbase and JPMorgan have joined forces to provide Chase customers with access to crypto products.
Despite these positive developments, the short-term outlook does not indicate a bullish setup. It appears that all the information has already been factored into the price. The pair moves towards the local support of 3,500.00. However, in the long term, these developments are favorable for investment.

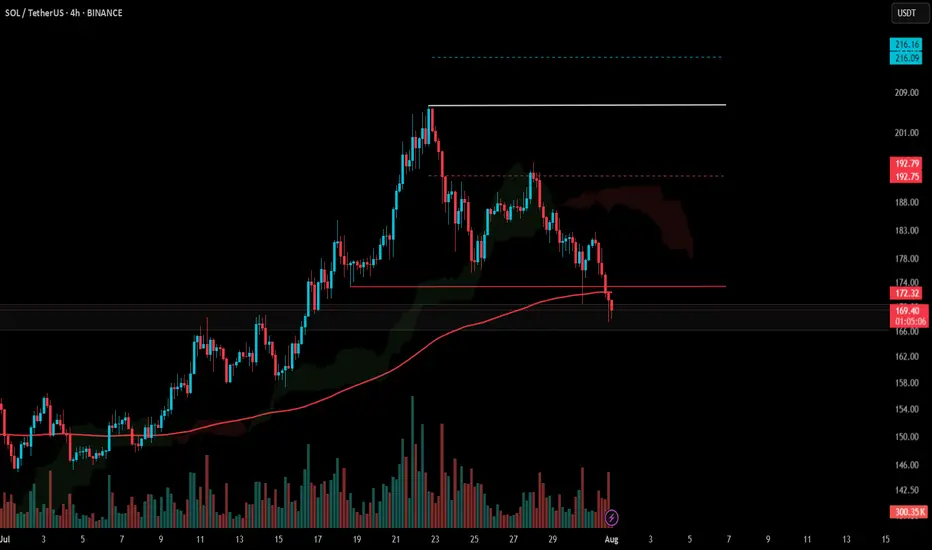
#SOL Update #6 – Aug 01, 2025#SOL Update #6 – Aug 01, 2025
Unfortunately, Solana failed to hold the last low where its most recent impulsive move had started, and it closed below that level. This close also occurred below the MA200 band. In other words, Solana broke a very strong support on the 4-hour chart and moved downward, reaching the previous K-Level zone. It’s hard to say anything positive for Solana at this stage. If the current K-Level fails to hold, Solana may look for support around the $158 level. A long position on Solana is definitely not recommended. I also do not suggest a short position. However, unless there’s a strong reversal, it’s safe to say that Solana has entered a bearish phase on the 4-hour chart.
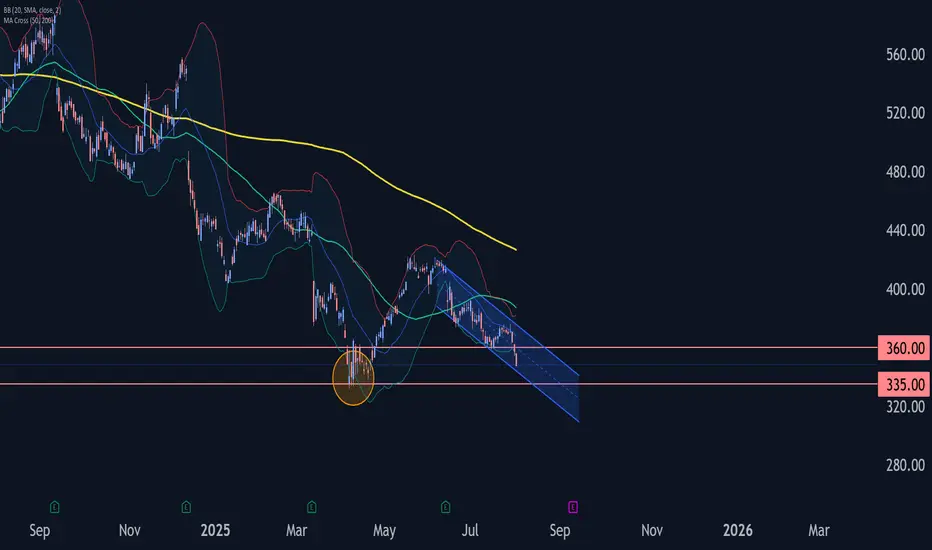
Adobe Wave Analysis – 1 August 2025- Adobe broke the key support level 360.00
- Likely to fall to support level 335.00
Adobe recently broke below the key support level 360.00 (which stopped the previous minor impulse wave i at the start of July).
The breakout of the support level 360.00 accelerated the active impulse wave C of the medium-term ABC correction (2) from the end of May.
Given the strong daily downtrend, Adobe can be expected to fall further to the next support level at 335.00 (the double bottom from April and the target for the completion of the active impulse wave C).
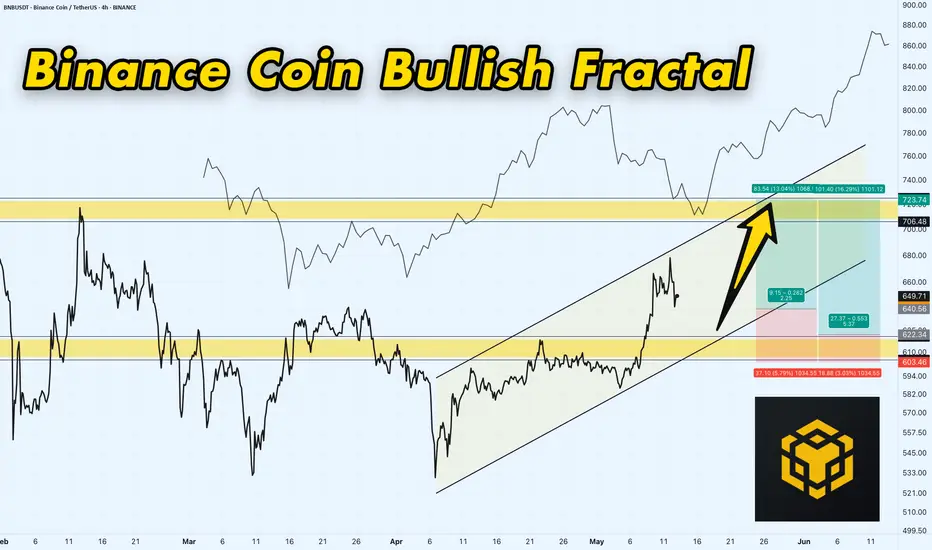
BNB/USDT 4H Chart: Rising Channel with Fractal Vibes!Hey traders! Binance Coin is showing some promising action that’s got me on the edge of my seat!
We’ve got a clear rising channel in play, with BNBUSDT moving beautifully in sync with a fractal line pattern shown above the chart — mirroring past price behavior like a roadmap! BNBUSDT is currently trading at $650 , I think price will continue bouncing between the channel’s support at $620-$600 and move upwards to the key resistance target at $700-$720 . A breakout above this resistance could send BNB soaring to new highs, potentially targeting $800 or beyond!
However, if BNB fails to break through, we might see a pullback to the channel support at $620-$600 .
Key Levels to Watch:
Resistance: $700-$720
Support: $620-$600
Breakout Target: $800+
Breakdown Risk: $600
Is BNB about to blast through $720, or will it retreat below support? Let’s hear your thoughts below!
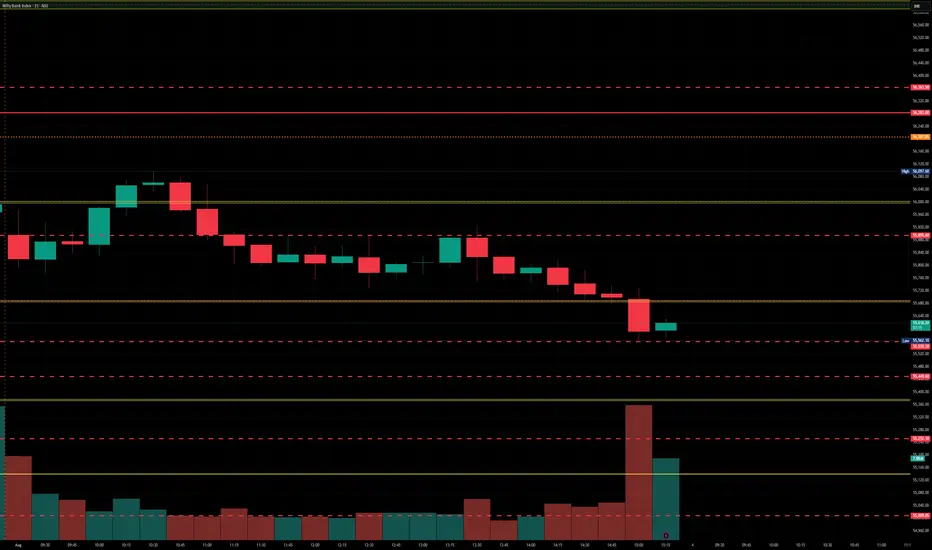
BankNifty levels - Jul 04, 2025Utilizing the support and resistance levels of BankNifty, along with the 5-minute timeframe candlesticks and VWAP, can enhance the precision of trade entries and exits on or near these levels. It is crucial to recognize that these levels are not static, and they undergo alterations as market dynamics evolve.
The dashed lines on the chart indicate the reaction levels, serving as additional points of significance. Furthermore, take note of the response at the levels of the High, Low, and Close values from the day prior.
We trust that this information proves valuable to you.
* If you found the idea appealing, kindly tap the Boost icon located below the chart. We encourage you to share your thoughts and comments regarding it.
Wishing you successful trading endeavors!
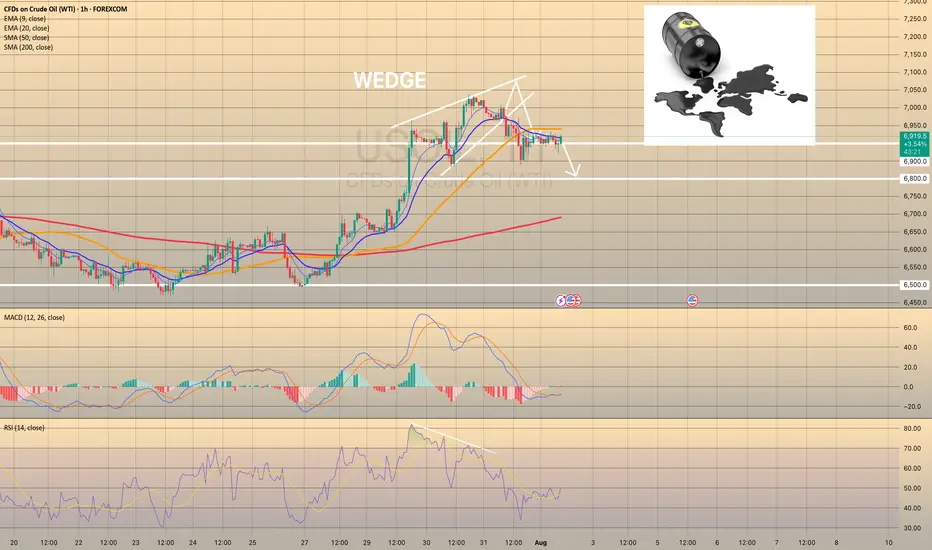
USOIL REACHED THE 6,900.00 SUPPORT LEVEL. WHAT'S NEXT?USOIL REACHED THE 6,900.00 SUPPORT LEVEL. WHAT'S NEXT?
As we told July 31, the price got reversed towards first support level of 6,900.00. Market participants are waiting for the OPEC+ meeting this week, expecting a significant output hike. Currently, the price sits slightly above the support level. Although, the asset trades above this level, considering the current weakness of the asset, further decline is expected. The 6,800.00 support level is the next target here.
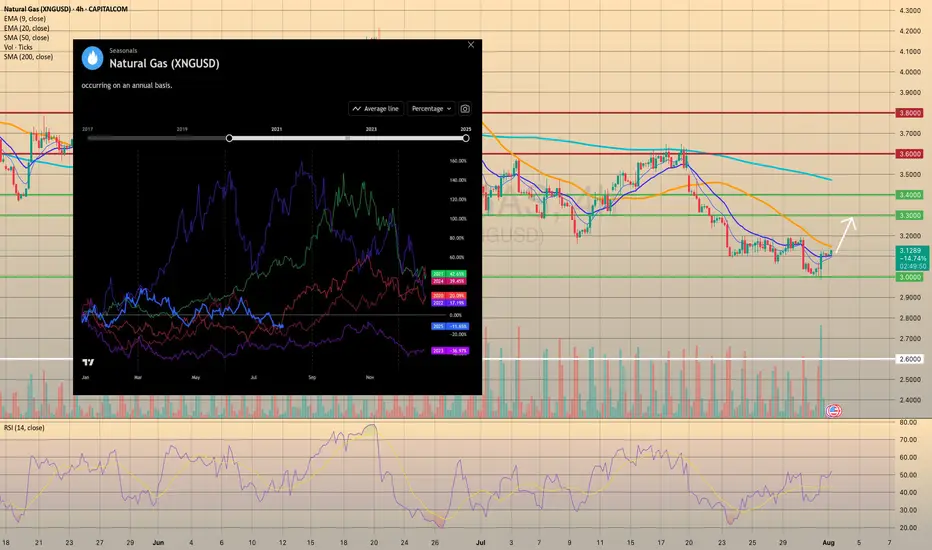
U.S. NATURAL GAS SUCCESSFULLY REBOUNDED FROM FIRM SUPPORT.U.S. NATURAL GAS SUCCESSFULLY REBOUNDED FROM FIRM SUPPORT.
Yesterday the natural gas storage report came out higher than expected. U.S. natural gas inventories increased by 48 billion cubic feet last week to 3,123 Bcf, increasing the surplus over the five-year average to 195 Bcf from 171 Bcf the week before, the EIA reports. The storage increase was bigger than the 24 Bcf average for the week, and above the 36 Bcf estimate. However, the price rised on 2.35% afterwards, supported by increased volume, which indicates the strength of the level. The upward movement towards the 3.3000 level is highly expected.
Additionally, seasonals suggest us that current prices may become the lowest till the end of the year. Historically, since August the natural gas prices increase in anticipation of a new heating season and higher energy demand (pic2).
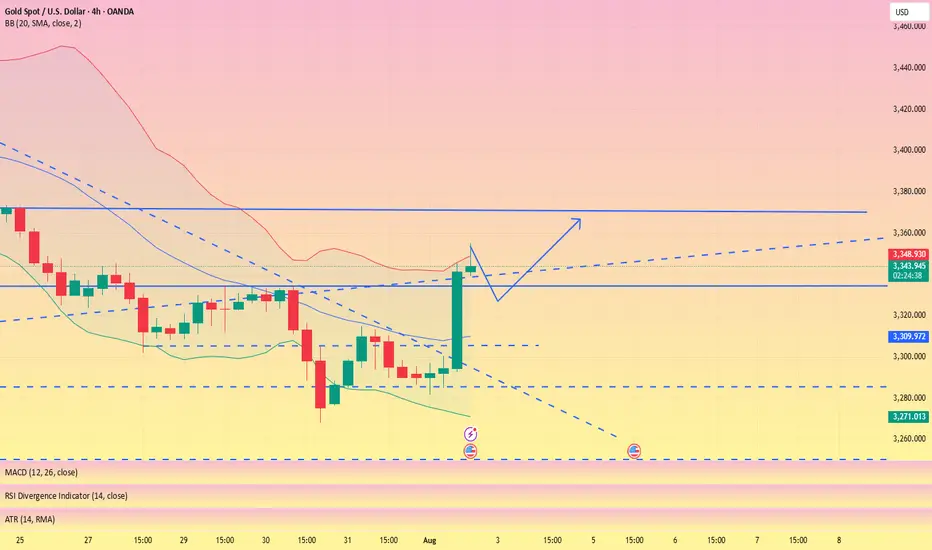
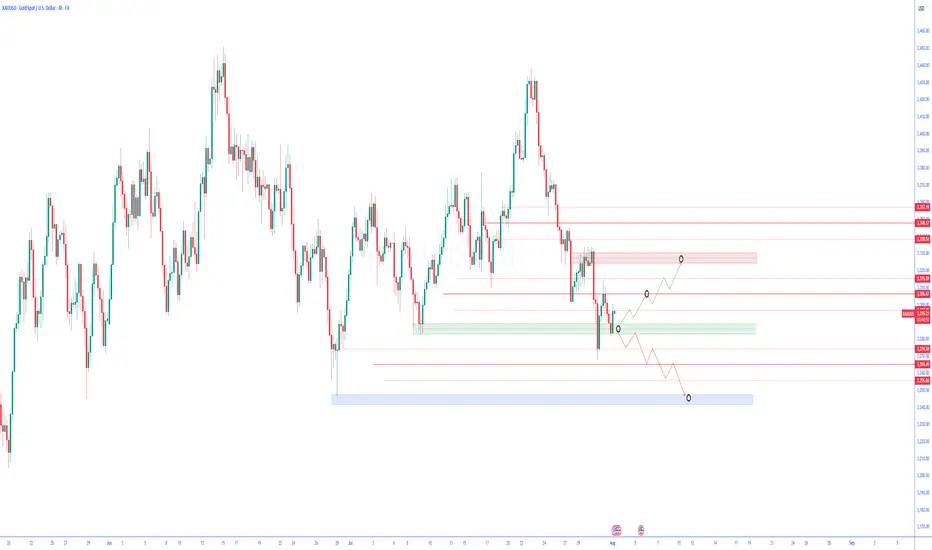
Technical Analysis of Gold Chart (XAU/USD) – 4-Hour TimeframeTechnical Analysis of Gold Chart (XAU/USD) – 4-Hour Timeframe
Following the heavy selling pressure seen in recent days, the price of gold has now reached a zone that has repeatedly shown reactions in the past. This green-colored support area can currently play a decisive role in the market’s next move.
Price Movement Outlook:
Scenario 1 – Bullish Correction Move:
If buyers manage to take control of the market in this zone, it is expected that gold will gradually pass through intermediate resistance levels and first enter the medium-term resistance area. If momentum is maintained, the price could then move toward higher highs. This move can be interpreted as a technical correction against the recent bearish wave and may attract short-term traders until reaching strong supply zones.
Scenario 2 – Continuation of the Downtrend:
Conversely, a confirmed break of this support with high volume and strong bearish candles could lead to a further decline in price toward previous lows. In this case, the blue-colored area at the lowest part of the chart would serve as the next demand zone.
Key Point:
The market is currently in a decision-making phase. Confirmation of reactions at this support area is extremely important in determining the market’s future direction. Therefore, entering the market prematurely without waiting for confirmation of price behavior could involve high risk.
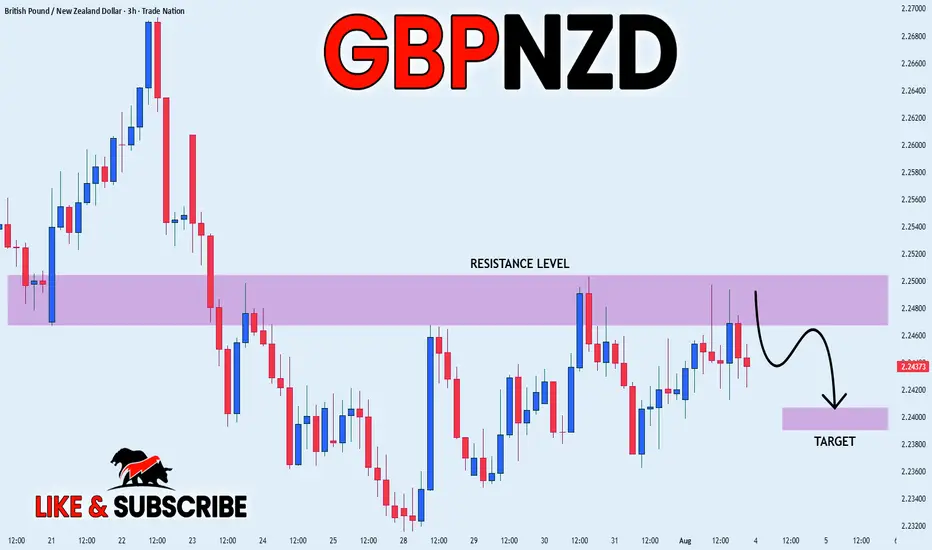
GBP_NZD BEARISH BIAS|SHORT|
✅GBP_NZD has retested
A resistance level of 2.2500
And we are seeing a bearish reaction
With the price going down so we are
Bearish biased now and we will be
Expecting the pair to go further down
SHORT🔥
✅Like and subscribe to never miss a new idea!✅
Disclosure: I am part of Trade Nation's Influencer program and receive a monthly fee for using their TradingView charts in my analysis.
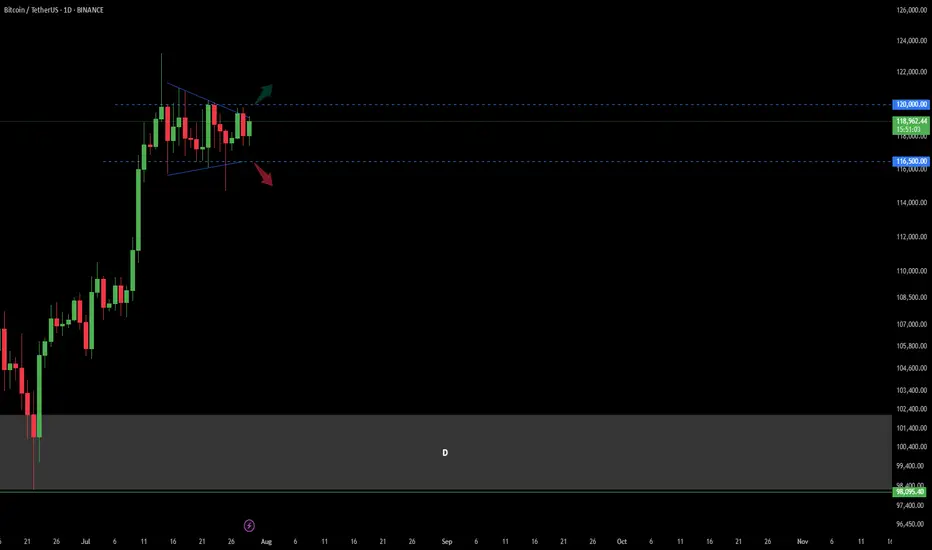
Bitcoin Trend Analaysis UP or DOWN?!Price capped in a wedge in Daily time frame.
There was a fake break from the bottom of this wedge last week and sharply got back to the top of it!
Now : break and confirm above 120 K in Daily would make the market BULLISH
break and confirm under 116.5 K in Daily would make the market BEARISH.
other wise market is still in a range mode...
AUD/JPY bulls eye 99, 100The yen is broadly weaker, which is even allowing a weaker Australian dollar to rise. And with a decent bullish trend on the daily chart, I am now seeking dips within a recent consolidation range in anticipation of a move to 99 or even 100.
Matt Simpson, Market Analyst at City Index and Forex.com
