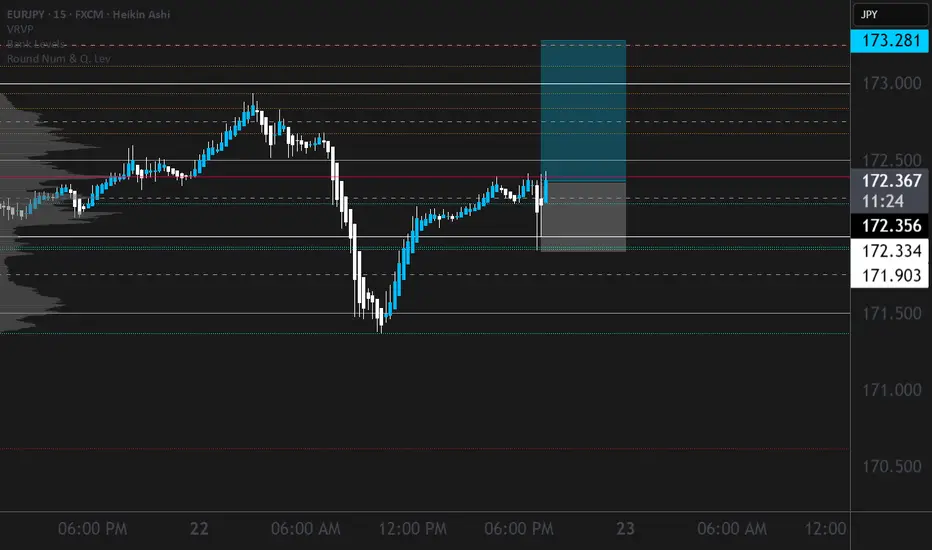
EURJPY about to enter into a DowntrendRecently EURJPY reached high points in the chart at 173.016
From there it fell and continued downwards.
I took a quick demo trade with an inverse risk to reward. Not the ideal thing to do, but I didn't want to keep my TP higher than 173.016 since we know it's a strong resistance level.
Got a quick win there.
Now, on the 4H, we can see that one huge red candle look out the previous five green candles.
It indicates that selling pressure is incoming.
This would be a good time to sell now. But I do want to see price go below 171.540 just to get that extra confirmation. Just in case, price decides to consolidate or go high for a while.
Have to stay vigilant with this market now.
TP1 will be 171.100.
TP2 will be 170.000
TP3 will be 168.800
Lets see how this trade plays out.
Support and Resistance

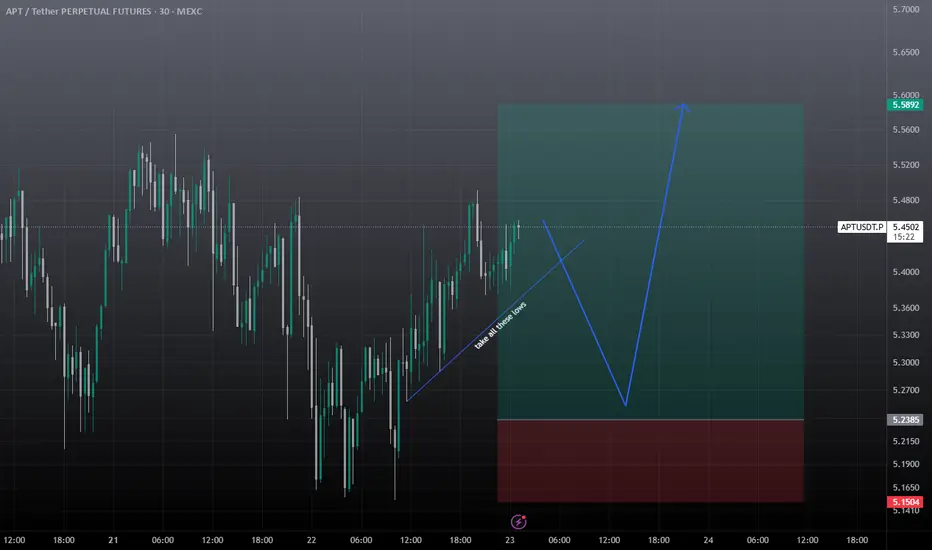
APTUSDT Aptos Scalp buy / Long Setupaptos trying to breakout, wait till London session, if tp hits first then ignore, will share setup, must use sl as it's a scalp trade.
SET
Apil 2025 since the price is oversold from Feb2025 price still drop contrary with momentum
BigBlack candle followed by exhaustion gap at exactly the end of wave 5 of C
Pattern Double Bottom, Island Reversal
Be careful with the false break out at 1,250. Look closly at the momentum
Around 1,100 is a good buy zone and I do think once it break 1,250 or 1,300 price will never come back to 1,100 again.

XAUUSD:3450-3500The probability of the same direction of the two histories is 95% similar. This shows one thing. The market may repeat history again.
So buy with me. The next target is 3450-3500
xauusd:3450-3500?Combined with the trend of the US dollar index, the probability of continuing to fall in the short term is high. Today, the manufacturing industry is significantly bullish for gold prices, which is expected. Powell's speech in an hour will be the key factor in today's New York market.
The pressure of interest rate cuts is imminent. Will Powell continue to insist on not cutting despite all objections? This is what we need to pay attention to. Make two plans. First, continue not to cut interest rates, the US dollar will be supported, and gold will retreat. If there is a retracement of 3400-3410 points, it needs to be paid attention to. Second, it is not discussed. Or interest rate cuts are beneficial to gold prices. This is the driving force for gold prices to hit 3500-3450.
To be honest, the conclusion of the Band Trading Center Research Institute tends to the latter. So if you buy, you need to set TP/SL strictly.
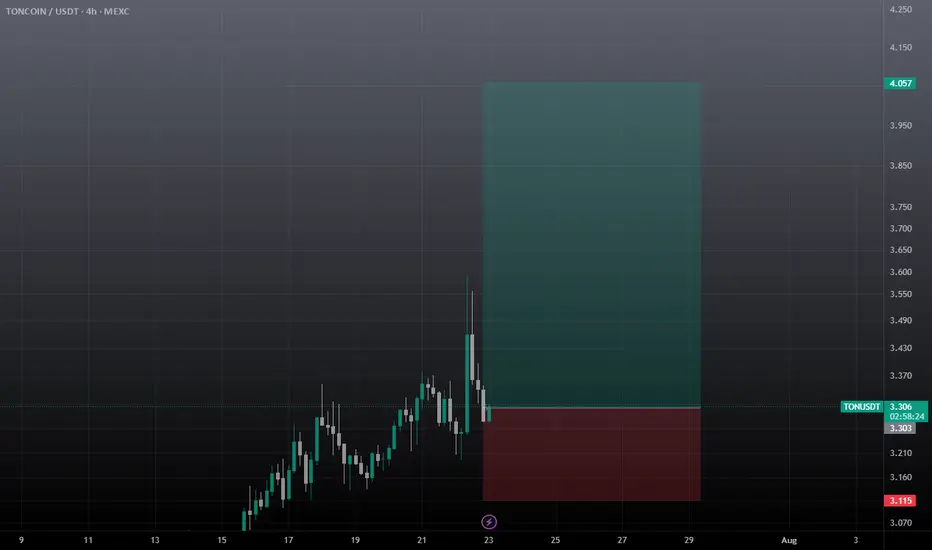
Ton USDT Buy Setup / Long SetupTon entry at current market price 3.305 , SL if 1 day closes below the mentioned zone. Otherwise holding ton for breakout towards 4-4.5$. use low risk amount as BTC can retrace.
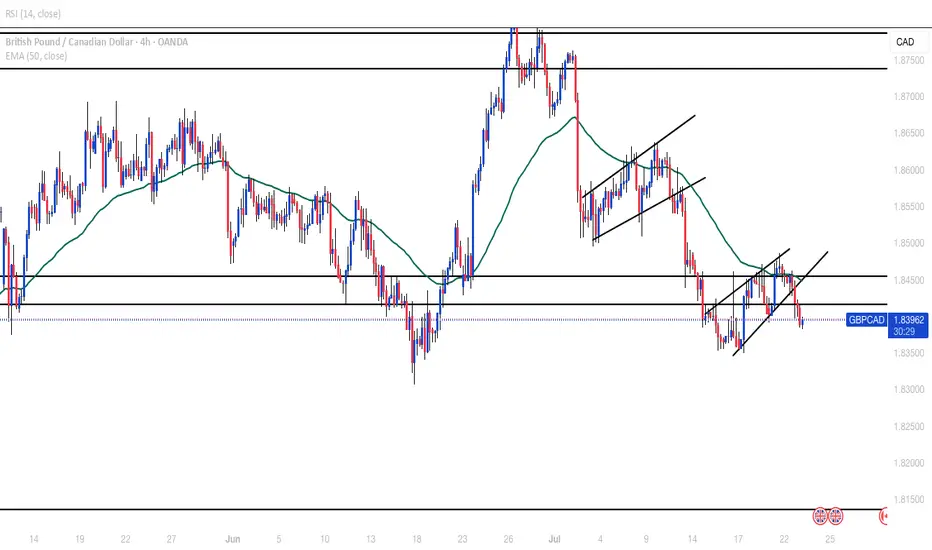
GBPCAD SELLSH4 double top with broken neckline at a strong daily zone, bearish flag was also formed. Looking at next daily support around 1.81500
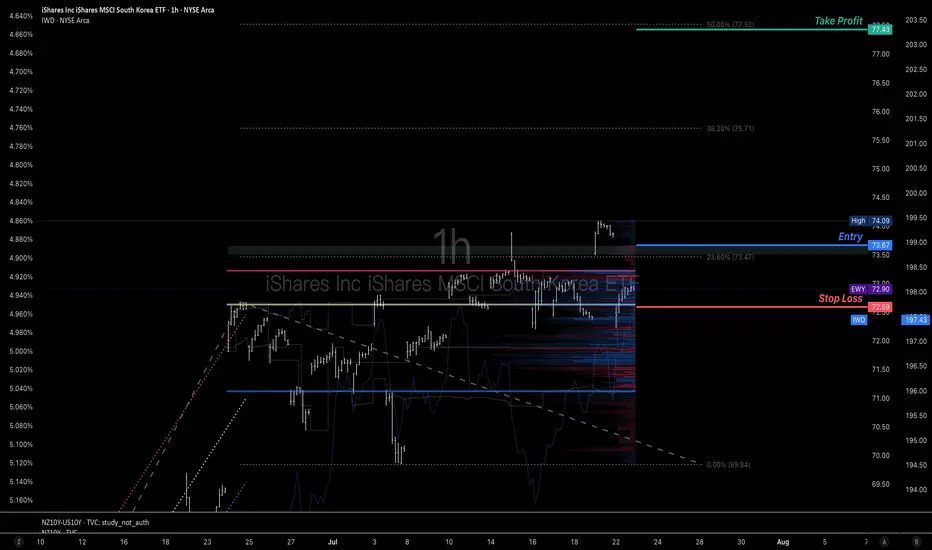
A potential chance to get long position of Korean equity marketsKorean economy and stock market emotion are well boosted by their regulation reform and new president elect. Many global traders miss the previous uptrend and the price is about to test the current resistance again.
Imma use a buy stop order @73.67 to try to get in the train to diverse my long position on equity market.
If you only do swing trades, there's a long swing trade plan on my chart. I may use the latest to take half of profit once the price hit the first or second resistance @77.43 above the current trading area to control the position size that can fit for long term trade.
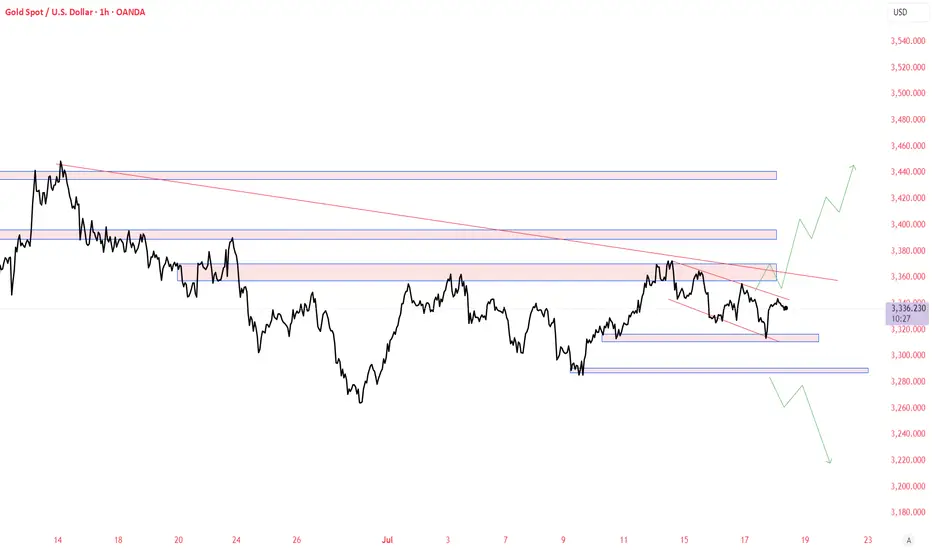
XAUUSD - Falling Wedge Parallel ChannelGold Volatility being more. Banks increasing the gold inventories, may surge to new highs. Sharing Some idea it may go either way some big rally or big correction.
This chart is only for educational purpose, Do your own study before taking any trades
AUDUSD InsightWelcome to all our subscribers!
Please share your personal opinions in the comments. Don't forget to like and subscribe!
Key Points
- Former U.S. Treasury Secretary Scott Bessent stated regarding Fed Chair Powell, “There is nothing that would make me say he should step down immediately,” — a remark that stands in contrast to previous comments made by former President Trump and his close aides.
- On U.S.-China trade negotiations, Secretary Bessent mentioned, “We will meet with Chinese officials in Stockholm on Monday and Tuesday to discuss extending the trade truce deadline.”
- Goldman Sachs has projected the U.S. growth rate this year at 1.1%. In a report, Jan Hatzius, Chief Economist at Goldman Sachs, estimated the probability of a U.S. recession at 30%, which is double the normal level.
Major Economic Events This Week
+ July 24: ECB Interest Rate Decision
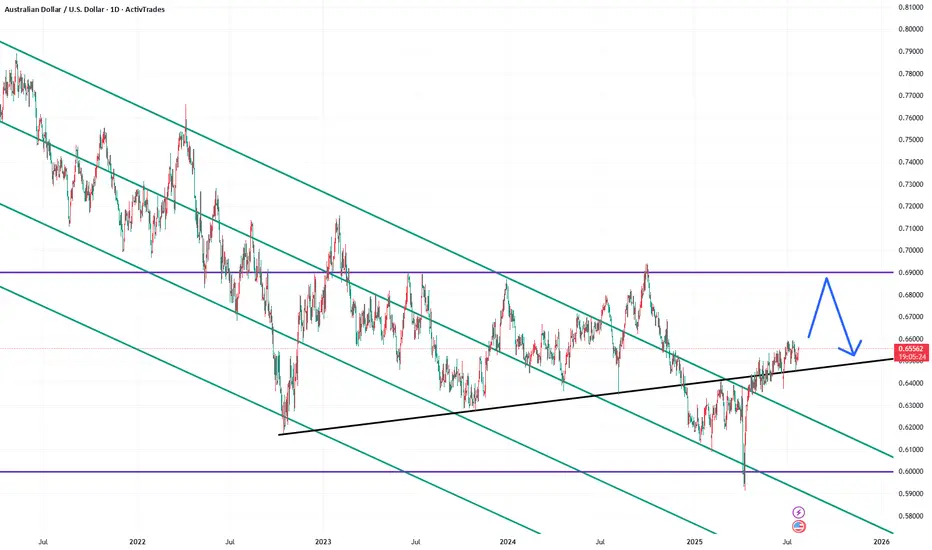
AUDUSD Chart Analysis
The pair continues a gentle upward trend within its channel. As previously anticipated, a long-term rise toward the 0.69000 level is expected. However, resistance is still observed around the 0.66000 level. A breakout above this zone could lead to a swift rise toward 0.67000. Still, there is minor resistance near 0.67000, which may temporarily limit upward momentum. A slight pullback may occur before another upward move resumes.
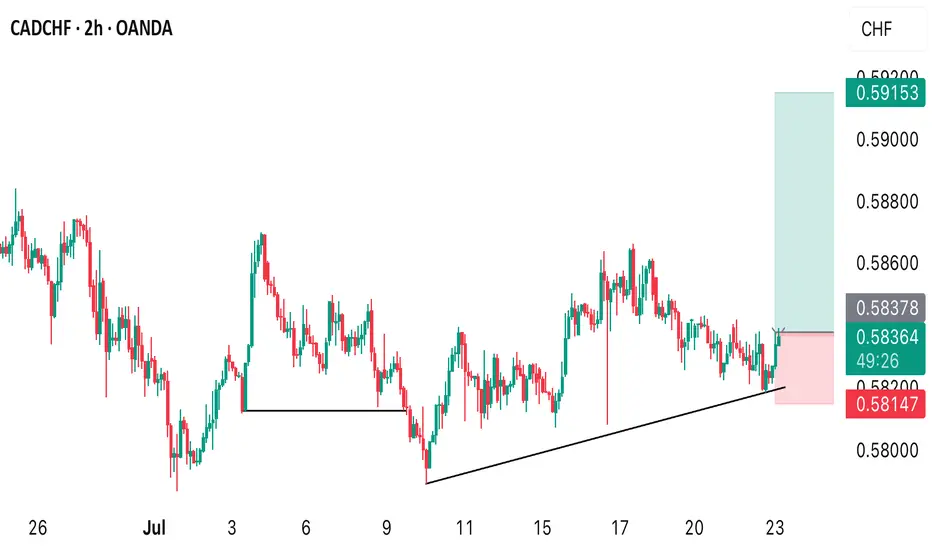
CADCHF POSSIBLE BUY OPPORTUNITY FROM THE CURRENT PRICE!There’s a possible buy opportunity from the current price as we saw a rebound from the daily timeframe low of 0.57896 multiple times. I anticipate buyers to dominate the market
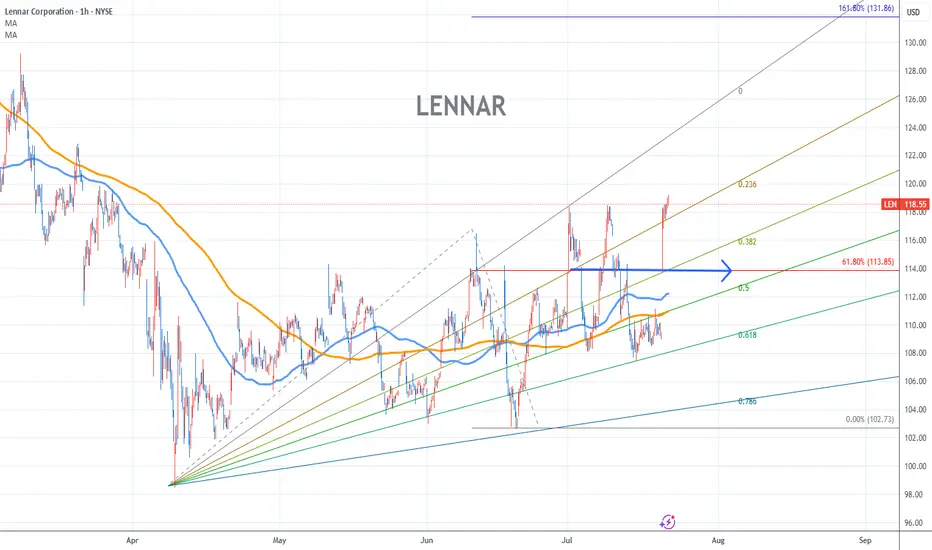
LENNAR Stock Chart Fibonacci Analysis 072225Trading Idea
1) Find a FIBO slingshot
2) Check FIBO 61.80% level
3) Entry Point > 114/61.80%
Chart time frame:B
A) 15 min(1W-3M)
B) 1 hr(3M-6M)
C) 4 hr(6M-1year)
D) 1 day(1-3years)
Stock progress:A
A) Keep rising over 61.80% resistance
B) 61.80% resistance
C) 61.80% support
D) Hit the bottom
E) Hit the top
Stocks rise as they rise from support and fall from resistance. Our goal is to find a low support point and enter. It can be referred to as buying at the pullback point. The pullback point can be found with a Fibonacci extension of 61.80%. This is a step to find entry level. 1) Find a triangle (Fibonacci Speed Fan Line) that connects the high (resistance) and low (support) points of the stock in progress, where it is continuously expressed as a Slingshot, 2) and create a Fibonacci extension level for the first rising wave from the start point of slingshot pattern.
When the current price goes over 61.80% level , that can be a good entry point, especially if the SMA 100 and 200 curves are gathered together at 61.80%, it is a very good entry point.
As a great help, tradingview provides these Fibonacci speed fan lines and extension levels with ease. So if you use the Fibonacci fan line, the extension level, and the SMA 100/200 curve well, you can find an entry point for the stock market. At least you have to enter at this low point to avoid trading failure, and if you are skilled at entering this low point, with fibonacci6180 technique, your reading skill to chart will be greatly improved.
If you want to do day trading, please set the time frame to 5 minutes or 15 minutes, and you will see many of the low point of rising stocks.
If want to prefer long term range trading, you can set the time frame to 1 hr or 1 day.
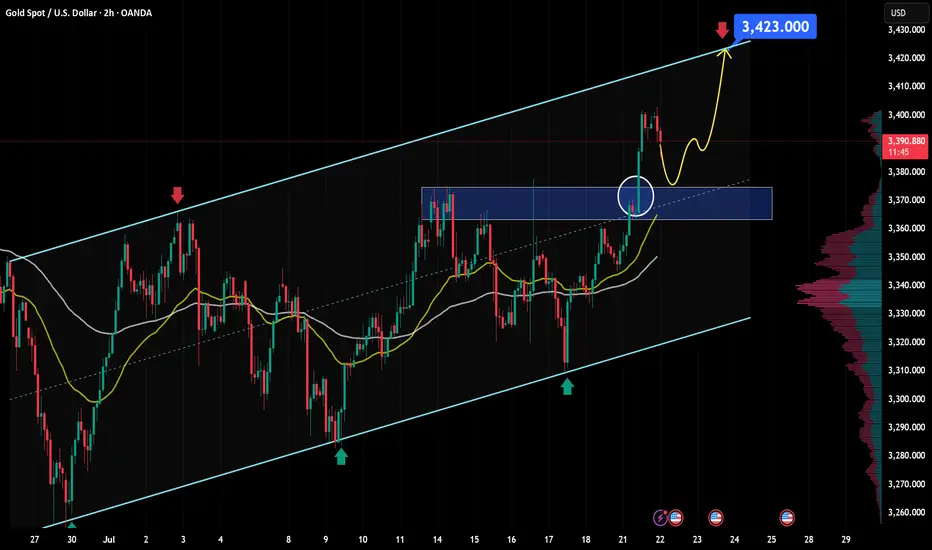
XAU/USD outlook: Bullish momentum building after breakoutGold saw a powerful rally yesterday, surging from $3,350 to nearly $3,400 — an impressive $50 move, equivalent to 500 pips.
From a macroeconomic perspective, this recent uptrend in gold is driven by a combination of supportive factors. First, the U.S. dollar has shown clear signs of weakness following dovish signals from several Federal Reserve officials, who hinted at potential rate cuts if the U.S. economy begins to slow. In addition, geopolitical risks such as renewed U.S.–China trade tensions, instability in the Middle East, and slowing growth in China are all pushing investors toward safe-haven assets like gold. Another key driver is the ongoing accumulation of gold by central banks worldwide — particularly China and Turkey — highlighting gold’s growing appeal as a strategic reserve asset. Together, these factors have built a strong foundation for gold’s upward momentum, explaining why prices remain above yesterday’s opening level, despite the current short-term pullback.
From a technical and short-term outlook, gold (XAU/USD) continues to show a bullish setup supported by both price structure and market sentiment. On the H2 timeframe, gold remains in a clear uptrend, with a series of higher highs and higher lows. After breaking through a strong resistance zone around $3,374 (aligned with the 0.5 Fibonacci level), price surged to a peak of $3,403 before entering a healthy retracement phase.
Currently, the $3,367–$3,374 zone is acting as newly-formed support — a key confluence area that aligns with:
A former resistance now flipped into support,
The 0.5–0.618 Fibonacci retracement cluster,
And a bullishly aligned short-term EMA structure.
In the short term, as long as this support zone holds, the bullish outlook remains valid. A successful retest of this area could reignite buying pressure, with the next target set around $3,423 — in line with the projected extension of the previous bullish leg.
However, if buyers fail to defend this zone, the bullish setup could be invalidated or lose momentum. This area warrants close monitoring of price action and volume behavior to confirm the next directional move.
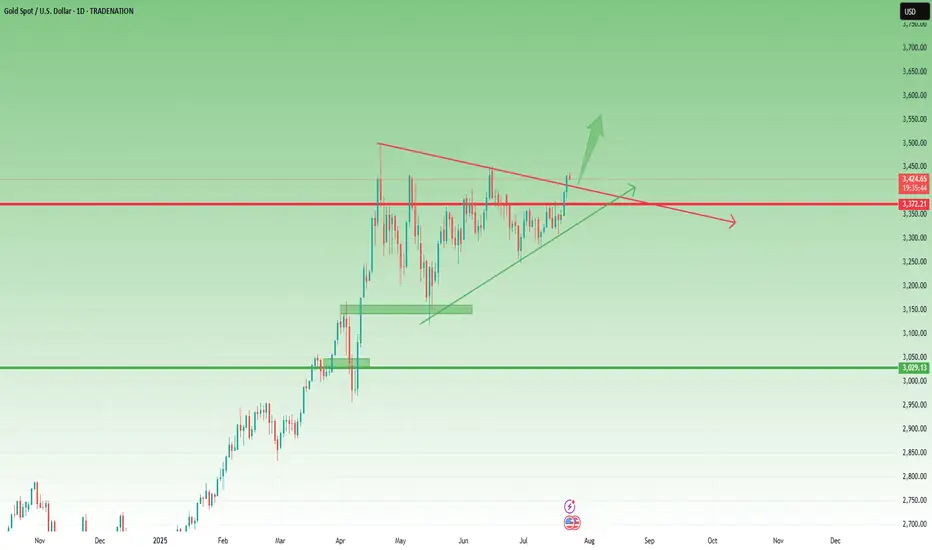
Gold Update – Strong Breaks, Strong BullsYesterday, after the break of the key 3370 resistance, Gold corrected slightly toward 3383, then consolidated briefly in that area. From there, it launched into a strong new leg up, closing the day once more near the highs, around 3430.
📌 What’s important here is that the price did not even come back to retest the broken resistance — now turned support. Combined with the strong daily close near the high of the range, this gives us a clear message:
➡️ Bulls are in full control.
________________________________________
🔍 This Week – Three Key Breaks
So far this week, Gold has delivered three major breakouts:
• ✅ A clean breakout from the box consolidation that kept price stuck and indecisive last week
• ✅ A decisive break above the 3400 psychological figure
• ✅ A breakout above the symmetrical triangle resistance, which had been forming since late April
Each of these is significant on its own. Together, they suggest a shift toward a more aggressive bullish scenario.
________________________________________
🔮 What’s Next?
All these breakouts point to the potential for more gains ahead.
In fact, the next logical step could be an attempt to mark a new All-Time High.
My view remains the same:
Buying dips remains the strategy of choice, with a focus on the 3400 zone as a key support area, and a swing target around 3500.
Disclosure: I am part of TradeNation's Influencer program and receive a monthly fee for using their TradingView charts in my analyses and educational articles.
Japan 225: Breakout Watch as Tariff Cut Fuels RallyThe Japan 225 contract is ripping higher today on a trade deal being reached between the U.S. and Japan, including the apparent lowering of auto tariffs to 15%.
The price has already bounced strongly from uptrend support established in May, putting a potential retest of the June 30 high of 40854 on the cards. With momentum indicators perking up—pointing to building bullish momentum—the case for a topside break is improving.
If the price can break and hold above the June 30 high, watch for a potential run towards 41000—a level that saw plenty of action back in 2024. It looms as a decent level to build setups around.
If the price breaks and holds above 41000, consider establishing longs with a tight stop beneath the level for protection. 41600 and 42480 screen as potential targets, depending on desired risk-reward.
While the setup could be flipped if the price stalls beneath 41000, just how much downside would be forthcoming given the current mood is questionable.
Good luck!
DS

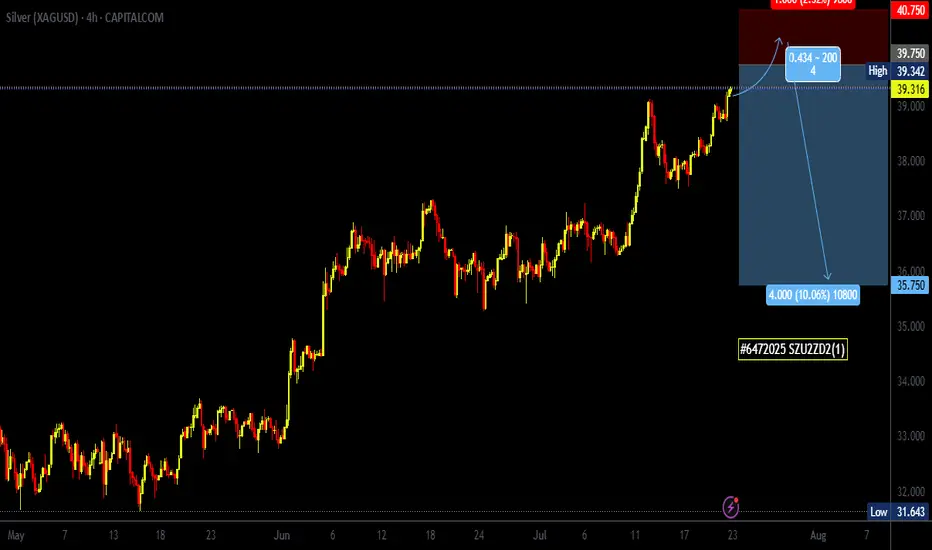
#6472025 | XAGUSD Selling opportunity 1:4XAGUSD Selling opportunity Appears in H4 Time Frame Looking Price Action for Long Term Sell
Risk and Reward Ratio is 1:4
After 50 pips Profit Set SL Entry Level
"DISCLAIMER" Trading & investing business is "Very Profitable" as well as risky, so any trading or investment decision should be made after Consultation with Certified & Regulated Investment Advisors, by Carefully Considering your Financial Situation.
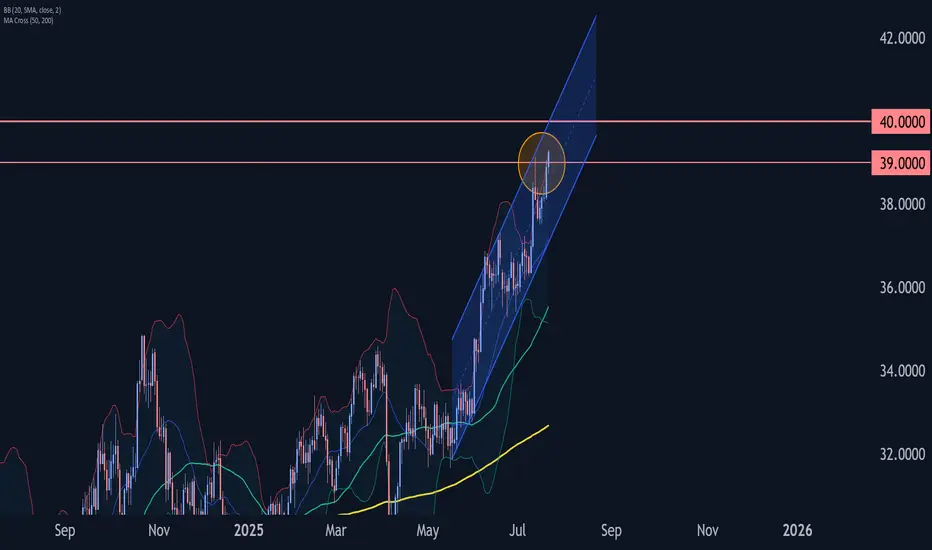
Silver Wave Analysis – 22 July 2025
- Silver broke resistance level 39.00
- Likely to rise to resistance level 40.00
Silver recently broke the resistance level 39.00, which stopped the previous impulse wave i earlier this month, as can be seen from the daily Silver chart below.
The breakout of the resistance level 39.00 should accelerate the active impulse waves 5 and (C).
Given the clear daily uptrend, Silver can be expected to rise to the next resistance level 40.00, target price for the completion of the active impulse wave iii.
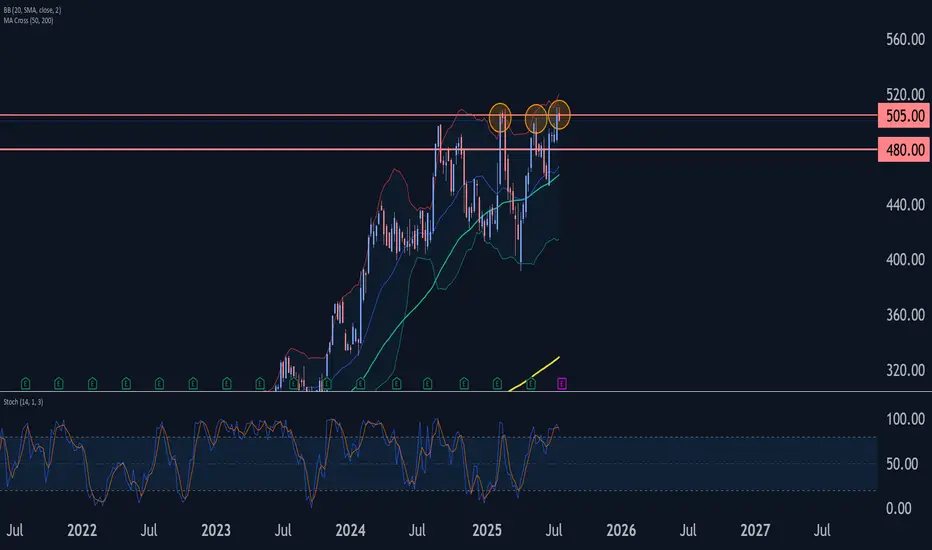
Race Wave Analysis – 22 July 2025
- Race reversed from long-term resistance level 505.00
- Likely to fall to support level 480.00
Race recently reversed down from the strong long-term resistance level 505.00, which has been reversing the price from the start of 2025, as can be seen below.
The resistance level 505.00 was strengthened by the upper daily and weekly Bollinger Bands.
Given the strength of the resistance level 505.00 and the overbought weekly Stochastic, Race can be expected to fall to the next support level 480.00.
Bitcoin Wave Analysis – 22 July 2025
- Bitcoin reversed from support level 116065.00
- Likely to rise to resistance level 122775.00
Bitcoin cryptocurrency recently reversed up from the key support level 116065.00, which also stopped the earlier minor correction 2 at the start of June.
The support level 116065.00 was further strengthened by the support trendline of the daily up channel from June and the 38.2% Fibonacci correction of the upward impulse from July.
Given the strong daily uptrend, Bitcoin cryptocurrency can be expected to rise further to the next resistance level 122775.00 (which stopped the previous impulse wave 1).

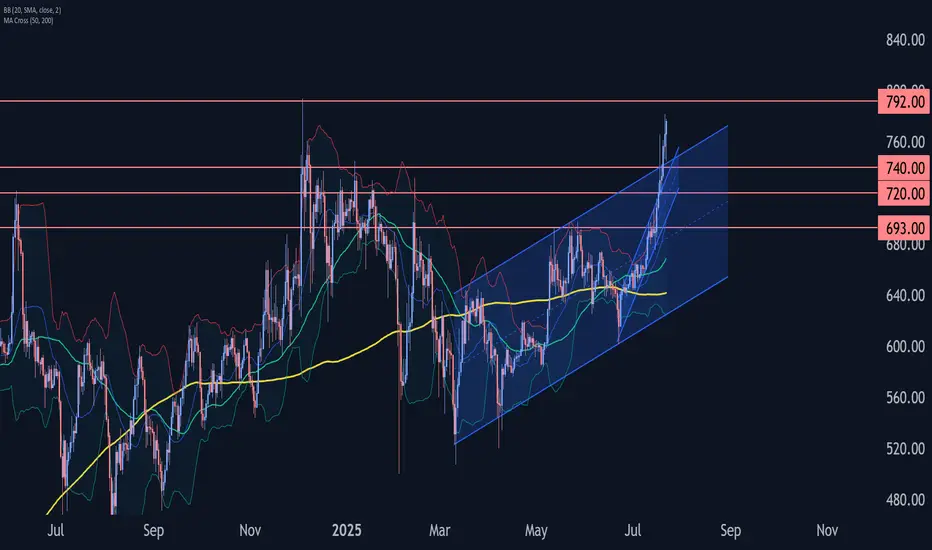
BNB Wave Analysis – 22 July 2025- BNB rising inside sharp impulse wave C
- Likely to rise to resistance level 792.00
BNB cryptocurrency continues to rise inside the sharp upward impulse wave C, which previously broke through the 3 strong resistance levels 693.00, 720.00 and 740.00.
The breakout of the resistance level 720.00 coincided with the breakout of the daily up channel from June – which accelerated the active impulse wave C.
Given the strong daily uptrend, BNB cryptocurrency can be expected to rise further to the next resistance level 792.00 (former multi-month high from last December).
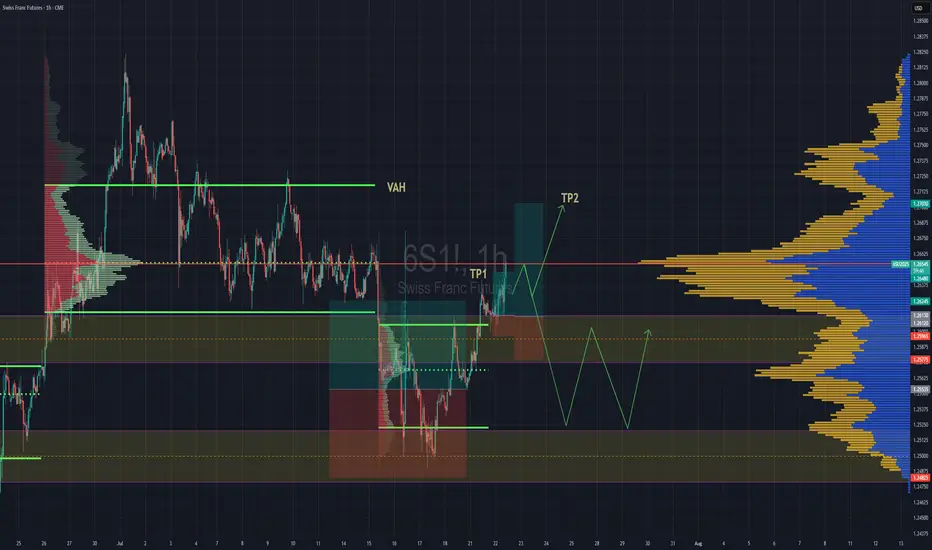
Swiss Gaining Momentum Against The DollarSwiss futures gaining strength against the dollar. We have broken back into previous rotation that was somewhat balanced, but still leaning towards a "b" style volume profile . If we are able to get above the POC, then we''ll go straight for TP2 close to Value are high.
If the POC is really strong and we reject hard from the POC then we might lose the value area and fall back down to previous value area to continue consolidation there until further notice.
GBPNZD to form a higher low?GBPNZD - 24H expiry
The medium term bias remains bullish.
Price action looks to be forming a bottom.
Preferred trade is to buy on dips.
Bespoke support is located at 2.2515.
Risk/Reward would be poor to call a buy from current levels.
We look to Buy at 2.2515 (stop at 2.2475)
Our profit targets will be 2.2675 and 2.2710
Resistance: 2.2660 / 2.2720 / 2.2770
Support: 2.2510 / 2.2420 / 2.2375
Risk Disclaimer
The trade ideas beyond this page are for informational purposes only and do not constitute investment advice or a solicitation to trade. This information is provided by Signal Centre, a third-party unaffiliated with OANDA, and is intended for general circulation only. OANDA does not guarantee the accuracy of this information and assumes no responsibilities for the information provided by the third party. The information does not take into account the specific investment objectives, financial situation, or particular needs of any particular person. You should take into account your specific investment objectives, financial situation, and particular needs before making a commitment to trade, including seeking advice from an independent financial adviser regarding the suitability of the investment, under a separate engagement, as you deem fit.
You accept that you assume all risks in independently viewing the contents and selecting a chosen strategy.
Where the research is distributed in Singapore to a person who is not an Accredited Investor, Expert Investor or an Institutional Investor, Oanda Asia Pacific Pte Ltd (“OAP“) accepts legal responsibility for the contents of the report to such persons only to the extent required by law. Singapore customers should contact OAP at 6579 8289 for matters arising from, or in connection with, the information/research distributed.
