GBPUSD: Mid-Term Analysis💷
Everyone wants to catch the move, but the real edge comes from patience.
🛡️ The Situation:
GBPUSD has shown strength, but chasing here isn’t my game.
📍 The Plan:
According to orderflow, the next buying point is in the blue box I’ve marked.
That’s where I let the market come to me.
🔎 What I need to see there:
✅ Footprint absorption (clear buyers stepping in)
✅ CDV support or divergence
✅ Structure reclaim for clean confirmation
💡 Why it matters:
Anyone can hit buy, but buying at the right place with confirmation is how you stay in the game.
🎯 What’s next:
If price returns to the blue box and confirms, I will execute with clear risk.
If not, I’ll stay patient and let the market prove itself.
✅ Summary:
Let price come to your level, confirm, and then act decisively.
No chasing. No fear. Just clear, disciplined execution.
Support and Resistance

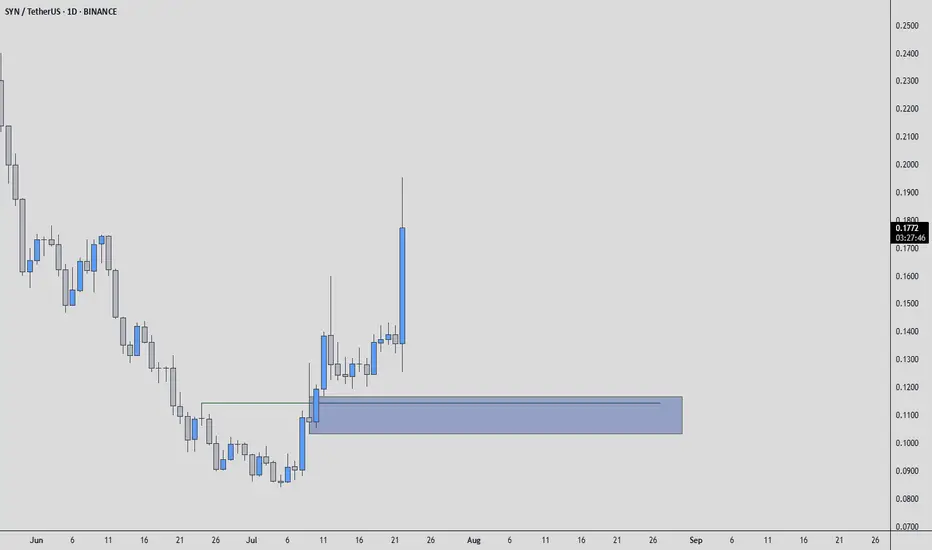
SYNUSDT: Mid-Term AnalysisPrice is rising strongly.
The blue box is a fair price to join as a buyer if the market gives it.
I’m not chasing high prices. If price returns to my blue box, I’ll watch for:
✅ Footprint absorption
✅ CDV support
✅ Structure reclaim
If these align, I’ll consider a long with clear risk. If not, I’ll wait.
The right price, or no trade.
📌I keep my charts clean and simple because I believe clarity leads to better decisions.
📌My approach is built on years of experience and a solid track record. I don’t claim to know it all but I’m confident in my ability to spot high-probability setups.
📌If you would like to learn how to use the heatmap, cumulative volume delta and volume footprint techniques that I use below to determine very accurate demand regions, you can send me a private message. I help anyone who wants it completely free of charge.
🔑I have a long list of my proven technique below:
🎯 ZENUSDT.P: Patience & Profitability | %230 Reaction from the Sniper Entry
🐶 DOGEUSDT.P: Next Move
🎨 RENDERUSDT.P: Opportunity of the Month
💎 ETHUSDT.P: Where to Retrace
🟢 BNBUSDT.P: Potential Surge
📊 BTC Dominance: Reaction Zone
🌊 WAVESUSDT.P: Demand Zone Potential
🟣 UNIUSDT.P: Long-Term Trade
🔵 XRPUSDT.P: Entry Zones
🔗 LINKUSDT.P: Follow The River
📈 BTCUSDT.P: Two Key Demand Zones
🟩 POLUSDT: Bullish Momentum
🌟 PENDLEUSDT.P: Where Opportunity Meets Precision
🔥 BTCUSDT.P: Liquidation of Highly Leveraged Longs
🌊 SOLUSDT.P: SOL's Dip - Your Opportunity
🐸 1000PEPEUSDT.P: Prime Bounce Zone Unlocked
🚀 ETHUSDT.P: Set to Explode - Don't Miss This Game Changer
🤖 IQUSDT: Smart Plan
⚡️ PONDUSDT: A Trade Not Taken Is Better Than a Losing One
💼 STMXUSDT: 2 Buying Areas
🐢 TURBOUSDT: Buy Zones and Buyer Presence
🌍 ICPUSDT.P: Massive Upside Potential | Check the Trade Update For Seeing Results
🟠 IDEXUSDT: Spot Buy Area | %26 Profit if You Trade with MSB
📌 USUALUSDT: Buyers Are Active + %70 Profit in Total
🌟 FORTHUSDT: Sniper Entry +%26 Reaction
🐳 QKCUSDT: Sniper Entry +%57 Reaction
📊 BTC.D: Retest of Key Area Highly Likely
📊 XNOUSDT %80 Reaction with a Simple Blue Box!
📊 BELUSDT Amazing %120 Reaction!
📊 Simple Red Box, Extraordinary Results
📊 TIAUSDT | Still No Buyers—Maintaining a Bearish Outlook
📊 OGNUSDT | One of Today’s Highest Volume Gainers – +32.44%
📊 TRXUSDT - I Do My Thing Again
📊 FLOKIUSDT - +%100 From Blue Box!
📊 SFP/USDT - Perfect Entry %80 Profit!
📊 AAVEUSDT - WE DID IT AGAIN!
I stopped adding to the list because it's kinda tiring to add 5-10 charts in every move but you can check my profile and see that it goes on..
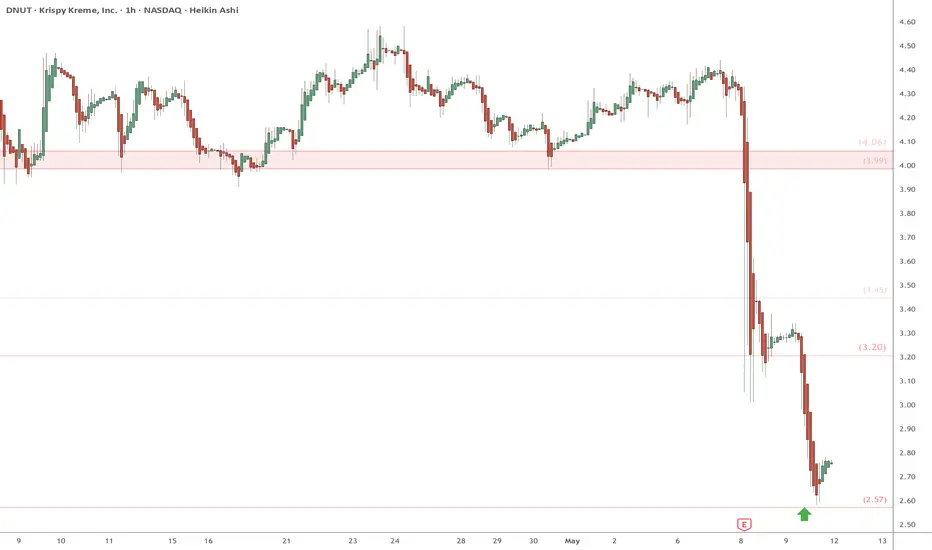
DNUT eyes on $2.57: if this HAS a bottom, THIS may be the oneDNUT has been in free fall since IPO.
Last Earnings were apparently horrible.
But there is a glimmer of hope of bottom.
$2.57 is a minor but significant fib.
The PING bounce on it is of interest.
"Ping" from "give me a ping Vasilly".
=====================================
.
AUDUSD Ready to enter Buy?✅ **Market & Timeframe:**
AUD/USD, 1‑hour chart.
✅ **Overall Bias (multi‑timeframe):**
* Weekly: Bullish
* Daily: Bearish
* 12H: Bullish
* 6H: Bullish
* 4H: Bullish
➡️ **≈ 80% Bullish bias overall.**
✅ **Pattern & Structure:**
You’ve clearly highlighted an **Inverse Head and Shoulders**:
* Left Shoulder near 0.6520
* Head near 0.6500
* Right Shoulder near 0.6525
Price has broken above the neckline (\~0.6540 area).
✅ **Key Levels:**
* **Daily AOI (Area of Interest):** 0.6537–0.6541
(price currently above, expected to retest this zone)
* **Next upside target:** 0.6588–0.6590
* **Major support:** Lower Daily AOI around 0.6466–0.6490
✅ **Moving Averages:**
* Blue MA (shorter) is above red MA (longer) – showing upward momentum.
✅ **Price Action Plan (illustrated by your arrows):**
1. Price has just broken out above the neckline.
2. Expecting a **retest back into Daily AOI (\~0.6540)**.
3. Looking for bullish confirmation there (e.g., bullish candlestick pattern) to enter **long**.
4. Targeting the resistance zone around **0.6588–0.6590**.
---
📌 **Summary:**
Your chart signals an **80% bullish setup**.
✅ Inverse head & shoulders → breakout above neckline.
✅ Wait for price to pull back into Daily AOI (0.6537–0.6541).
✅ Look for bullish confirmation → then enter long.
🎯 Target: \~0.6588–0.6590.

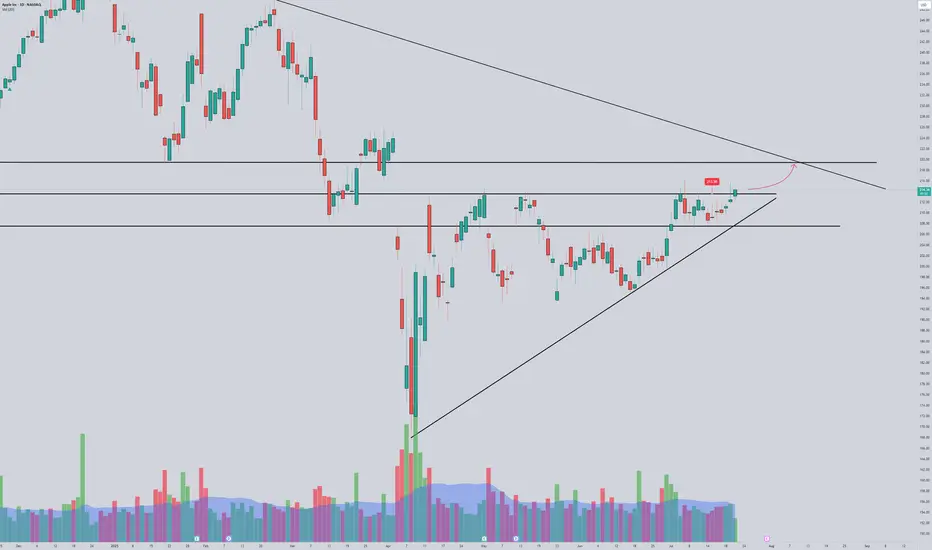
AAPL next leg up?A daily close above 213.75 could set AAPL to move towards 220
We are retesting some strong resistance at 215, and above it we could see price moving faster to retest trendline.
Keeping this on the watch as ERs is not far and we can see a pre run
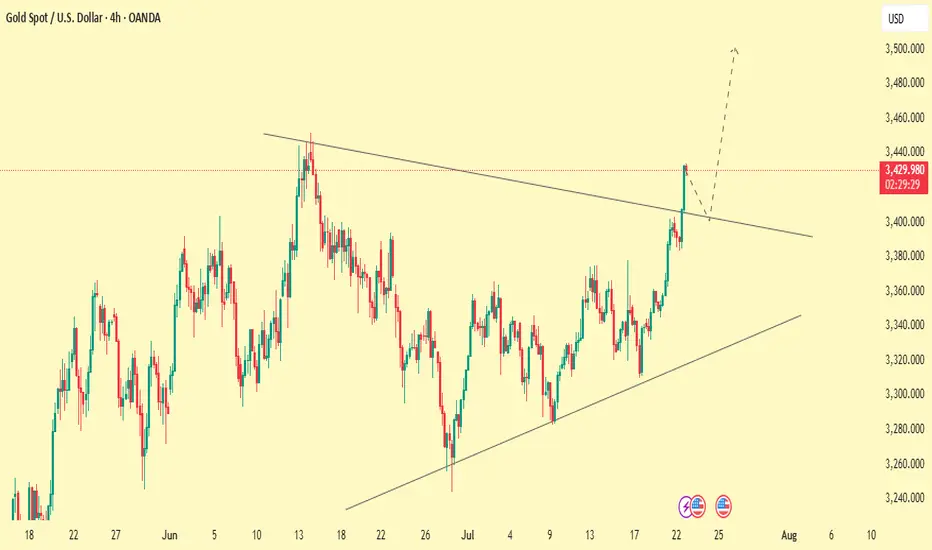
XAUUSDGold is trading inside a rising wedge on the 4H chart — typically a bearish reversal pattern but often bullish during strong trends. Price consistently respects this zone during retracements, offering reliable bounce setups. Each Golden Pocket bounce aligns with a rising trendline, strengthening the support zone.
Price is hovering below upper wedge resistance — suggesting a possible pullback to the lower trendline. Another bounce at Golden Pocket + trendline could offer a long entry. A breakdown below trendline support could shift sentiment toward a deeper correction.
If You Fallow our analysis and enjoy from this analysis
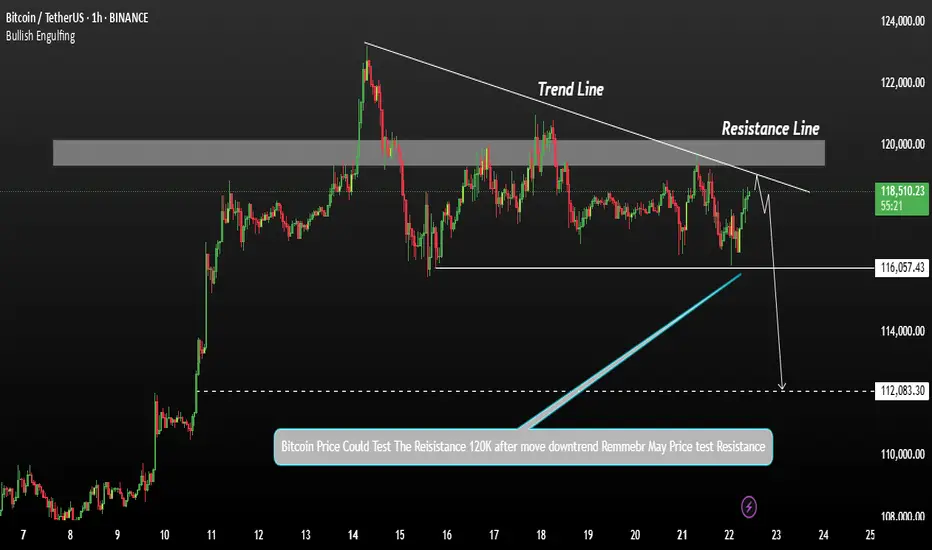
Bitcoin shows signs of a potential declineBitcoin's price shows signs of a potential decline after testing resistance levels. A correction at this stage is generally a healthy sign for the market, allowing for consolidation before any strong upward move.
Bitcoin may test the resistance line after the current decline. If the price falls below 118,000, there is interim support, but further downside may be expected. 116K and 112K A break below 112,000 could open the door for deeper bearish momentum.
You May find more details in the chart.
Trade wisely best of Luck.
Ps Support with like and comments for better analysis Thanks for Supporting.
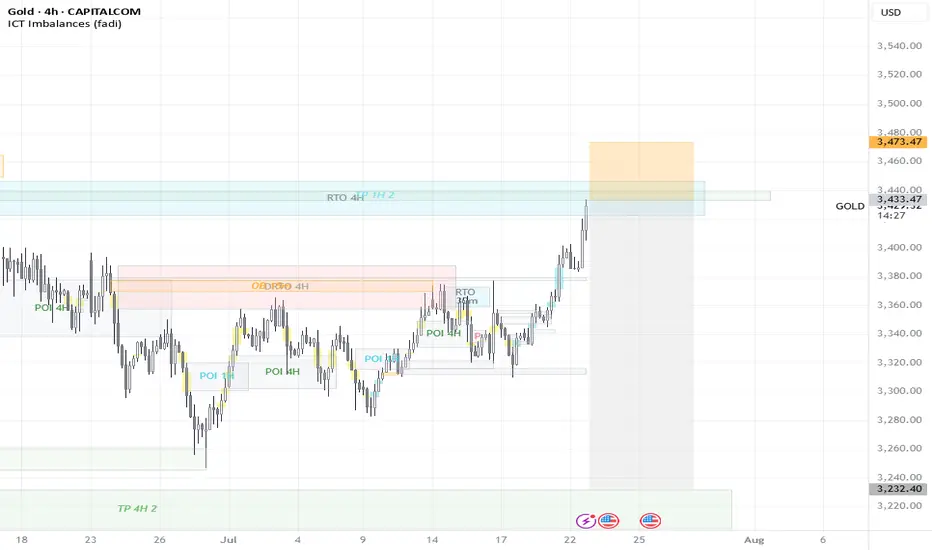
GOLD Price Can rise catch the ResistanceGold is currently showing strong underlying momentum, although it is undergoing a short-term correction from the 3400 level. This pullback appears to be driven by profit-taking ahead of Fed Chair Jerome Powell’s upcoming speech, as well as uncertainty around U.S. trade negotiations with the EU and Japan expected to conclude before August 1.
Resistance Levels: 3420 / 3440
Immediate Support: 3375
A false breakout below resistance could result in a retest of 3375 before resuming upward momentum.
You can see more details in the chart.
Ps support with like and comments for better analysis Thanks.

Gold Sell 4hGold ready to sell ... See 4 Hour timeframe to get entry with your own confirmations..get partial entries with your confirmations.. check the fundamental analysis too
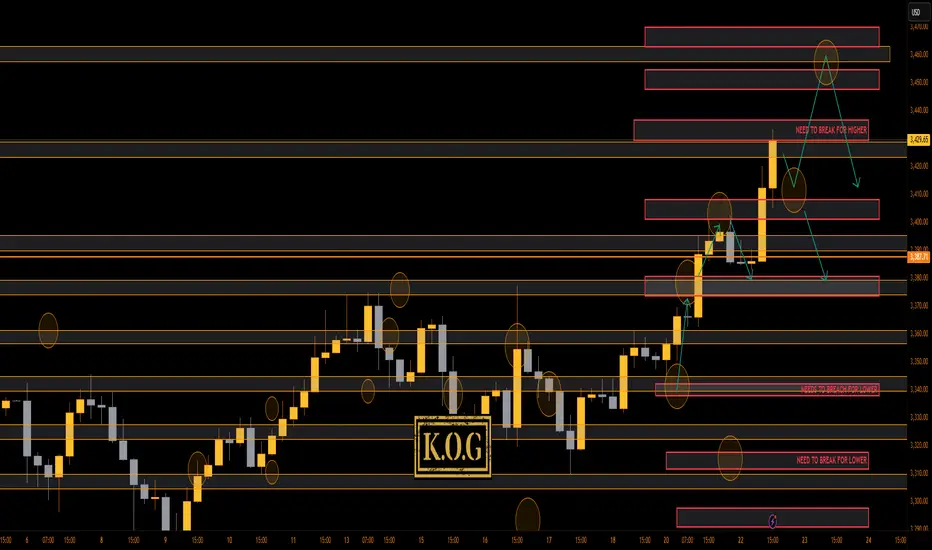
THE KOG REPORT - UpdateA rare day for us today even though we got the level for the short from above, we activated again, and due to everything lining up confirming the short into the lower order region where we wanted to bounce, we took it. Gold, had other plans, engulfing upside resulting in us having to SL the trade. It then went on to break above and complete our daily targets.
You win some, you lose some!
Now, we have support below at the 3410 region which will need to break to change short-term structure, while there is the order region above 3430-35 which could hold price and accumulate. All our bullish targets for the day are completed, we just wanted lower to then go higher.
If lower support can be targeted and held, we could see a move higher into the 3345-50 region before then a reaction in price. I'm still not happy with this move, something doesn't quite look right, so let's play it day by day.
RED BOXES:
Break above 3395 for 3404✅, 3410✅ and 3420✅ in extension of the move
Break below 3375 for 3368 and 3355 in extension of the move
As always, trade safe.
KOG
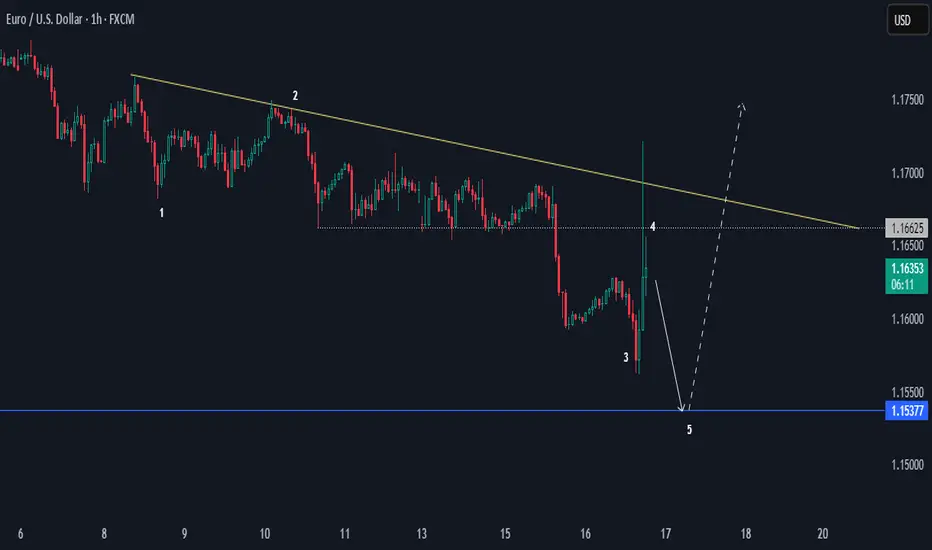
EURUSD Bearish Sentiments Below LowEURUSD looks bearish at H1 for a bias of 1.15377. It's an unusual price action; the overall trend in a higher time frame is bullish, but the 1.1700 had strong bearish pressure.
The current momentum is bearish below 1.16625, making that level a key area zone.
Happy Trading,
K.
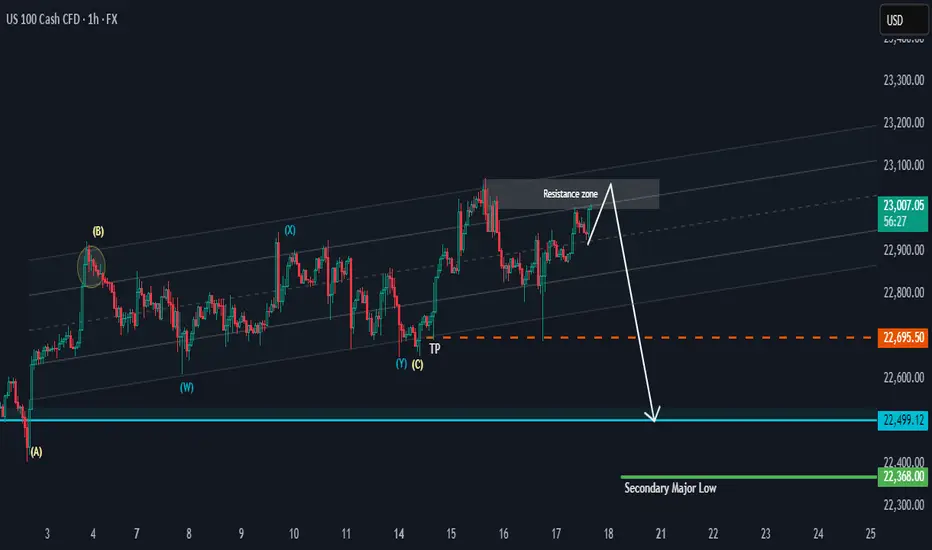
NAS 100 Potential PullbackHi there,
NAS100 has the potential to drop as it keeps testing the resistance zone in the range of 23100. This looks more like bull exhaustion than a reversal. The 22695.50 is the target for a bias of 22499.12
The overall bigger trend is bullish, with price highs aiming as far as 23717.44, 24837.28, and 26222.31, making this a potentially massive bullish trend, and it will take time to reach those highs.
Happy Trading, 🌟
K.
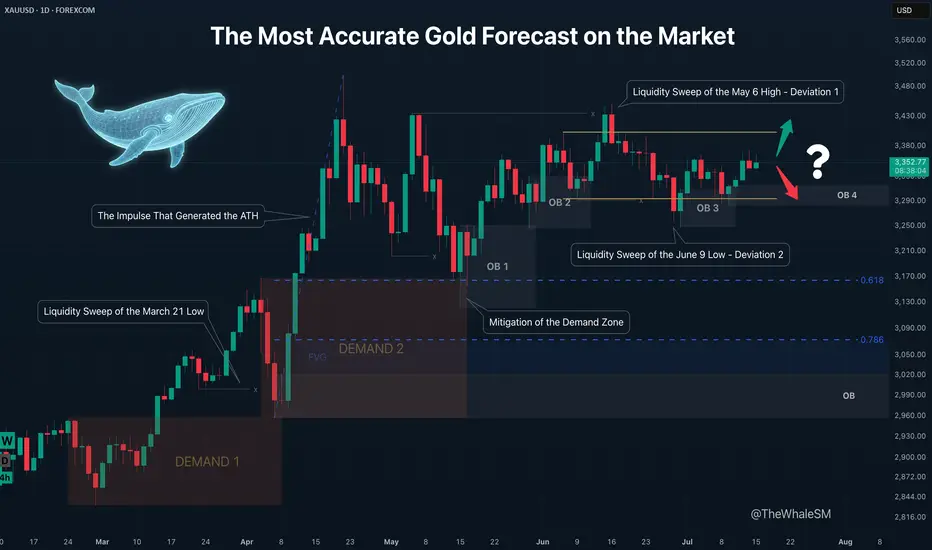
The Most Accurate Gold Forecast on the MarketThis is a continuation of sorts of my educational article that received an "Editor's Pick" from TradingView and a large number of positive reactions from this amazing trading community. However, unlike that post, this is a trade idea that outlines clear entry conditions for when the price reaches a relevant manipulation zone and shows a reversal reaction. If you don't want to get into the details and trace the entire chain of events through which large capital brought the price to its current levels, feel free to skip the intro and go straight to the 4H chart with the long setup conditions.
To better understand the logic of "smart money," let's revisit the Gold daily timeframe from my educational article:
We will approach this analysis like detectives, following the facts and footprints in the style of Sherlock Holmes and Hercule Poirot.
So, let's begin our investigation. On the daily structure, we see a clear order flow confirming the intention of large capital to lead the price in continuation of the uptrend. After the latest impulse that began on February 28th and ended on April 3rd, the price corrected and mitigated the DEMAND1 manipulation zone. The "Whale" refueled with liquidity, eliminated some competitors, closed its losing short positions used for the manipulation, and gained energy for the next impulse that set a new ATH. The correction that mitigated the DEMAND1 zone was nothing other than the next manipulation, also in the form of a DEMAND zone, within which there is a still-valid daily order block. How can we assert that DEMAND 2 is a manipulation and not just a correction?
Firstly, the sharp nature of the move swept liquidity from the March 21st low. Secondly, the sharp upward impulse accompanied by a series of FVGs showed the Whale's true intention. And thirdly, the reversal from this DEMAND 2 zone, combined with the 61.8% Fib retracement level, resulted in the formation of the next manipulation in the form of the OB 1 order block. Further, we see the continuation of the order flow on this daily structure; the price reacts to OB1, forming another order block, OB2 . The impulse from OB2 sweeps liquidity from the May 6th high. Many might have expected a continuation of the impulse and a new ATH instead of a sweep of this high, but as often happens when too many participants pile into one direction, the price sharply reverses and liquidates their positions. This intense decline after sweeping the high looked something like a local trend change from bullish to bearish, but the sharp recovery after sweeping the liquidity from the June 9th low and forming a new order block, OB 3 , finally revealed what was really happening: it turned out to be a range . It's impossible to identify a range until it is fully formed. A range is another type of manipulation where internal and external liquidity is swept from both sides. In our case, there was first a deviation above (Deviation 1 on the chart), then a deviation below (Deviation 2), after which the price swept some internal liquidity and got stuck exactly in the middle of the range.
And finally, after all our investigations and deductions, we can say with absolute certainty, practically with 100% confidence divided by two, that ABSOLUTELY NO ONE KNOWS where the price will go from the current levels. Because the center of a range is a state of complete uncertainty. Moreover, I dare to suggest that even the Whales don't know where the price will go right now. They certainly have enormous funds to sharply move prices at the right moments to capture liquidity and conduct manipulations. At other times, they can nudge the market to create a trend and direct it like a chain reaction of falling dominoes. But the entire market is much larger, and if its sentiment changes drastically due to external factors, smart money won't waste its resources fighting it. Their goal is to make more money, nothing personal. Why else is the price stuck in the middle right now? Inflation data is coming out soon, which could push the price in an unpredictable direction. The Whales will wait to use this news-driven impulse to their advantage.
So, what have we concluded from this investigation? Was it all in vain since we can't even say with 51% probability where the price will go next? Of course not. We simply need to wait for the price to reach an area where the probability of it moving in a certain direction is significantly higher than 50% — that's all you need to be profitable in the long run. This probability will never be close to 100% because we don't know what's really happening in the depths of the market. Are the Whales accumulating positions in this range now, or are they selling off at high prices after the ATH? Unless you are one of the few direct participants in large capital, you can't know this. Moreover, you don't need to know it to make a consistent profit in the market. It is enough for us to predict the next move of smart money with high probability at certain moments, join their movement, and take our profit. It's like a weather forecast: the further from the current date, the lower the probability of it being accurate. It's the same with the market; a completely unpredictable combination of factors, news, and hidden internal processes can lead the price on a unique path, but always accompanied by smart money. It doesn't matter where the gold market goes next, whether to a new ATH or down to the next correction level. When the Whale reveals itself again by leaving a trail in the form of a manipulation, we can lie in wait near it and join its next move. Why is it generally a good idea to enter from manipulation zones? You are essentially stepping onto a field where the Whale has already cleared the liquidity, and it has returned to that place for other business — to close its losing positions. That is, a mitigated manipulation zone is a safer place to enter the market; there's a much lower chance the Whale will absorb your position. Right now, we have such a manipulation in the form of the OB 4 order block, and we can switch to the 4H timeframe to look at a potential entry zone in more detail.
4H CHART - SETUP CONDITIONS
So, we already know the general context: the price is inside a range. After the second deviation, it has already reacted to the order block formed after it, and we are waiting for the mitigation of the next one, OB 4 , which will serve as a pivot point for a potential setup. A reversal from this order block will confirm the order flow for the price to move at least to the upper boundary of the range. The presence of a manipulation zone alone is not enough to open a position; additional confirming conditions are always needed. As one such condition here, we can take the combination of mitigation with one of the Fibonacci retracement levels — 61.8% or 78.6%. Upon reaching each level, the price must hold (not be broken by the bodies of 1-4H candles) and show a reversal reaction. The final confirmation for entry will be an LTF confirm in the form of a break of structure (BOS) or the beginning of order flow on a lower timeframe. An important part of the context is that important US inflation news is coming out soon, and positions should not be opened right before it or for some time after (at least an hour).
Invalidation of the long scenario would be a break below the 78.6% level and OB 4.
~~~~~~~~~~~~~~~~~~~~~~~~~~~~~~~~~~~~~~~~~~~~~~~~~~~~~~~~~~~~~~~~~
If you found this analysis helpful, support it with a Boost! 🚀
Have a question or your own view on this idea? Share it in the comments! I read every single one. 💬
► Follow me on TradingView for more educational content like this and to not miss my next detailed trade idea .
~~~~~~~~~~~~~~~~~~~~~~~~~~~~~~~~~~~~~~~~~~~~~~~~~~~~~~~~~~~~~~~~~
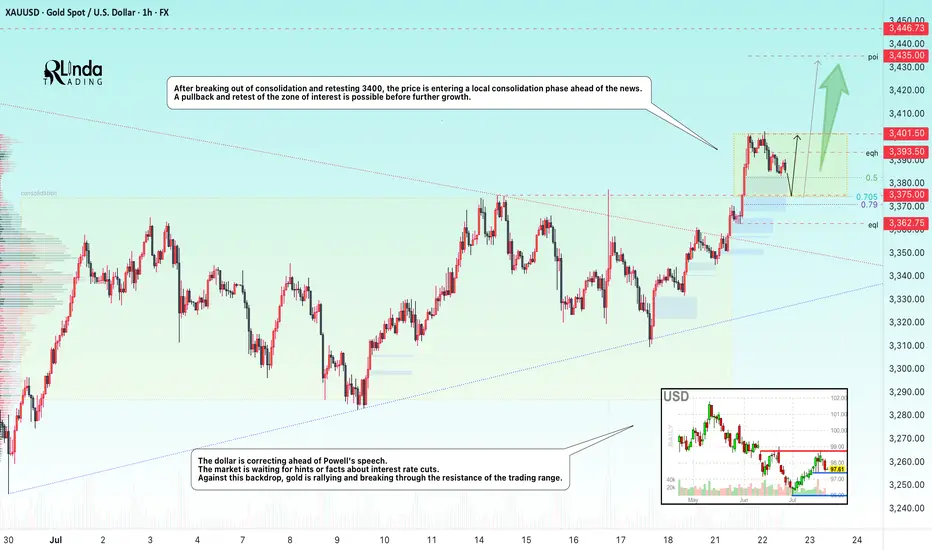
GOLD → Correction before continuing the rally to 3450FX:XAUUSD updates its local maximum to 3401.5 and enters a consolidation phase ahead of news. The dollar correction gives speculators a chance...
The price of gold is correcting from 3400. The reason is profit-taking ahead of Powell's speech at 12:30 GMT and waiting for clarity on US trade negotiations with the EU and Japan before August 1.
Gold remains sensitive to the progress of negotiations and the dynamics of the dollar, which is weakening amid political uncertainty, declining yields, and pressure on the Fed from Trump.
Technically, after exiting consolidation and retesting 3400, the price is entering a local consolidation phase.
Focus on key levels: 3401, 3382, 3375. A false breakdown of support could trigger a recovery phase.
Resistance levels: 3402, 3393
Support levels: 3382, 3375, 3362.75
The distribution phase has been halted by resistance, and the price has moved into a countertrend correction due to uncertainty. Markets are waiting for positive signals from the Fed. Local and global trends are bullish, which may support the price overall...
Best regards, R. Linda!
HolderStat┆ETHUSD approaching $4kOKX:ETHUSDT continues its move after breaking above $2,900. Next resistance sits around $3,500. Uptrend remains intact while above $2,875.

GoHealth | GOCO | Long at $6.05GoHealth NASDAQ:GOCO is a health insurance marketplace and Medicare-focused digital health company that uses a technology platform with machine-learning algorithms to match consumers with Medicare plans (Advantage, Supplement, Part D) and individual health insurance. Understandably, a lot of investors aren't bullish on this stock given all of the healthcare provider and services headwinds. However, if the company can overcome some of their financial issues and bankruptcy risk (debt-to-equity: 1.6x; quick ration of 1.1x, Altman's Z score of .3x), it may dominate the health insurance marketplace (but do not hold my word to that...). This is a purely speculative play at this point - those who are risk averse should absolutely stay away.
What truly caught my eye with this stock is that it is consolidating nicely within my historical simple moving average area. Often, but not always, this leads to a future change in momentum and propels the stock higher. It doesn't signal a bottom and there may be more room for it to plummet, but it is a bullish (overall) sign that shares are likely being accumulated by investors. Given the need for health insurance, particularly Medicare as the US / baby boom population ages, this is a company that may prosper IF it can get its financials in order.
Thus, at $6.05, NASDAQ:GOCO is in a personal buy zone (but very risky). Further declines may be ahead before a stronger move up.
Targets into 2028:
$10.00 (+64.5%)
$12.00 (+97.4%)
