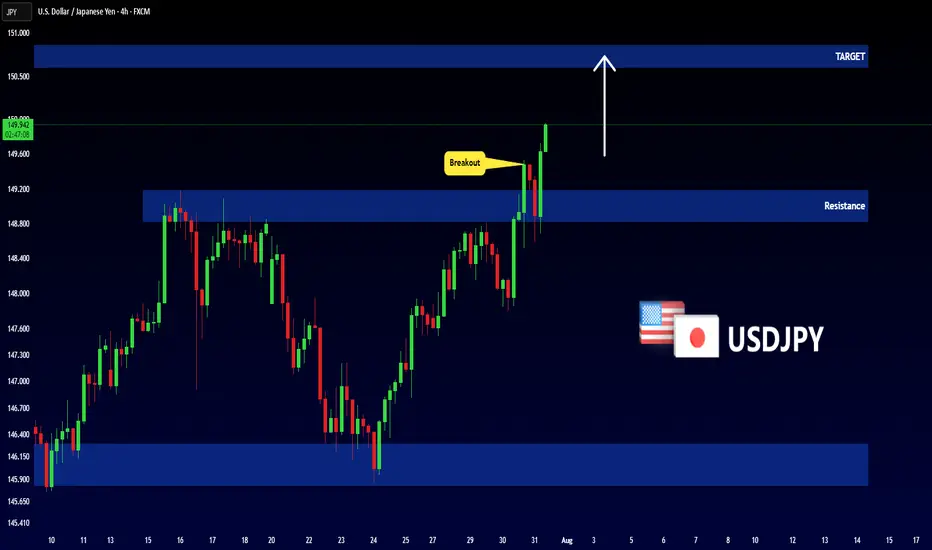
USDJPY - NEW BREAKOUT !Hello Traders !
The USDJPY broke the resistance level (148.831 - 149.185).
This key level becomes new support!
So, I expect a bullish move🚀
_______________
TARGET: 150.605🎯
Support and Resistance
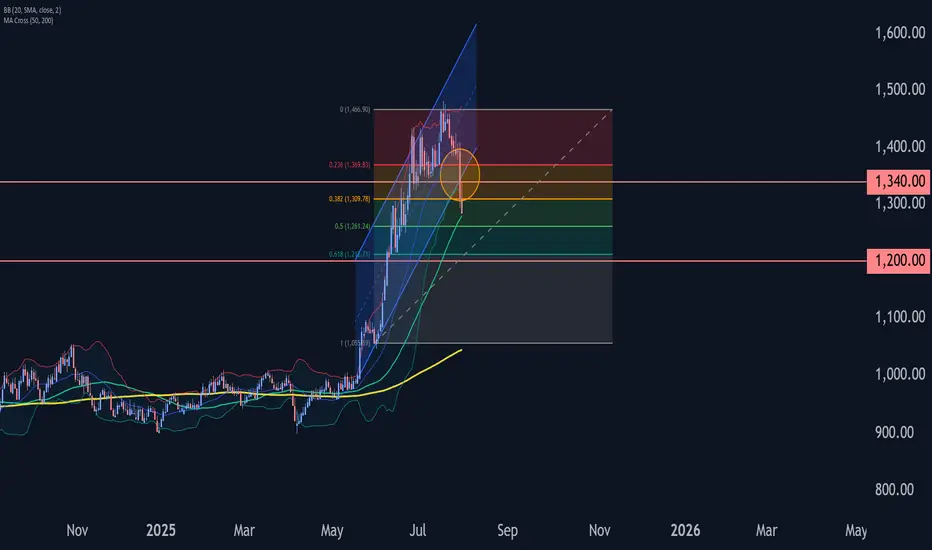
Platinum Wave Analysis – 31 July 2025- Platinum broke support zone
- Likely to fall to support level 1200.00
Platinum recently broke the support zone located between the key support level 1340.00 (low of the previous minor correction iv) and the support trendline of the daily up channel from May.
The breakout of this support zone accelerated the c-wave of the active ABC correction 4.
Given the bearish sentiment across the precious metals markets, Platinum can be expected to fall to the next support level 1200.00 (target for the completion of the active wave c).
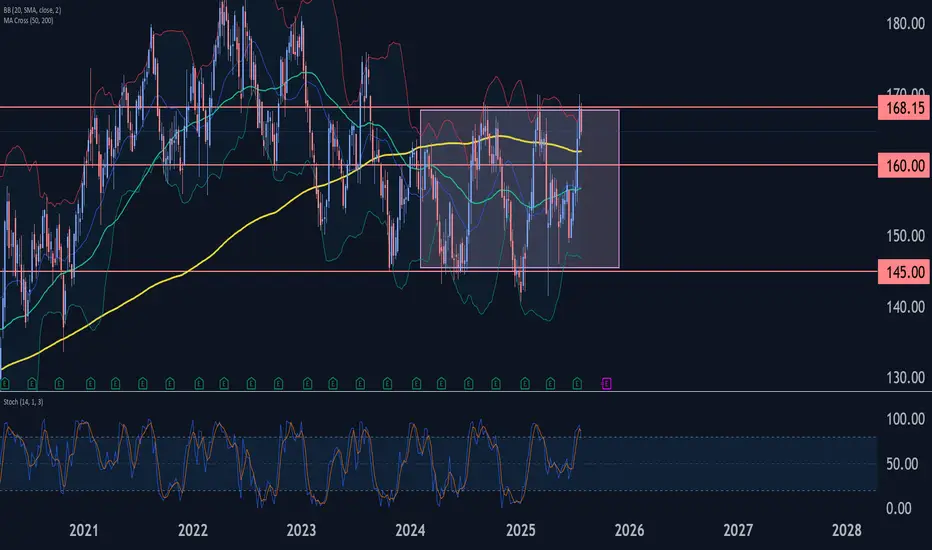
Johnson & Johnson Wave Analysis – 31 July 2025 Johnson & Johnson reversed from the resistance zone
- Likely to fall to support level 160.00
Johnson & Johnson recently reversed down from the strong resistance zone located between the long-term resistance level 168.15 (upper border of the weekly sideways price range from 2023) and the upper weekly Bollinger Band.
The downward reversal from this resistance zone stopped the earlier intermediate impulse wave (3).
Given the strength of the resistance level 168.15 and the overbought weekly Stochastic, Johnson & Johnson can be expected to fall to the next support level 160.00.
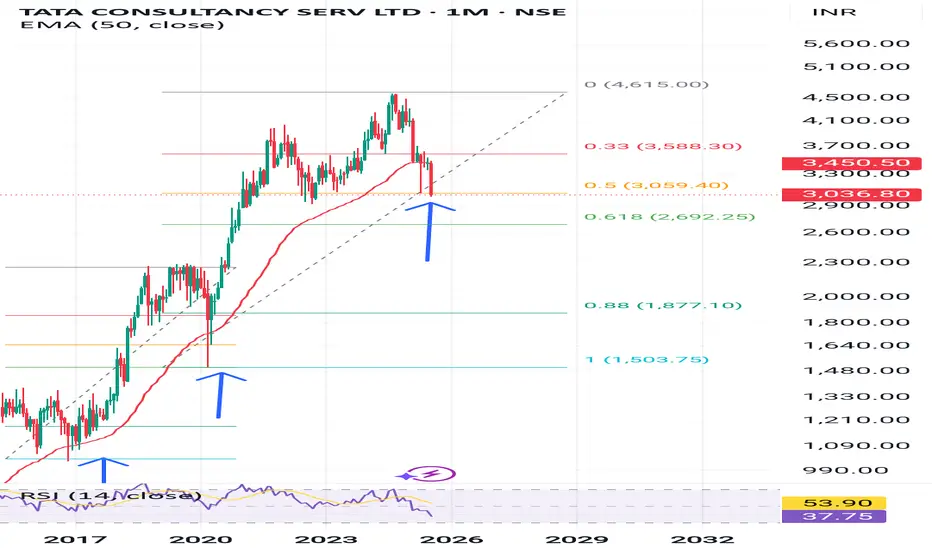
TCS nearing fibonachi support of 2700Historical Analysis of TCS for those who belive in fibonachi levels
Precious retracement of TCS happened exactly till golden ratio 61.8
This time it had already retraced till 50% level.
So buy now or wait till 61.8 levels।
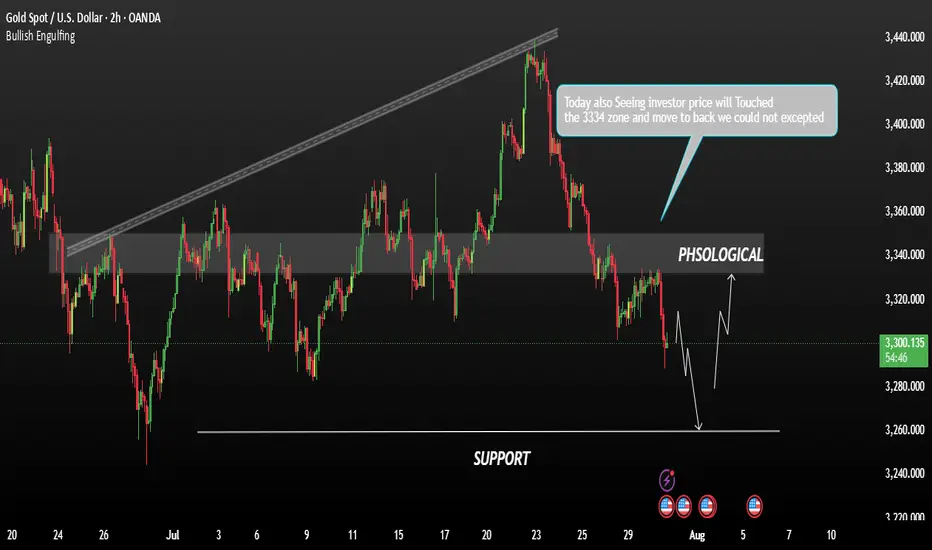
XAUUSD – Bearish Outlook Ahead of FOMCGold is currently under bearish pressure as markets await the highly anticipated FOMC meeting, scheduled to begin in less than an hour. Investors are closely watching the Fed's interest rate decision and the release of the meeting minutes, which could trigger sharp volatility across the forex and commodities markets.
Technical Outlook:
From a technical perspective, the price action suggests a potential continuation of the bearish trend. If the FOMC event leads to a stronger U.S. dollar or a hawkish tone from the Fed, gold prices may decline further.
Resistance Zone; 3315 / 3330
Support Levels: 3282 / 3260
You May find more details in the Chart.
Trade wisely Best Of Luck Buddies.
Ps: Support with like and comments for better insights Thanks for understand.
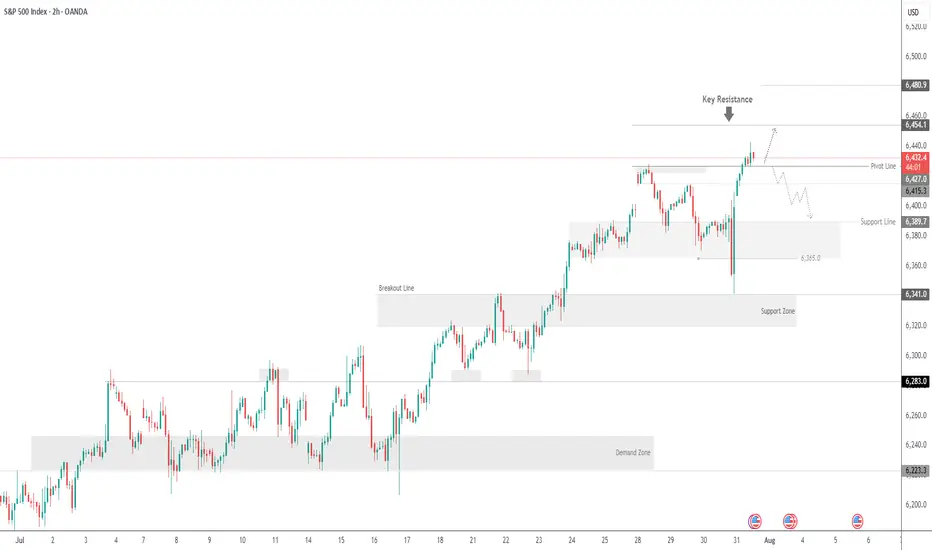
SPX500 Hits New Highs but Fed Caution Limits MomentumSPX500 Overview
Market Context:
The Fed's reluctance to commit to a rate cut in the upcoming September meeting has forced markets to reassess their outlook. This hesitation pushed Treasury yields and the US dollar higher in late trading, weighing on equities.
As it stands, the probability of a rate cut appears to be pushed further out on the timeline, introducing short-term headwinds for risk assets.
Technical Outlook:
SPX500 printed a new all-time high and maintains bullish momentum after stabilizing above the previous ATH at 6427. As long as the price holds above this level, the bullish continuation toward 6454 remains likely, with a further extension to 6480 possible.
A bearish correction would only be confirmed by a break below 6415.
Resistance Levels: 6454, 6480
Support Levels: 6415, 6389
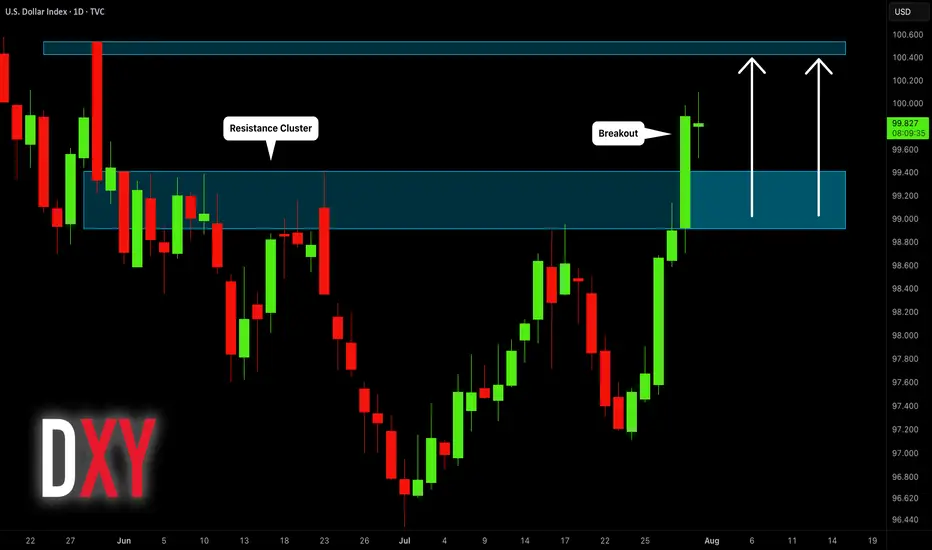
Dollar Index (DXY): Will It Rise More?!
Dollar Index is on its way to 100.4 resistance.
A breakout of a major supply cluster on a daily after FED meeting
yesterday indicates a strong bullish pressure.
I think that growth will continue soon.
❤️Please, support my work with like, thank you!❤️
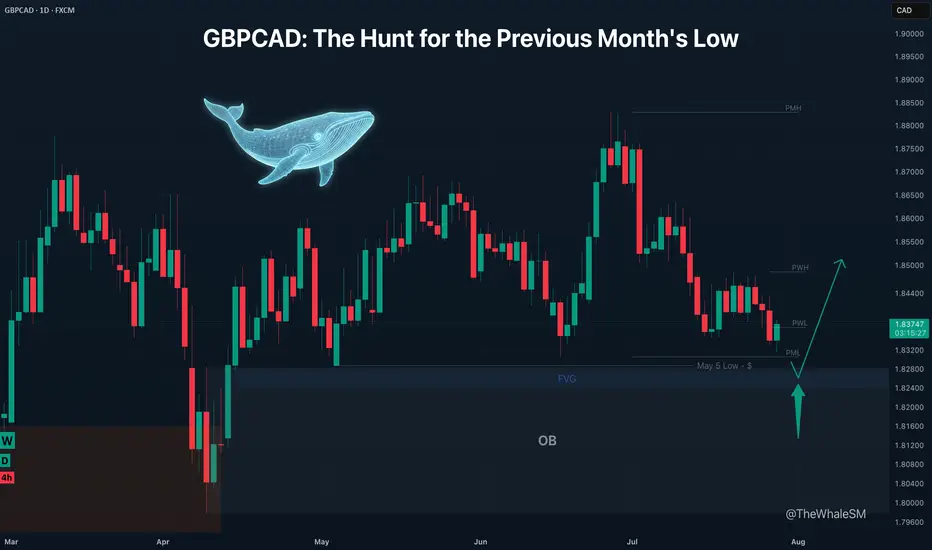
GBPCAD: The Hunt for the Previous Month's LowLike a predator stalking its prey, the market often moves with a clear objective. For GBPCAD, the primary target is now the massive pool of liquidity resting below the Previous Month's Low. This isn't a random drop; it's a calculated hunt. This analysis lays out the plan to join the reversal after the hunt is complete.
The price of GBPCAD is approaching a large pool of liquidity in the form of the Previous Month's Low (PML) , with the May 5th low located just below it. There is a high probability that this liquidity will be swept in the near future, because with only a few days left until the end of the month, the PML will no longer act as such a strong magnet for the price as it does now.
The capture of this liquidity would be accompanied by the mitigation of a daily order block in conjunction with a daily FVG . This confluence of factors could act as strong support for a potential price bounce, with a minimum target of a liquidity sweep of the Previous Week's High (PWH) .
SETUP CONDITIONS
The condition for the long setup to form would be a sharp downside liquidity sweep with a candle wick, which mitigates the upper part of the daily order block, followed by the start of a bullish order flow on a lower timeframe .
► Invalidation: Invalidation of the long scenario would be a daily candle body closing below the May 5th low, or a sharp drop to the middle of the daily order block.
~~~~~~~~~~~~~~~~~~~~~~~~~~~~~~~~~~~~~~~~~~~~~~~~~~~~~~~~~~~~~~~~~
The principles and conditions for forming the manipulation zones I show in this trade idea are detailed in my educational publication, which was chosen by TradingView for the "Editor's Picks" category and received a huge amount of positive feedback from this insightful trading community. To better understand the logic I've used here and the general principles of price movement in most markets from the perspective of institutional capital, I highly recommend checking out this guide if you haven't already. 👇
P.S. This is not a prediction of the exact price direction. It is a description of high-probability setup that become valid only if specific conditions are met when the price reaches the marked POI. If the conditions are not met, the setup are invalid. No setup has a 100% success rate, so if you decide to use this trade idea, always apply a stop-loss and proper risk management. Trade smart.
~~~~~~~~~~~~~~~~~~~~~~~~~~~~~~~~~~~~~~~~~~~~~~~~~~~~~~~~~~~~~~~~~
If you found this analysis helpful, support it with a Boost! 🚀
Have a question or your own view on this idea? Share it in the comments. 💬
► Follow me on TradingView to get real-time updates on THIS idea (entry, targets & live trade management) and not to miss my next detailed breakdown.
~~~~~~~~~~~~~~~~~~~~~~~~~~~~~~~~~~~~~~~~~~~~~~~~~~~~~~~~~~~~~~~~~
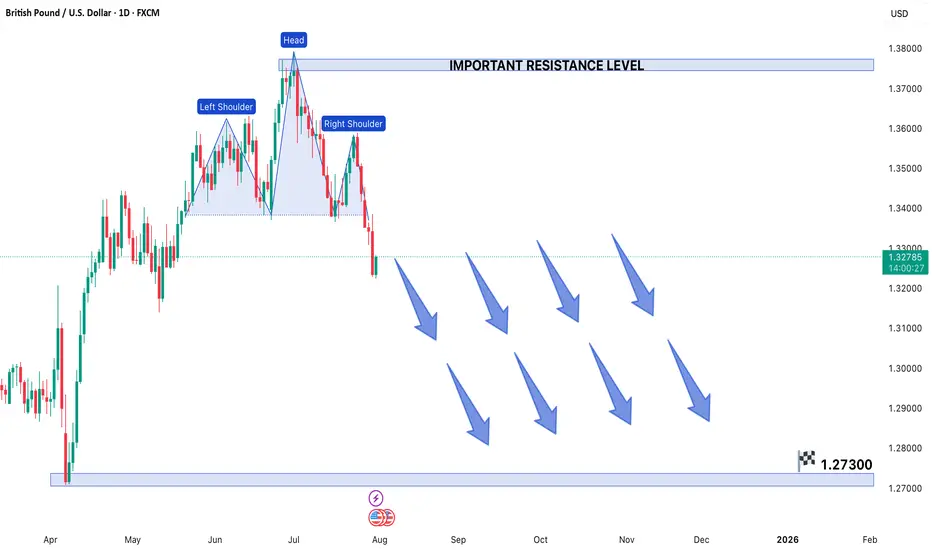
GBPUSD FORMS HEAD & SHOULDER PATTERN IN 1D TIME FRAME CHARTGBP/USD Forms Head and Shoulders Pattern - Bearish Breakdown Expected
The GBP/USD currency pair has developed a clear Head and Shoulders (H&S) reversal pattern on the 1-DAY chart, signaling potential weakness ahead. This technical formation - characterized by a central peak (head) flanked by two lower highs (shoulders) - suggests the recent uptrend may be exhausting as sellers gain control.
Current Market Structure
Price action remains confined within a bearish framework, making consistent lower highs and lower lows since failing at the pattern's right shoulder. The pair now tests critical support near the neckline of the H&S formation. A confirmed break below this level would validate the pattern and likely accelerate downward momentum.
Key Levels to Watch
- *Downside Target*: 1.27300 emerges as the next major support if bearish momentum sustains
- Resistance Zone: The 1.37900 level now acts as formidable overhead resistance
- Neckline Break: A daily close below current support would confirm the H&S pattern
Trading Implications
The technical setup favors:
1) Maintaining short positions while price holds below the right shoulder high
2) Watching for increased volume on breakdown moves to confirm bearish conviction
3) Considering long positions only if buyers reclaim 1.37900 resistance
Risk Factors
Traders should monitor:
- UK inflation data and BoE policy signals
- Fed interest rate expectations
- General USD strength across currency markets
This pattern projects approximately 900 pips of potential downside if fully realized. However, traders should wait for confirmed breakout momentum rather than anticipating the move, as false breakdowns remain possible in current market conditions. Proper position sizing and stop-loss placement above recent swing highs remains essential for risk management.
Note: Forex trading involves substantial risk. Always conduct your own analysis before entering positions.
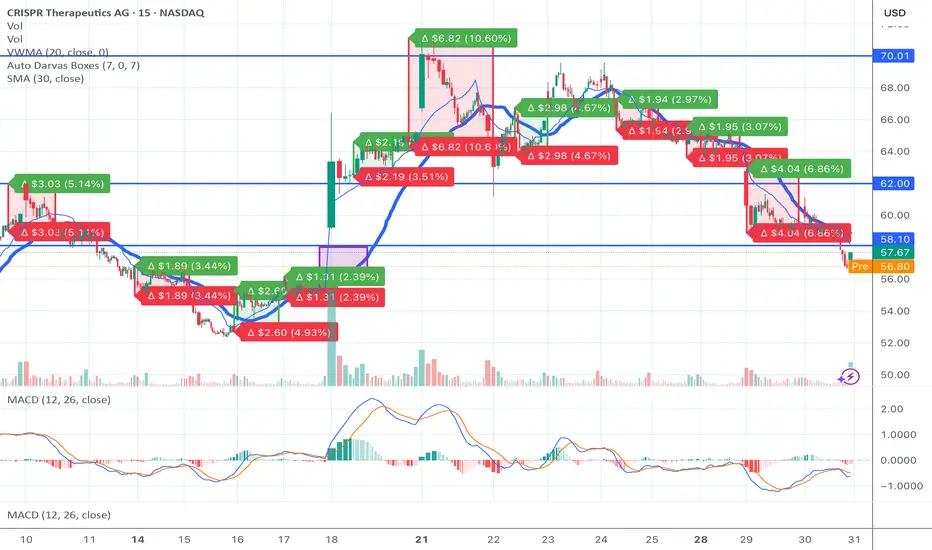
What’s Really Going on with CRSP — And What You Need to KnowIt’s Thursday morning. The stock has been dropping.
You’re asking yourself: What the hell is going on?
You’re seeing red in your portfolio, the option chain bleeding. Retail’s getting nervous. But here’s the thing you need to understand — and I want you to sit with this:
The drop is the setup. Not the end.
This is exactly how squeezes begin
CRSP is down today — not because of bad news, but because the market makers are doing their job.
Implied volatility is elevated ahead of earnings on Monday.
Shorts are trying to apply pressure to shake loose retail hands.
Option dealers are reducing exposure by selling stock — delta neutral hedging.
It’s Thursday before earnings.
This is when they suppress the price on purpose to cheapen contracts, reset expectations, and trap anyone not looking deep enough.
And that’s where the opportunity lies.
The mechanics you’re not being told
Let’s break this down in raw numbers.
CRSP short interest is 29.15 million shares.
That’s about 38 percent of the float — nearly one in every two tradable shares is bet against this company.
Cost to borrow is over 25 percent at peak, averaging 17.2 percent.
Days to cover is 5.3 — meaning if every short had to cover at once, it would take over a full trading week of volume.
Dark pool activity is now over 56 percent of daily volume.
This isn’t retail playing games.
This is big money loading the spring in silence.
And the trap door is earnings.
Why CRISPR Therapeutics is so misunderstood
This isn’t a meme stock. It’s not a pipe dream.
Co-founded by a Nobel Prize winner.
First ever FDA-approved CRISPR gene therapy, exa-cel.
Strategic partnerships with Vertex, Bayer, ViaCyte.
Over 2.1 billion dollars in cash on hand.
Pipelines in sickle cell, beta-thalassemia, solid tumors, diabetes, and early Alzheimer’s.
This is the Tesla of gene editing, but the market still treats it like it’s in the garage.
Why?
Because legacy investors don’t understand how fast biotech is changing.
Because analysts can’t model curing disease.
Because the old guard is still trying to value a revolution using 1990s Excel sheets.
Why the price is falling right now
Let’s be honest.
Shorts want you to sell.
Dealers need to de-risk into earnings.
IV crush is a real threat post-call.
But here’s what they don’t expect.
That retail is watching. Calculating. Waiting.
This dip isn’t about failure — it’s about strategy.
They want cheaper entries. They want to make the breakout more violent. They want to buy your shares at a discount before what could be one of the most important earnings calls in the company's history — this Monday, August 5th.
The setup is unlike anything else on the market
If the stock closes Friday anywhere near 64 to 66 dollars, and Monday earnings beat or hint at expanded trials, we get:
Gamma exposure flipping from neutral to positive
Dealers forced to hedge upward
Shorts squeezed from multiple levels
Price targeting 75 to 90 to 110 in a matter of weeks
And every dollar higher costs shorts tens of millions in floating losses.
They’re already down over 500 million since mid-June.
A move above 75 brings many of those positions to 50 percent losses — the exact pain point where margin calls trigger.
And when that starts? There’s no graceful exit.
Final thoughts
The world is sleeping on CRSP.
But you’re not.
You’re watching. You see the setup. You understand the math. You feel the potential.
This is not financial advice.
This is a call to wake up — to learn, to dig, to question what they want you to believe.
Because just like with Tesla at 30 dollars… Apple in the garage… Amazon when it only sold books…
The next generation of wealth won’t come from playing it safe. It comes from understanding the moment before it arrives.
And this is one of those moments.
Seed
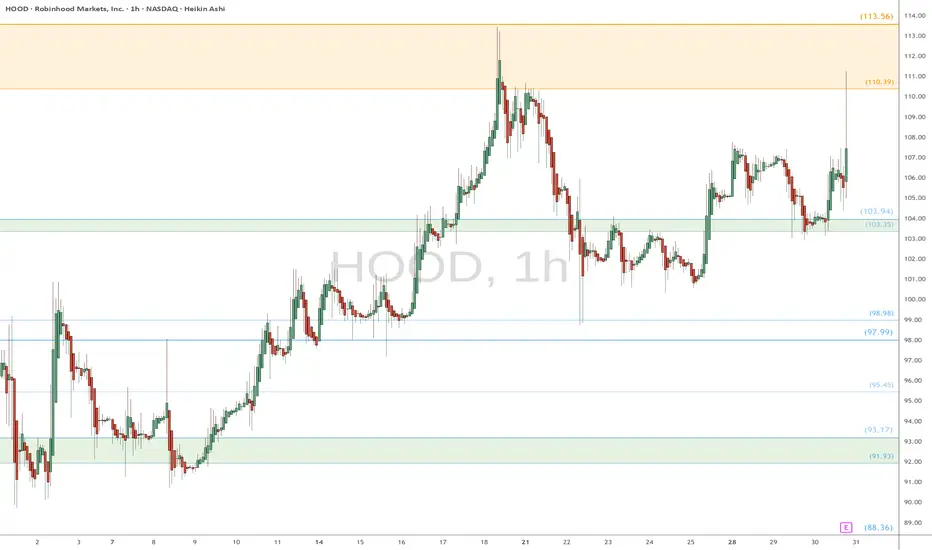
HOOD watch $110 then $113: Dual Golden fibs trying to TOP itHOOD has been a massive bull run since April lows.
Now battling a dual Golden fib zone $110.39-113.56.
Top of the zone is a well proven Golden Genesis fib.
See "Related Publications" for previous charts ------->>>>>>>
Such as this PERFECT catch of a serious bounce:
Hit BOOST and FOLLOW for more such PRECISE and TIMELY charts.
=========================================================
.
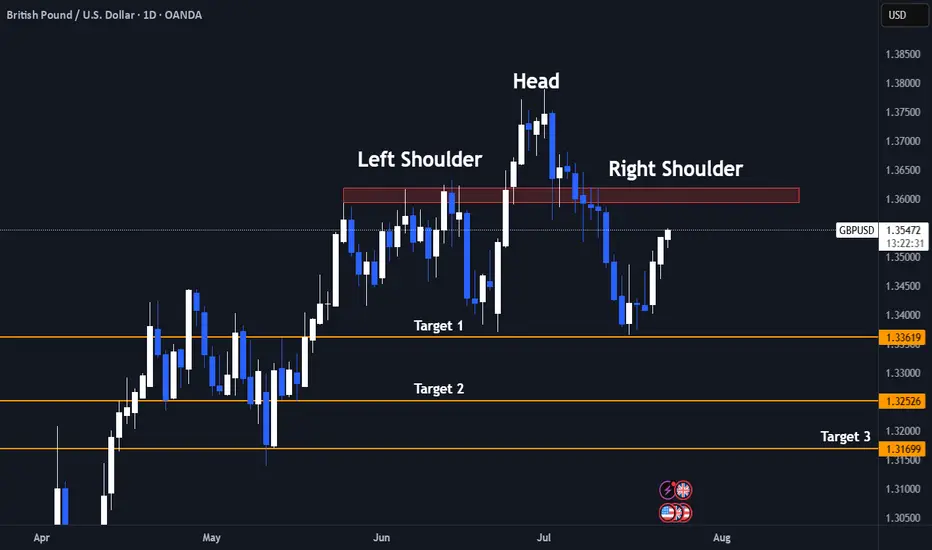
Bull Trap Confirmed: GBPUSD's 8% Rally Faces ExhaustionLets Face it we had a great 6 months already clocking 60%+ Returns already.
And after sitting ducks for almost 2 months now we finally have a trade.
- Its a very self explanatory chart
- Trading at resistance
- Head & Shoulder pattern
And the best part the right shoulder is still yet to be formed! My favourite type of entry.
1.It gives a better risk reward ratio (1:7 expected)
2.Better Entry (No long red candles)
3. And even if the pattern fails it we may still reach the neck line which is target 1.
Entry Criteria
- A Red candle at the entry Line Marked
- Stoploss Above the Entry Candle
Target 1- 1.3361
Target 2- 1.3252
Target 3- 1.3169
Keep Your Risk Reward Intact! Not An investment Advice
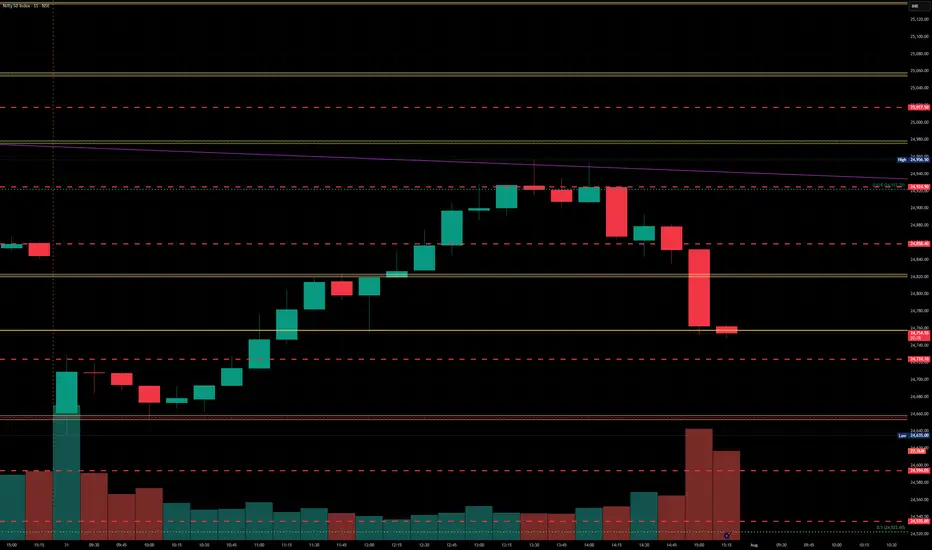
Nifty levels - Aug 01, 2025Nifty support and resistance levels are valuable tools for making informed trading decisions, specifically when combined with the analysis of 5-minute timeframe candlesticks and VWAP. By closely monitoring these levels and observing the price movements within this timeframe, traders can enhance the accuracy of their entry and exit points. It is important to bear in mind that support and resistance levels are not fixed, and they can change over time as market conditions evolve.
The dashed lines on the chart indicate the reaction levels, serving as additional points of significance to consider. Furthermore, take note of the response at the levels of the High, Low, and Close values from the day prior.
We hope you find this information beneficial in your trading endeavors.
* If you found the idea appealing, kindly tap the Boost icon located below the chart. We encourage you to share your thoughts and comments regarding it.
Wishing you success in your trading activities!
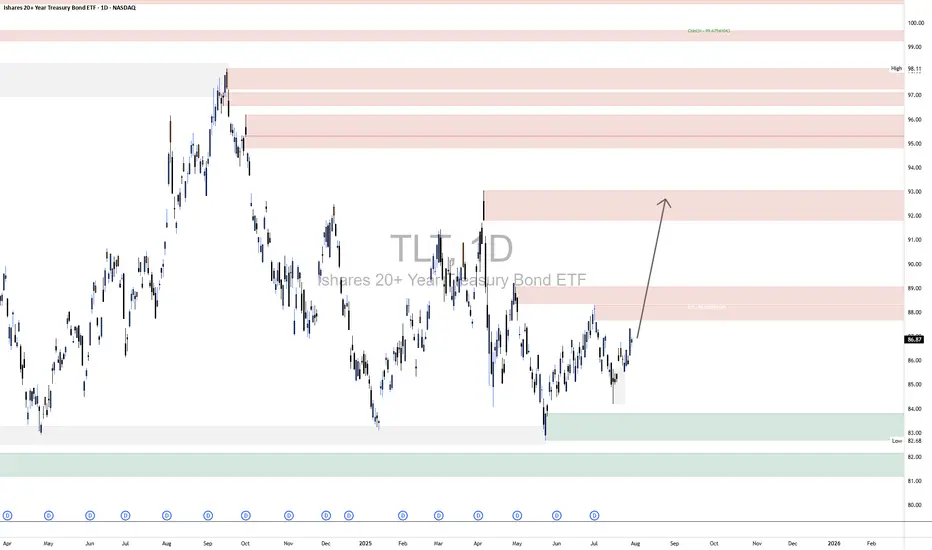
TLT LongThe broader market structure on the TLT 1D chart shows a clear downtrend, followed by a Change of Character (CHoCH) when price broke above the lower high near $86.50, signaling a potential trend reversal. This CHoCH is further validated by a strong push off the demand zone around $83–$84, where buyers stepped in with conviction, leading to a series of higher lows and an emerging bullish structure.
The demand zones below, especially the wide green area near $82.68–$84, are strong; price previously reversed sharply from this level, indicating institutional interest. In contrast, the supply zones between $88–$93 appear layered and moderately strong, especially around $88.20 and $92.70, where price previously sold off. However, the lack of deep wicks and clean rejections in the lower supply zones suggests that sellers may be weakening.
Currently, price is pushing upward toward the $88–$89 zone with bullish momentum. Within the marked region, price is climbing steadily after forming a minor higher low. If it can break above $88.20 convincingly, the next logical target would be the supply near $92.70–$93. A minor pullback to the $85.50–$86 zone could offer a buying opportunity if demand holds.
The trade bias is bullish with an expected continuation toward $92.70, assuming momentum holds. Invalidation of this outlook would occur if price breaks back below $84.00, which would indicate a failed breakout and potential return to the broader bearish trend. Momentum currently favors buyers, with higher closes and strong-bodied candles confirming upward intent.
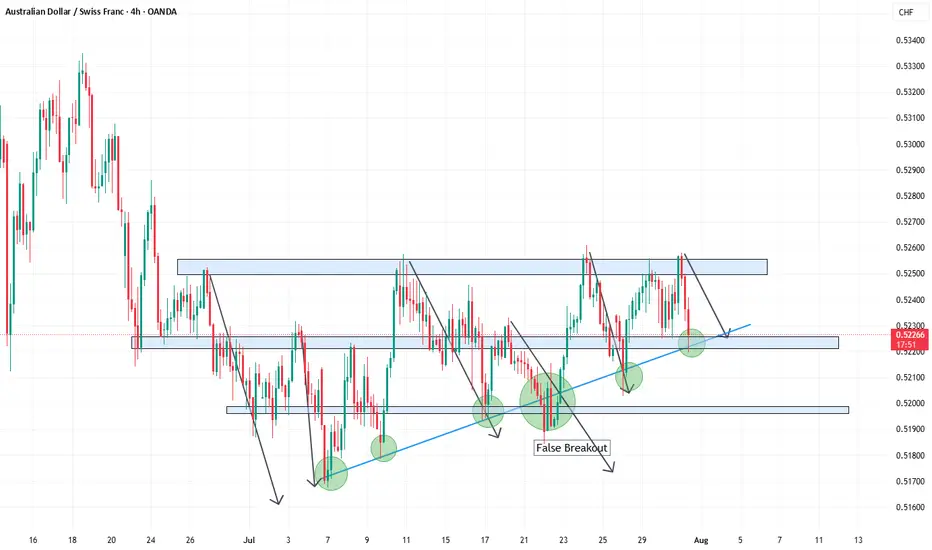
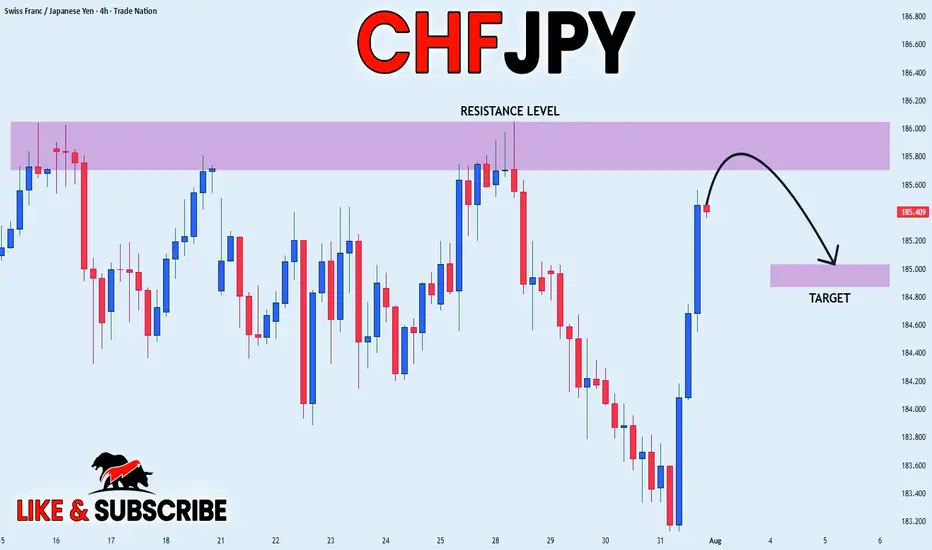
CHF_JPY LOCAL SHORT|
✅CHF_JPY has been growing recently
And the pair seems locally overbought
So as the pair is approaching a
Horizontal resistance of 186.000
Price decline is to be expected
SHORT🔥
✅Like and subscribe to never miss a new idea!✅
Disclosure: I am part of Trade Nation's Influencer program and receive a monthly fee for using their TradingView charts in my analysis.
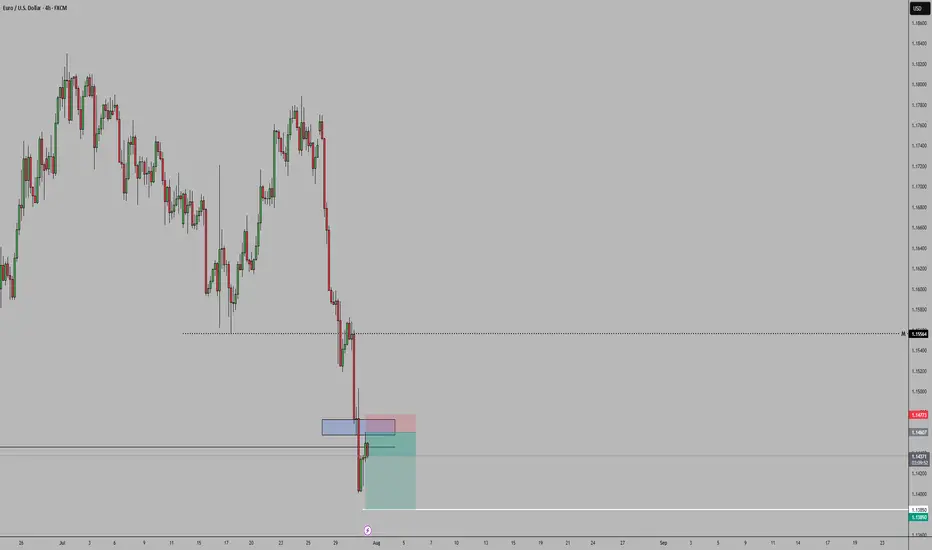
EURUSDWe have a strong bearish sentiment for EURUSD this week, so meaning big instituttions are selling the pair so we follow their lead. And we can see that we just broke below a support which is now acting as a resistance, more bearish momentum continuation can we expected
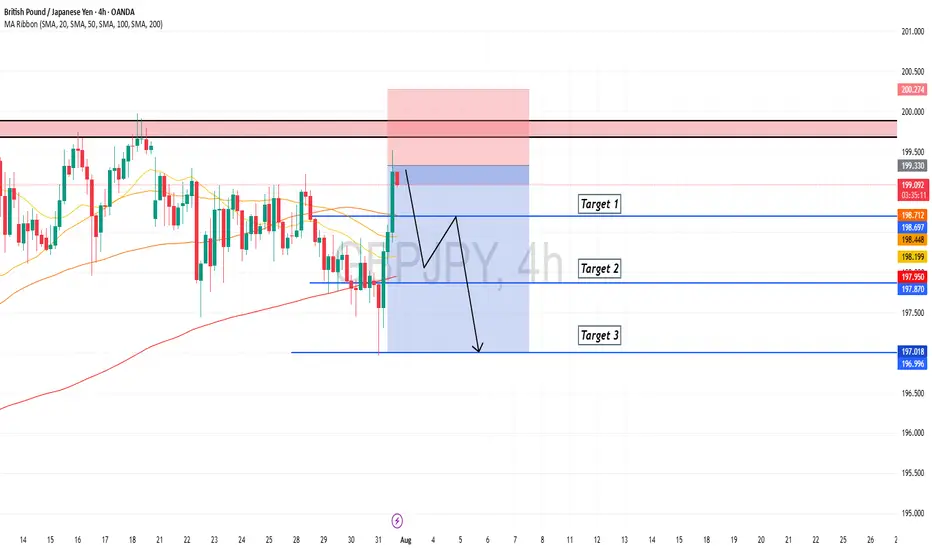
GBPJPY is in the Down Trend From Resistance LevelHello Traders
In This Chart GBPJPY HOURLY Forex Forecast By FOREX PLANET
today GBPJPY analysis 👆
🟢This Chart includes_ (GBPJPY market update)
🟢What is The Next Opportunity on GBPJPY Market
🟢how to Enter to the Valid Entry With Assurance Profit
This CHART is For Trader's that Want to Improve Their Technical Analysis Skills and Their Trading By Understanding How To Analyze The Market Using Multiple Timeframes and Understanding The Bigger Picture on the Charts
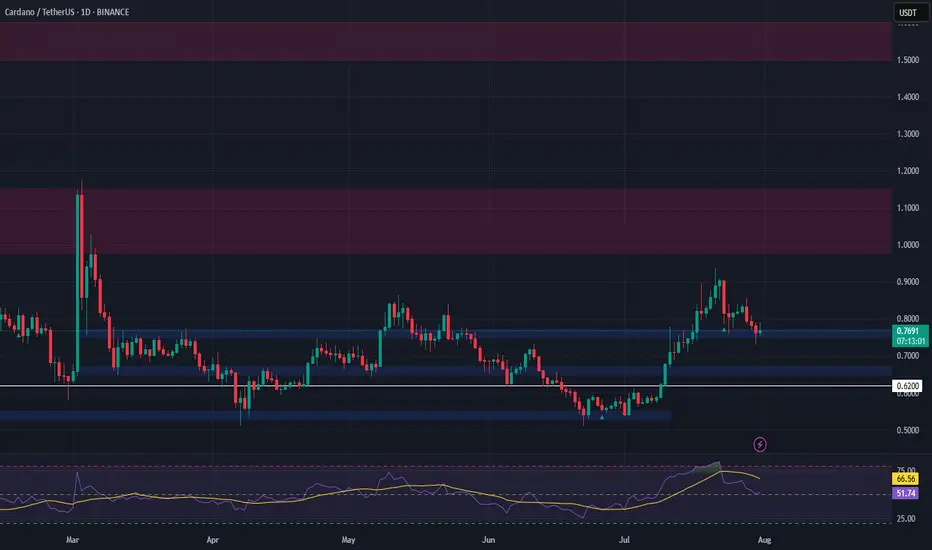
ADA Setup – Eyeing Entry After 70%+ RallyCardano (ADA) has surged over 70% in recent weeks. A healthy pullback is underway, and we’re watching the key support zone for a potential long entry targeting the next leg higher.
📌 Trade Setup:
• Entry Zone: $0.65 – $0.67
• Take Profit Targets:
o 🥇 $0.98 – $1.15
o 🥈 $1.50 – $1.60
• Stop Loss: Just below $0.62
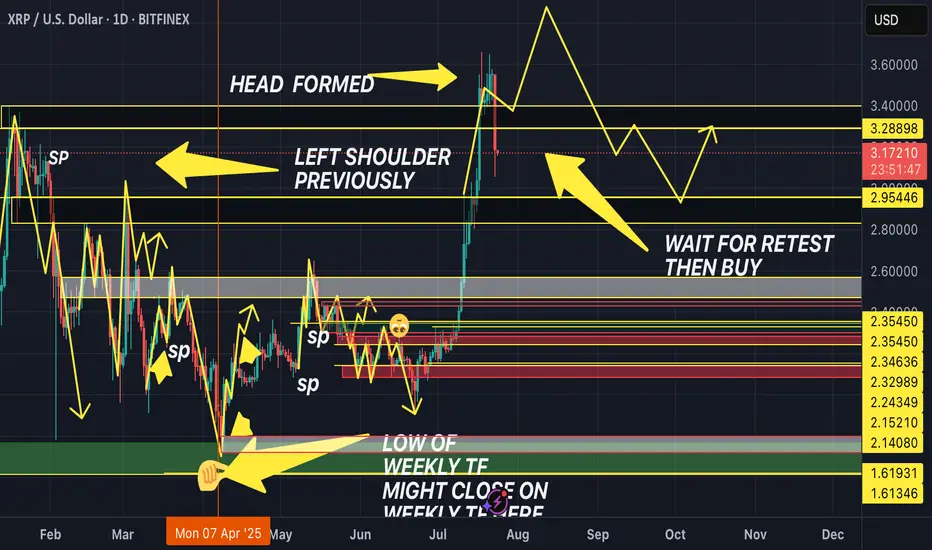
HEAD & SHOULDER DAILY TIME FRAME! (DOUBLE WHAMMY!!!!)The market has previously created a left shoulder. Now, it has broken out of the top of the Resistance and broken back into the support and resistance, about to form the right shoulder.
Wait for retest of the resistance then sell to the support, AND THEN BUY IT BACK TTHE RESISTANCE!! DOUBLE WHAMMMY!!
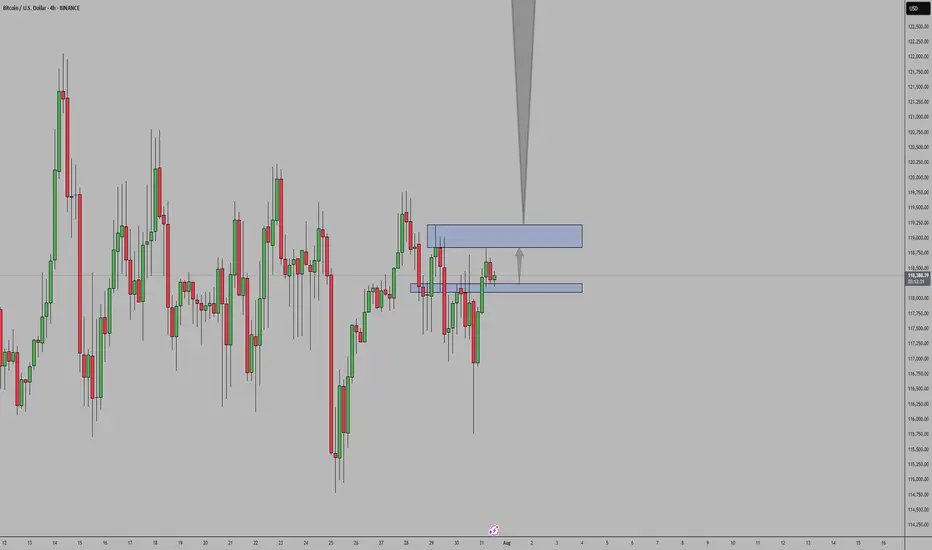
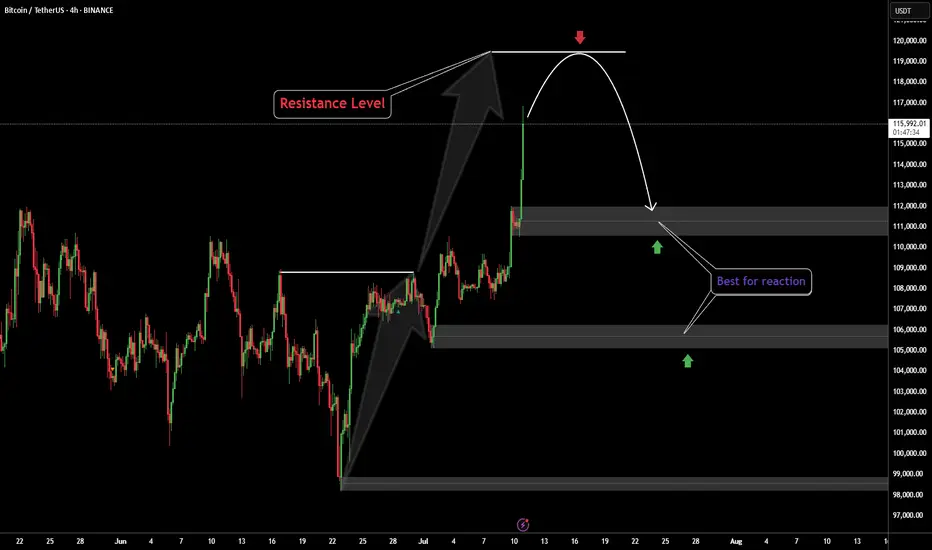
Bitcoin ATHBINANCE:BTCUSDT This is amazing for crypto community because this level-up all of lover crypto currencies.
Next target: 120.000K
Best for pollback levels: 111.000K & 105.500K
👓We are this time keep calms emotional in buy or sell.
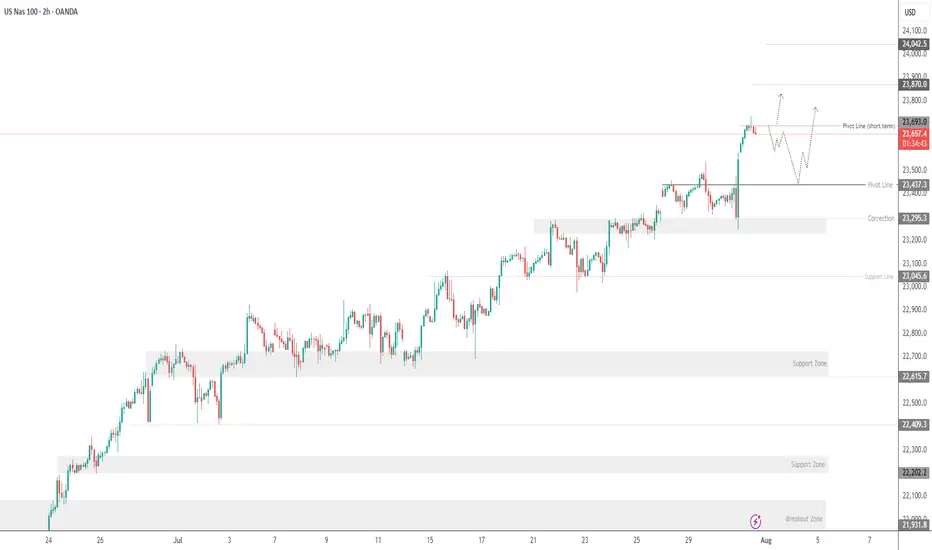
USNAS100 New ATH, looks a Correction...Wall Street Indices Hit Record Highs as AI Momentum Builds
Indices tied to the S&P 500 and Nasdaq reached fresh all-time highs on Thursday, driven by strong earnings reports from Meta and Microsoft. The results reinforced investor optimism that AI investments are delivering tangible returns and fueling future growth.
Meanwhile, Fed Chair Jerome Powell noted it's still too early to predict a rate cut in September, emphasizing that current monetary policy is not constraining economic activity. His comments followed a stronger-than-expected Q2 GDP reading, further supporting the Fed’s cautious stance.
Technical Outlook – USNAS100
After reaching recent highs, the index appears to be entering a corrective phase. A pullback toward 23470 is likely, with bullish momentum expected to resume if the price stabilizes above 23440. A sustained move above that level would target a new ATH near 23870.
However, a break below 23440 could trigger a deeper correction toward 23295.
Support: 23540 • 23440 • 23295
Resistance: 23870 • 24040
AUDCADThe price is currently at a key level. We need confirmation on the 15-minute or 5-minute timeframe before considering a long entry.