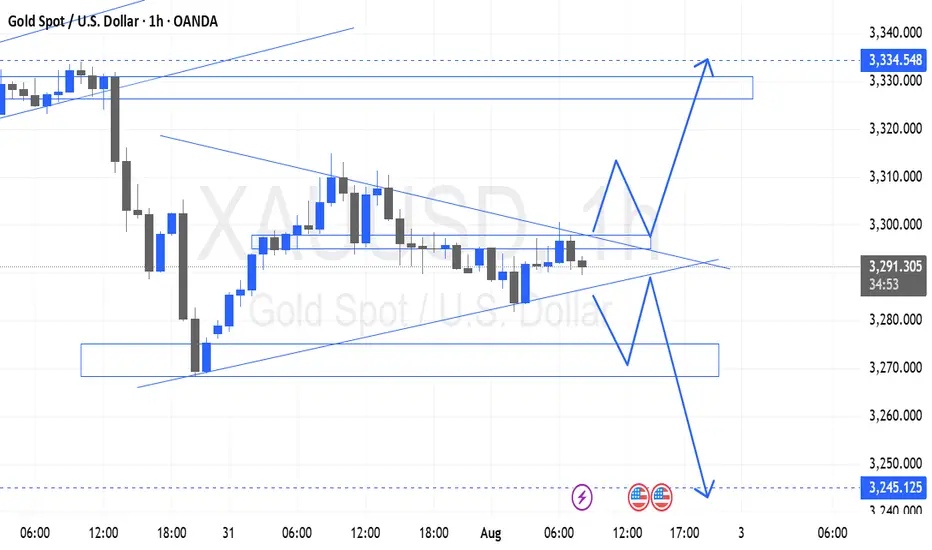
XAUUSD 1HR ANALYSIS🔔 XAUUSD 1H Analysis | August 1, 2025
Gold is currently consolidating inside a symmetrical triangle on the 1-hour timeframe. Price action has tightened, indicating a potential breakout scenario is near. Two key paths are highlighted:
🔹 Bullish Scenario:
A breakout above the triangle resistance may lead to a clean push towards $3,310, and if momentum sustains, $3,334 becomes the extended upside target (liquidity zone and prior supply area).
🔹 Bearish Scenario:
A breakdown below triangle support could send price toward $3,270 first. If this level fails to hold, further downside toward $3,245 is expected — a major support and demand zone.
📍 Current Price: $3,291.98
⏳ Wait for breakout confirmation with volume and momentum before committing to direction.
Support and Resistance
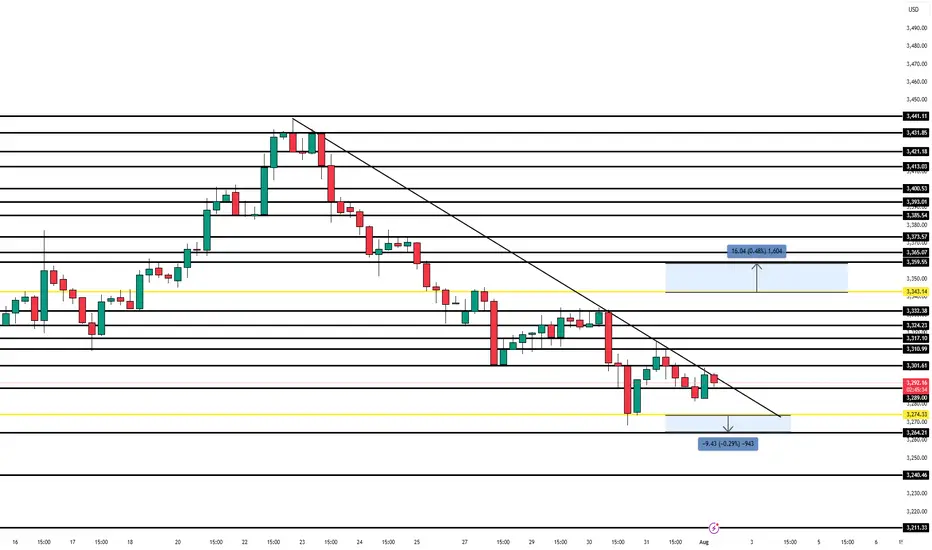
Gold Outlook – Friday August 1st | Navigating NFP VolatilityGold has been in a clear downtrend all week, confirmed on the 4H chart and pushed further by the Fed rate decision earlier this week.
With NFP ahead today, I’m staying sharp and focused only on confirmed setups:
🔻 Sell Setup: Below 3274.33
First TP: 3268 (+50 pips)
Final TP: 3264 (+97 pips)
🟢 Buy Setup: Above 3343
Target: 3359 (+160 pips)
🎯 This is not the day to guess — it’s about being fast, clean, and rule-based.
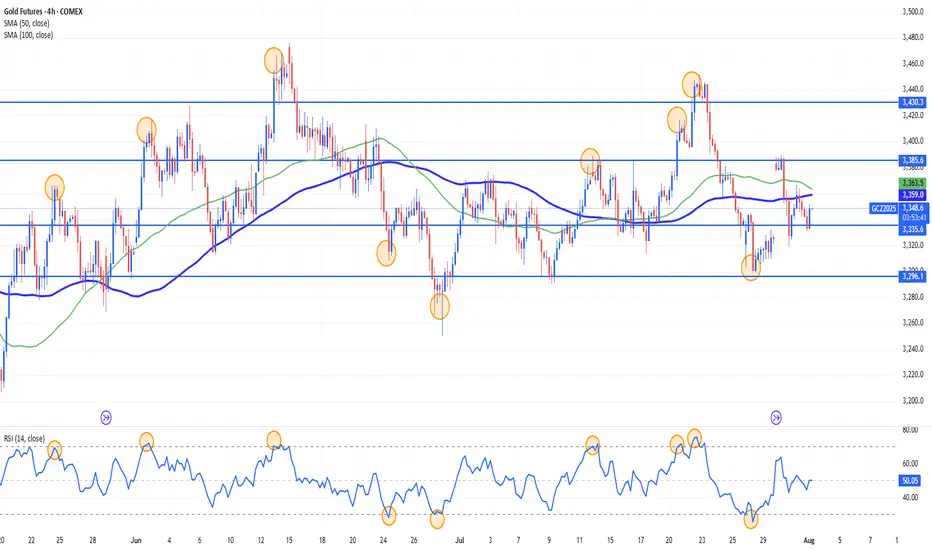
Gold Range-Bound and Ripe for Mean Reversion Plays?Gold has been locked in a sideways, range-bound regime for months, largely oscillating between the 3400 and 3160 levels. This lack of clear directional trend stems from conflicting fundamental forces: on one hand, sticky inflation and resilient U.S. data have bolstered the U.S. dollar and yields, weighing on gold. On the other, global growth concerns and geopolitical tensions continue to underpin demand for the metal as a safe haven. The push and pull of these opposing themes has created an environment of indecision and choppy price action.
While long-term investors may find this frustrating, range traders and mean reversion strategies are thriving. With technical boundaries so well-defined, short-term oscillations within the range are offering repeated opportunities for disciplined entry and exit.
Currently, XAUUSD is trading just under the 3296 level after a recent rejection from the 3350s. The bearish structure suggests a potential leg down toward the 3160–3180 support zone. However, absent any major economic surprises or geopolitical shocks, this could merely be another deviation from the mean rather than a true breakdown. Indicators like RSI and Stochastic Oscillator are already hinting at early signs of bullish divergence.
If price holds above or near 3160, the setup for another mean-reversion trade back toward the mid-range (around 3296 or higher) could unfold. In the current environment, fading extremes rather than chasing trends remains a strategy of edge, as depicted by the 14 period RSI.
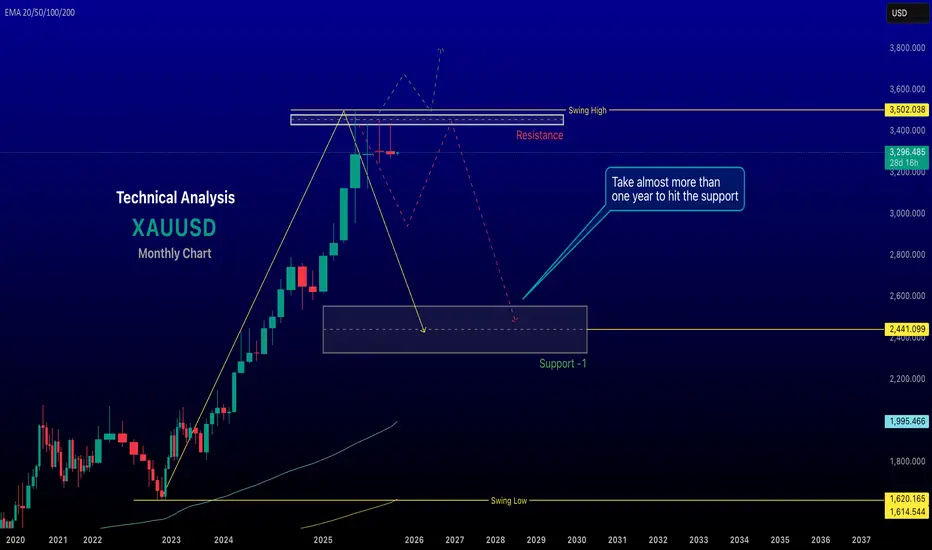
renderwithme ||| XAU/USD Monthly Analysis (August 2025 Outlook) #Fundamental Analysis
Gold prices are influenced by macroeconomic factors, monetary policy, and geopolitical events. Based on recent data:Federal Reserve Policy: The Fed’s decision to maintain interest rates at 4.25–4.50% in July 2025, with a hawkish tilt, has strengthened the US dollar, putting downward pressure on gold. A stronger USD typically reduces gold’s appeal as it’s priced in dollars. However, expectations of a potential rate cut in September could support gold if signaled by Fed Chair Jerome Powell. Watch for updates in the FOMC statement or Powell’s comments for clues on future policy.
#Economic Indicators:
Strong US economic data, such as a robust labor market (jobless claims at a 3-month low) and rising consumer confidence (Conference Board’s Index at 97.2 in July), suggest increased economic activity, which could bolster the USD and limit gold’s upside. Upcoming data like the US PCE Price Index and Nonfarm Payrolls (NFP) in early August will be critical for gauging inflation and labor market trends, impacting gold’s trajectory.
Geopolitical and Safe-Haven Demand: Reduced safe-haven demand due to de-escalating global trade tensions and geopolitical stability has capped gold’s gains. However, any escalation in conflicts (e.g., Russia-Ukraine or Middle East) or renewed trade disputes could drive demand for gold as a safe-haven asset.
Central Bank Demand: Continued central bank gold purchases could provide long-term support, but a slowdown in buying might weigh on prices.
# Inflation and Currency Dynamics:
Persistent US inflation supports the USD, limiting gold’s attractiveness. Conversely, a recovering Chinese economy or global policy easing could boost gold demand.
#Technical Analysis
Recent technical data suggests a mixed outlook for XAU/USD on the monthly timeframe:Price Levels and Trends: As of late July 2025, XAU/USD is trading around $3,291–$3,337, consolidating after retreating from a high of $3,440. The monthly chart shows a medium-term uptrend channel that began in early 2025, with support around $3,285–$3,300 and resistance at $3,355–$3,430. A decisive break above $3,355 could signal bullish momentum toward $3,500 or higher, while a break below $3,285 might target $3,130 or lower.
Indicators: The 14-day RSI at 46.10 suggests neutral momentum, neither overbought nor oversold. Technical indicators show mixed signals, with 15 bearish and 11 bullish signals as of July 28, 2025, reinforcing a cautious outlook.
Key Levels: Support: $3,275–$3,225 (major demand zone), $3,130 (potential deeper pullback).
Resistance: $3,355, $3,430, $3,500 (psychological level).
A bearish descending channel on shorter timeframes (e.g., 1H, 3H) suggests potential downside unless $3,320 is breached.
Monthly ForecastBearish Scenario: If the USD remains strong due to hawkish Fed signals, persistent inflation, or robust US economic data, XAU/USD could test support at $3,275–$3,225. A break below this zone might lead to $3,130 or even $2,900 in a deeper correction, especially if safe-haven demand weakens further.
Bullish Scenario: A Fed signal of rate cuts, renewed geopolitical tensions, or increased central bank buying could push gold above $3,355, targeting $3,430 or $3,500. A breakout above $3,430 could aim for $3,830, as suggested by some analysts.
Expected Range: For August 2025, XAU/USD is likely to trade between $3,225 and $3,430, with volatility driven by US economic data and Fed policy updates. A monthly close above $3,430 would strengthen the bullish case, while a close below $3,225 would favor bears.
Trading ConsiderationsRisk Management: Given the mixed signals, use tight stop-losses. For bullish trades, consider entries near $3,275–$3,300 with stops below $3,225. For bearish trades, enter near $3,320 with stops above $3,355.
Key Events to Watch: Monitor the US PCE Price Index, NFP report, and Fed statements in early August for directional cues. Geopolitical developments could also trigger sudden moves.
Volatility: The 30-day volatility is low at 0.91%, suggesting consolidation, but upcoming data releases could spark sharper moves.
# Chart for the reference will give u better idea to take decisions
in my views top has been made
~~ Disclaimer ~~
This analysis is based on recent technical data and market sentiment from web sources. It is for informational \ educational purposes only and not financial advice. Trading involves high risks, and past performance does not guarantee future results. Always conduct your own research or consult a SEBI-registered advisor before trading.
# Boost and comment will be highly appreciated.

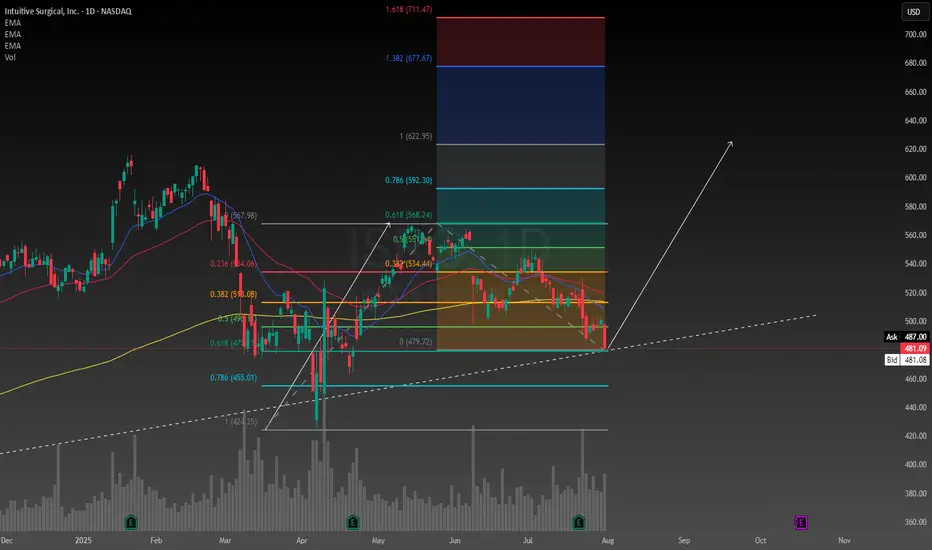
Technically Intuitive Surgical looks like it has found supportBecause I don't know much about the healthcare industry I have been avoiding it thus far. However I have done some research on Intuitive Surgical and was surprised to learn about what they do. The company is a mix between technology and healthcare, there's nobody to compete with them either which was something I found to be valuable at this time.
I have conducted a technical analysis using a trendline and a Fibonacci measurement. The risk is high, fundamentally the stock is very overvalued, but I believe this may be because of the potential the company has to grow. Every hospital is saying the same thing, they are understaffed. I feel like this company might have a positive influence to healthcare and hospitals in the future.
I have calculated the intrinsic value using the discounted cash flow model. Assuming a discount rate of 6.4%, with a 5 year exit the intrinsic value is $365. After running the numbers with a discount rate between 5.8% and 7.0% the range of the intrinsic value is between $235 and $1070 so there is clearly a potential for a significant upside. But I am taking a cautious approach because like I mentioned it is still looking over valued. I want to take the risk of owning this stock but I will monitor the company closely to make sure the fundamentals do not change as to why I decided to buy it in the first place.
I think the technical analysis I have drawn on the chart speaks for itself no need to explain much I think most people know technical analysis. I want to buy it tomorrow but I might wait a week or so to see how the tariff drama plays out and whether I can get a better deal or not I will probably enter with a stop order because I want to enter when the price is going up maybe above the next green bar on the daily we shall see I am being very cautious this time. I will start by allocating 5% of my portfolio to ISRG but that's always subject to change in the future.
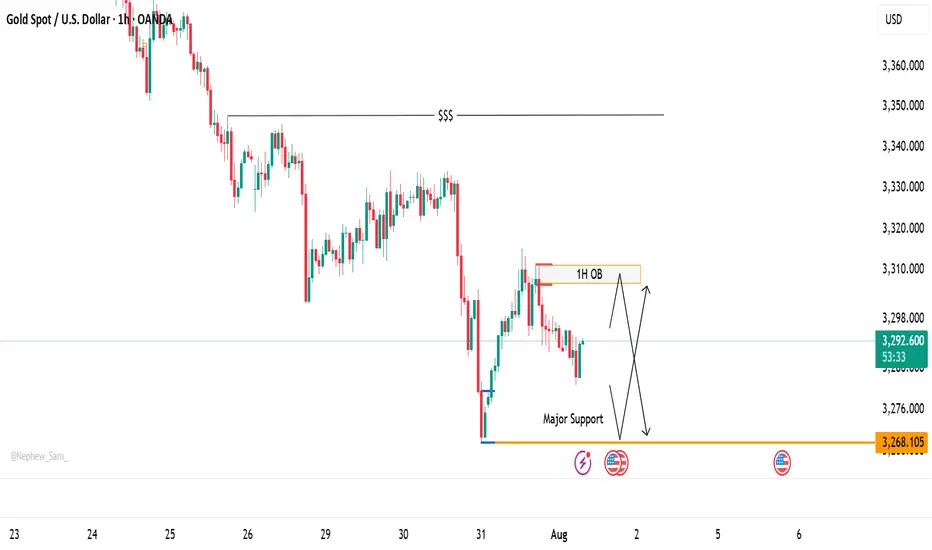
XAUUSD Price at Decision Point – Bounce or Breakdown?Gold (XAUUSD) is currently trading between two significant zones — a ⏫ 1H Order Block above and a 🛑 Major Support level at 3268.
At this stage, price action remains undecided, and we have a few key scenarios to monitor:
🔄 Potential Scenarios:
📌 Price taps into the 1H OB, then shows signs of rejection — this could trigger a move back down toward support.
⬇️ Price drops directly to 3268, where buyers may step in for a potential bounce.
🚀 If the price breaks through the OB, it may continue pushing up toward the liquidity area around 3248.
⚠️ If support fails, we could see a deeper bearish continuation.
These zones are crucial for both intraday and swing setups. Be patient and wait for a clean reaction to catch a high-probability move.
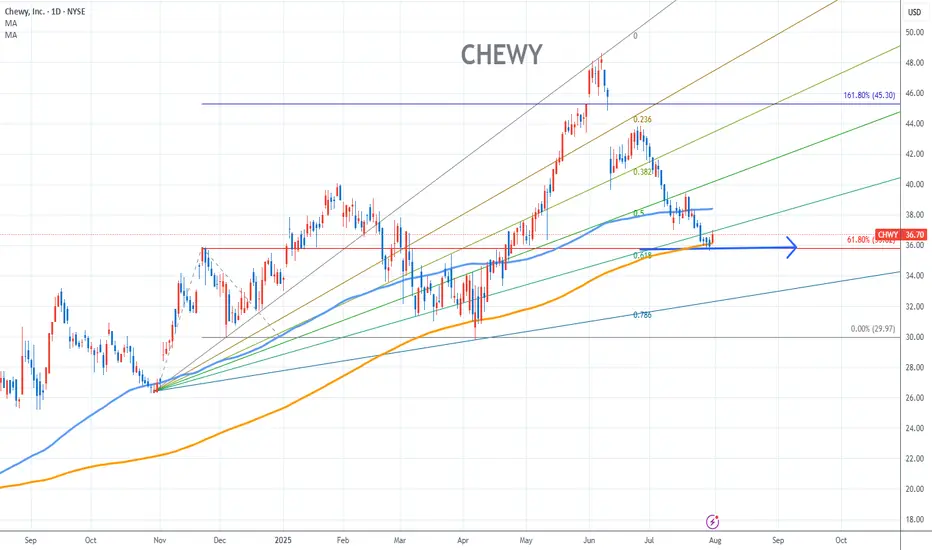
Chewy Stock Chart Fibonacci Analysis 073125Trading Idea
1) Find a FIBO slingshot
2) Check FIBO 61.80% level
3) Entry Point > 36/61.80%
Chart time frame:D
A) 15 min(1W-3M)
B) 1 hr(3M-6M)
C) 4 hr(6M-1year)
D) 1 day(1-3years)
Stock progress:C
A) Keep rising over 61.80% resistance
B) 61.80% resistance
C) 61.80% support
D) Hit the bottom
E) Hit the top
Stocks rise as they rise from support and fall from resistance. Our goal is to find a low support point and enter. It can be referred to as buying at the pullback point. The pullback point can be found with a Fibonacci extension of 61.80%. This is a step to find entry level. 1) Find a triangle (Fibonacci Speed Fan Line) that connects the high (resistance) and low (support) points of the stock in progress, where it is continuously expressed as a Slingshot, 2) and create a Fibonacci extension level for the first rising wave from the start point of slingshot pattern.
When the current price goes over 61.80% level , that can be a good entry point, especially if the SMA 100 and 200 curves are gathered together at 61.80%, it is a very good entry point.
As a great help, tradingview provides these Fibonacci speed fan lines and extension levels with ease. So if you use the Fibonacci fan line, the extension level, and the SMA 100/200 curve well, you can find an entry point for the stock market. At least you have to enter at this low point to avoid trading failure, and if you are skilled at entering this low point, with fibonacci6180 technique, your reading skill to chart will be greatly improved.
If you want to do day trading, please set the time frame to 5 minutes or 15 minutes, and you will see many of the low point of rising stocks.
If want to prefer long term range trading, you can set the time frame to 1 hr or 1 day.
Oil prices rebound, maintain bullish attitude
💡Message Strategy
International oil prices continued their upward trend on Thursday, closing higher for the fourth consecutive day, as concerns about growing global supply tightness abounded. Brent crude for September delivery rose 0.4% to $73.51 a barrel, while West Texas Intermediate (WTI) crude for September delivery rose 0.5% to $70.37 a barrel, while the more active Brent October contract rose 0.4% to $72.76 a barrel.
Recently, the market has focused on the statement of US President Trump, who demanded that Russia make "substantial progress" on the situation in Ukraine within 10-12 days, otherwise he would impose 100% secondary tariffs on its trading partners, significantly bringing forward the previous 50-day deadline.
Inventory data suggests a continued struggle between supply and demand. Data from the U.S. Energy Information Administration (EIA) showed that U.S. crude oil inventories unexpectedly rose by 7.7 million barrels to 426.7 million barrels in the week ending July 25, far exceeding expectations for a 1.3 million barrel drop. However, gasoline inventories fell by 2.7 million barrels to 228.4 million barrels, exceeding market expectations for a 600,000 barrel drop.
📊Technical aspects
From a daily perspective, WTI crude oil prices have closed higher for four consecutive days since rebounding from the $66 level. It is currently running stably above the integer mark of $70 per barrel. The short-term moving average system is in a bullish arrangement, and the MACD indicator remains above the zero axis, indicating that the bullish momentum is still strong.
From an hourly perspective, if the price breaks through the previous high of $70.50, it is expected to further rise to the $73.50-$75 range. Conversely, if it continues to fall below the $70 mark, it may trigger short-term profit-taking, and further support will focus on the $68.50 level. Overall, the short-term trend remains bullish.
💰Strategy Package
Long Position:68.00-68.50,SL:67.50,Target:70.50-73.00

Review a Few of our Trades & Update Overall Market PerspectiveIn this video, I review some of the trades taken over the past 1-2 weeks, and discuss in more detail the current technical and geopolitical/macro thesis on AMEX:SPY NASDAQ:QQQ NASDAQ:SQQQ AMEX:SOXS , and the overall market. Exciting times, and ripe with opportunity to *potentially* BTD (again).

USDJPY Wave Analysis – 31 July 2025- USDJPY broke resistance zone
- Likely rise to resistance level 152.00
USDJPY currency pair recently broke the resistance zone located between the resistance level 148.85 (which stopped earlier waves A and i) and the 50% Fibonacci correction of the downward impulse from January.
The breakout of this resistance zone accelerated the active impulse wave c, which belongs to medium-term ABC correction (2) from April.
USDJPY currency pair can be expected to rise further to the next resistance level 152.00 (target price for the completion of the active impulse wave C).

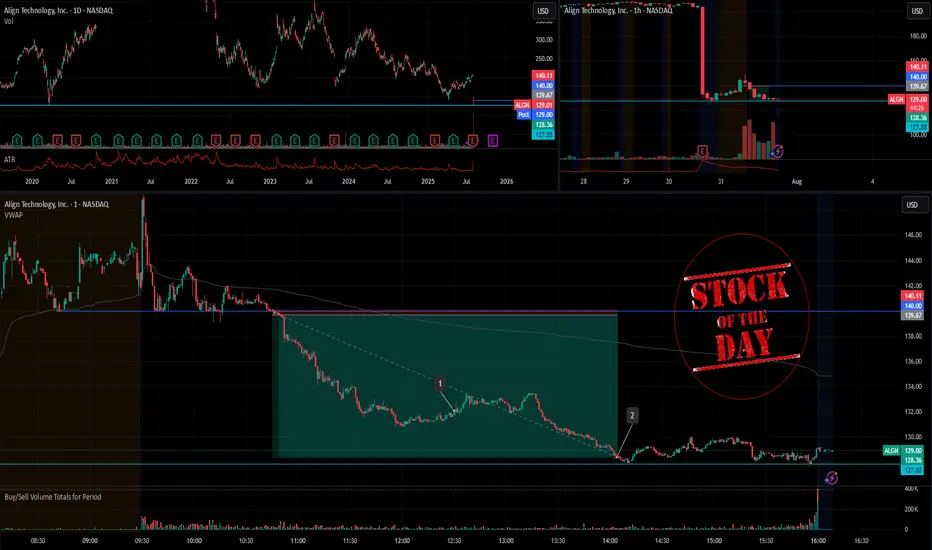
Stock Of The Day / 07.31.25 / ALGN07.31.2025 / NASDAQ:ALGN
Fundamentals. Suspected of possible violations of federal securities laws on the back of a negative earnings report.
Technical Analysis.
Daily Chart: Downtrend. Level 127.88 formed by the trend break in March 2020 is ahead.
Premarket: Gap down on increased volume. We mark the trend break level in the premarket at 140.0.
Trading Session: The price held the 140.0 level twice during the first hour after the opening of the trading session. Note the clear hold in the first case and the hold with false breakouts in the second. Also note that each subsequent pullback was smaller than the previous one. We are considering a short trade to continue the downward movement in case of the breakdown and hold of the 140.0 level.
Trading scenario: breakdown with retest (tightening with retest) of level 140.0
Entry: 139.67 after breakdown and hold the price below the level.
Stop: 140.11 we hide it above the tail of the retest candle.
Exit: We observe the strong downtrend. Cover the part of the position at 132.08 when the structure of the downtrend is broken (RR 1/17), after the downtrend resumes, hold the rest of the position until level 127.88 (1/25).
Risk Rewards: 1/21 (max. 1/25)
P.S. In order to understand the idea of the Stock Of The Day analysis, please read the following information .
Jsw energy fibonachi supports Jsw has taken support of 418 (golden ration 61.8) and then at 490(ratio .5) so 485 is the stop loss and it is ready for target of 595
Cmo 512

Journey of silver buy at support sell at resistance There is Up trending channel, follow the channel and make money since silver is long term bullish atleast.
Not mentioning the levels do the math follow the channel and find the support

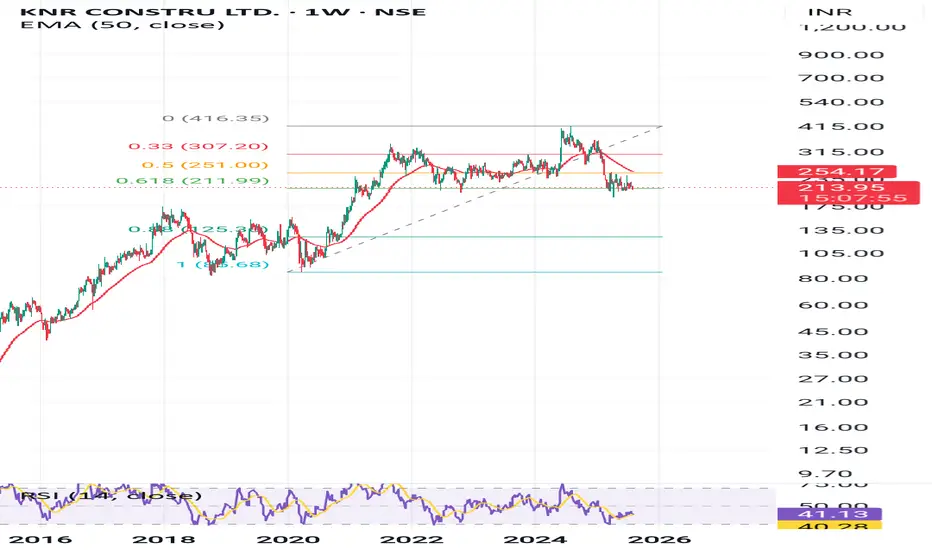
Retracement 61.8 golden ratio for KNR CONSTRUCTION Knr construction has corrected and taking support at fibonochi retracement level, might bounce from here keep an eye .
AGCO eyes on $120: Dual Fib Resistance to break and run to $140 AGCO earnings report was well received by the market.
Price surged into a resistance zone at $119.09-119.98
Looking for a Dip-to-Fib or Break-n-Retest to open longs.

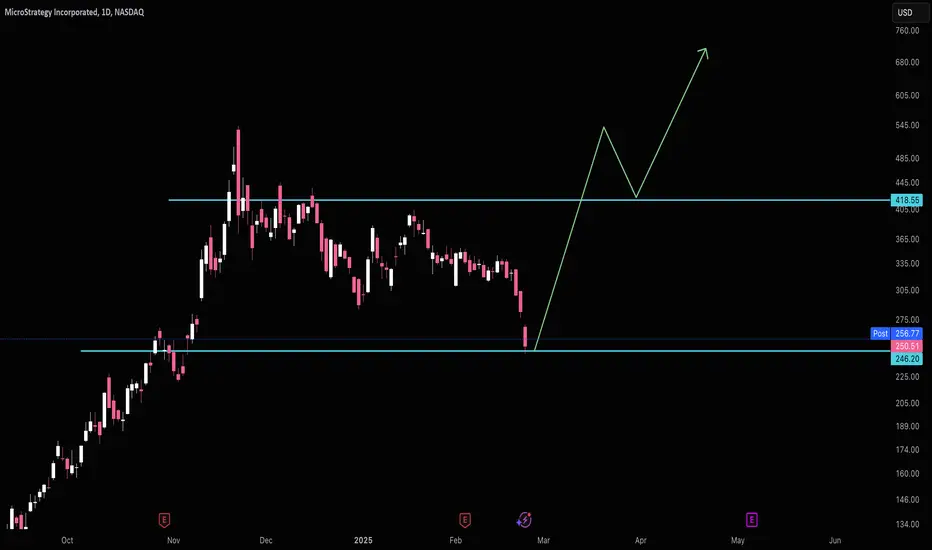
Strategy Hit SupportMSTR should easily hold $246 and make its way back up to $418 and form it's next support there.
Good luck!
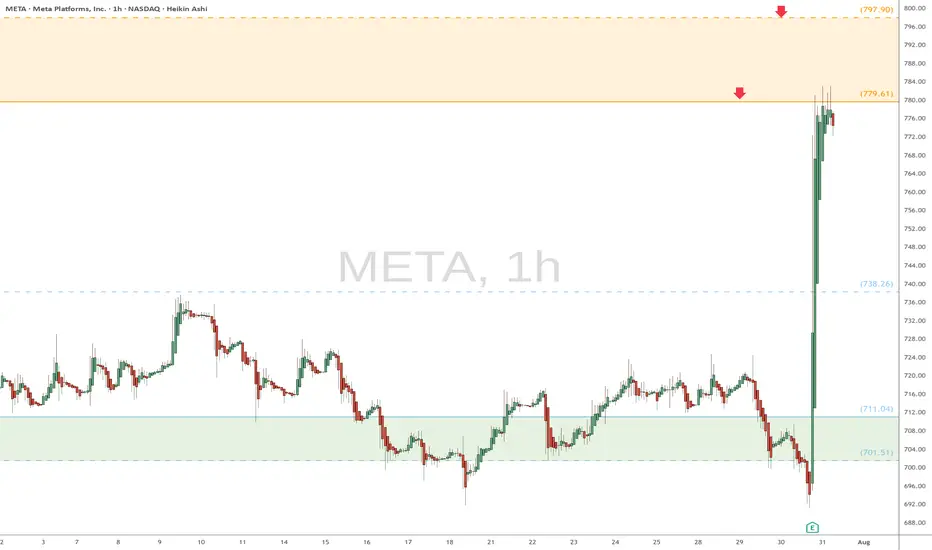
META watch $779 then 798: Dual Golden fib barrier to 800 round META earnings blew away the analyst expectations.
Surged into dual Golden fibs at $779.61 then 797.90
This "high gravity" zone will likely hold price for a bit.
.
See "Recent Publications" for previous charts ------------>>>>>>>>>
Such as this one that caught an HUGE BREAKOUT
Hit BOOST and FOLLOW for more such PRECISE and TIMELY charts.
=========================================================
.
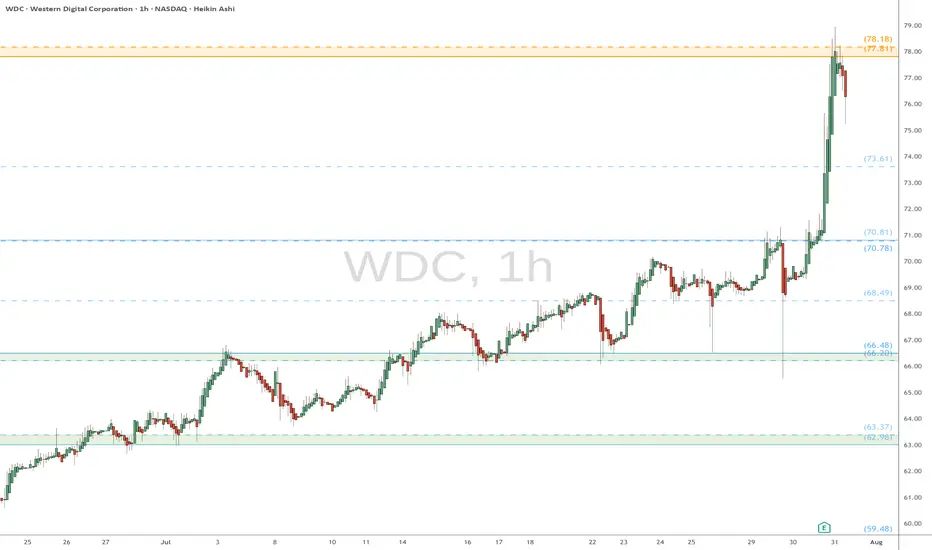
WDC eyes on $78: Double Golden fib zone should slow the surge WDC earnings report caused a break out from consolidation.
Price spiked into a Double Golden fib zone at $77.81-78.18
This "very high gravity" confluence should hold price for a bit.
Previous analysis that caught HUGE BREAKOUT
Hit BOOST and FOLLOW for more such PRECISE and TIMELY charts.
=========================================================
.
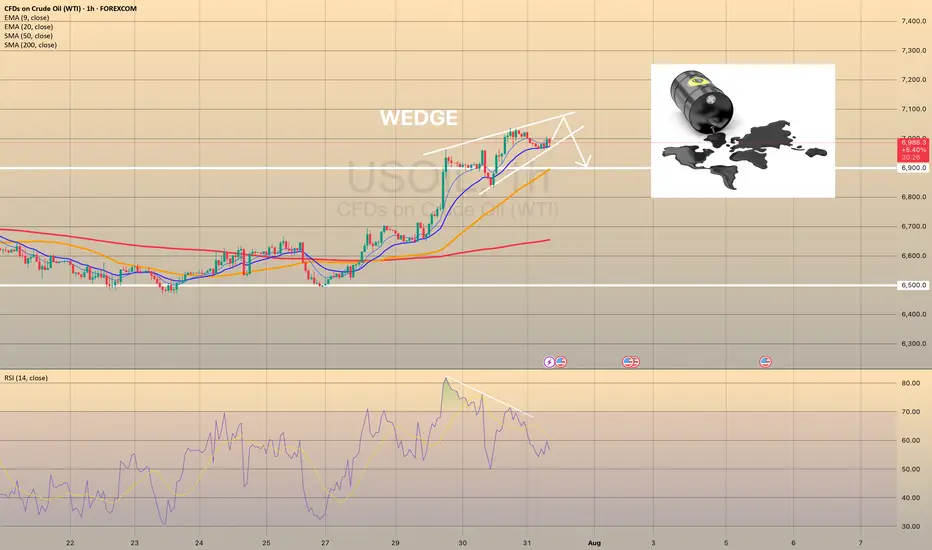
USOIL IS GOING BULLISH. FOR HOW LONG?USOIL IS GOING BULLISH. FOR HOW LONG?
Brent has started this week with a strong bullish momentum and holds near 6-week high on supply fears. President Trump announced plans to impose tariffs on Indian exports and penalize its Russian oil imports. In a parallel move, the US introduced its most extensive sanctions on Iran in seven years. The United States has even offered its oil to the world in exchange for Iranian and Russian oil, but there is evidence that the US production capacity is now at historic highs and is unlikely to grow in the near future.
However, technically oil shows us bearish divergence on RSI and bearish wedge here. The price may reverse towards 6,900.00 as a first target. EIA data showed US crude inventories jumped by 7.7 million barrels last week—the largest increase in six months and defying forecasts for a decline. Market participants are waiting for the OPEC+ meeting this week, expecting a significant output hike.
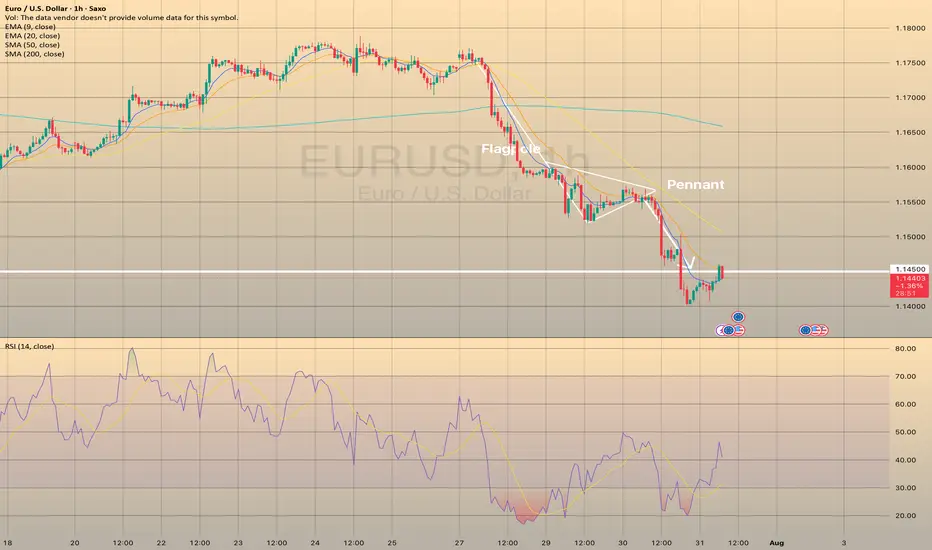
EURUSD REACHED THE TARGET.EURUSD REACHED THE TARGET.
EURUSD has reached the 1.14500 level and even broke it down. Currently the price consolidates slightly below this level. If the price forms a false breakout of 1.14500 level, this will mean the end of short-term decline in the pair. Stay cautious.
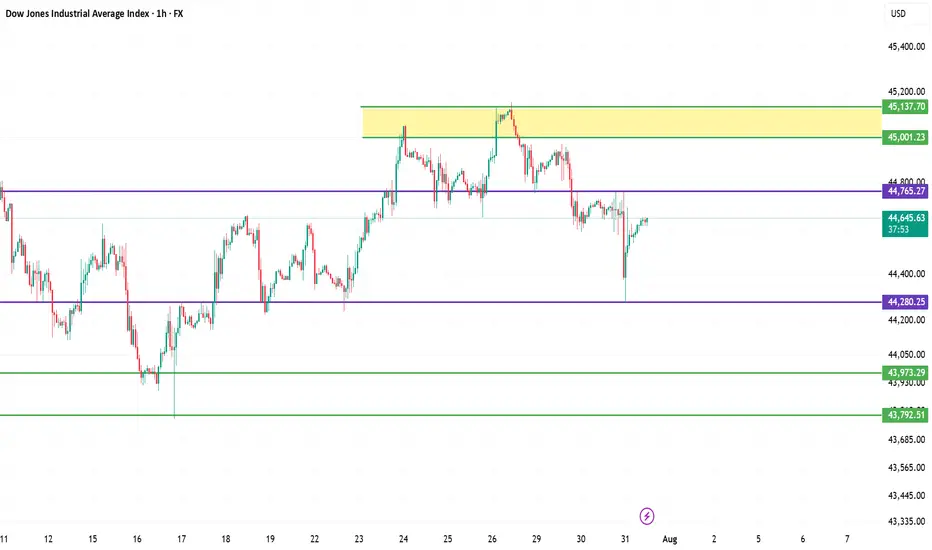
Dow Jones Industrial Average (DJI) – 1H Chart Analysis 1. Structure: Broad Range Consolidation
Price remains within a wide horizontal range between 45,137 resistance and 43,792 support. This shows indecision and distribution at highs.
2. Key Rejection Zone
The yellow zone around 45,001–45,137 acted as a strong supply area. Multiple rejections indicate heavy selling interest here.
3. Mid-Zone Compression
Current price is hovering just below 44,765 resistance — acting as a decision point. Break above it may retest the supply zone; rejection could send price lower.
4. Demand Holding at 44,280
The strong bounce from 44,280.25 shows buyers defending this demand zone. It's the key support to watch for bulls.
5. Next Play
Bullish: Break and hold above 44,765 targets 45,001–45,137.
Bearish: Failure leads to 44,280, then 43,973 → 43,792.
Neutral bias unless a clean breakout confirms direction.
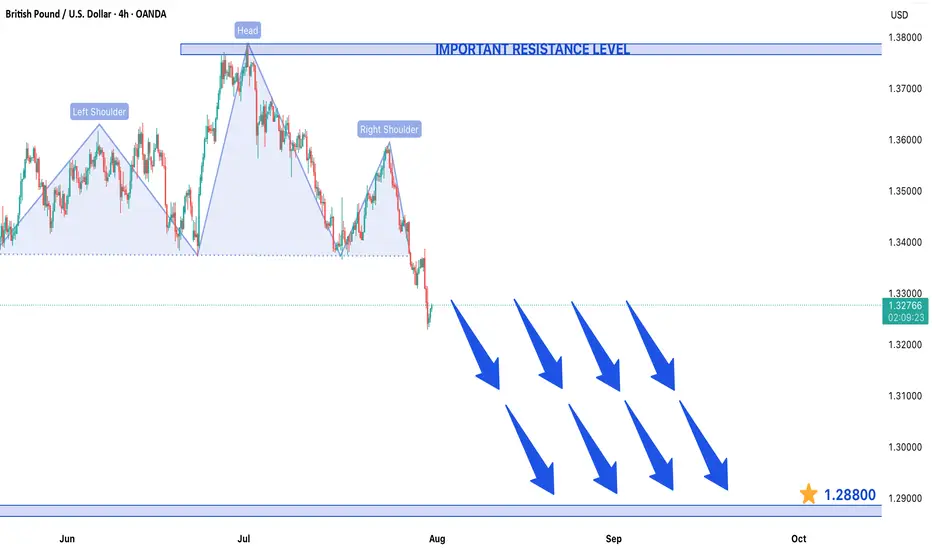
GBP/USD Forms Head and Shoulders Pattern in 4H Timeframe ChartGBP/USD Forms Head and Shoulders Pattern - Bearish Breakdown Expected
The GBP/USD currency pair has developed a clear Head and Shoulders (H&S) reversal pattern on the 4-hour chart, signaling potential weakness ahead. This technical formation - characterized by a central peak (head) flanked by two lower highs (shoulders) - suggests the recent uptrend may be exhausting as sellers gain control.
Current Market Structure
Price action remains confined within a bearish framework, making consistent lower highs and lower lows since failing at the pattern's right shoulder. The pair now tests critical support near the neckline of the H&S formation. A confirmed break below this level would validate the pattern and likely accelerate downward momentum.
Key Levels to Watch
- Downside Target: 1.28800 emerges as the next major support if bearish momentum sustains
- Resistance Zone: The 1.37900 level now acts as formidable overhead resistance
- Neckline Break: A daily close below current support would confirm the H&S pattern
Trading Implications
The technical setup favors:
1) Maintaining short positions while price holds below the right shoulder high
2) Watching for increased volume on breakdown moves to confirm bearish conviction
3) Considering long positions only if buyers reclaim 1.37900 resistance
Risk Factors
Traders should monitor:
- UK inflation data and BoE policy signals
- Fed interest rate expectations
- General USD strength across currency markets
This pattern projects approximately 900 pips of potential downside if fully realized. However, traders should wait for confirmed breakout momentum rather than anticipating the move, as false breakdowns remain possible in current market conditions. Proper position sizing and stop-loss placement above recent swing highs remains essential for risk management.