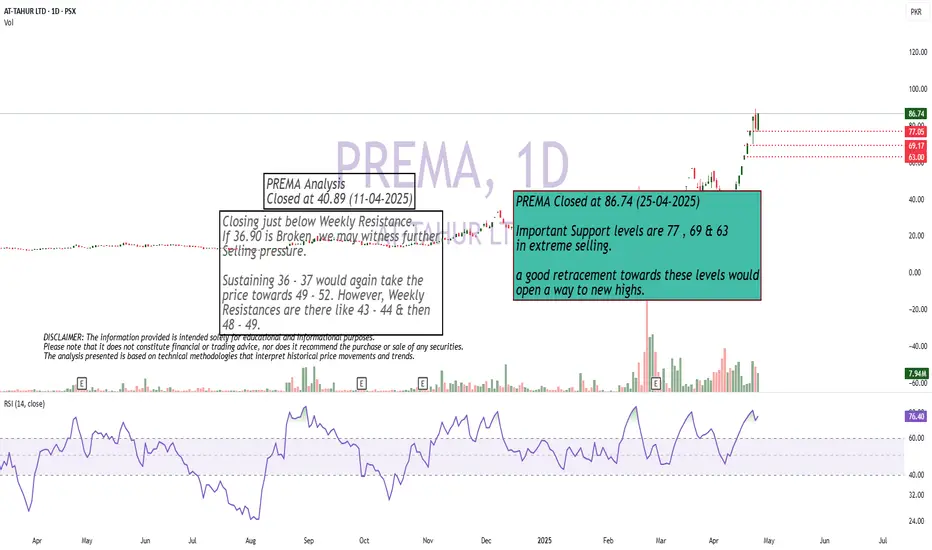
Channel bottom Support Taken...Important to Close above 40.84
on Monthly Basis for further
Upside.
Channel top is around 44 - 45
Supportandresistancezones

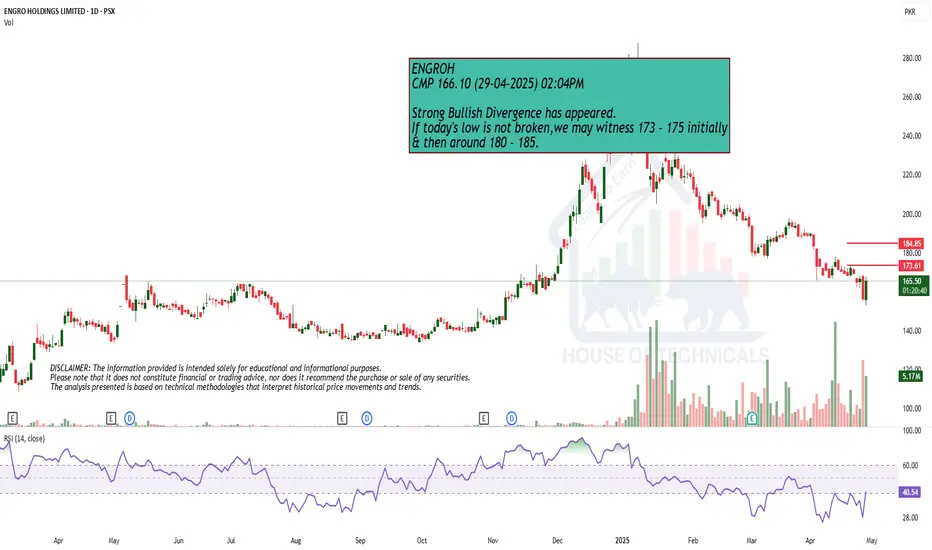
Strong Bullish DivergenceStrong Bullish Divergence has appeared.
If today's low is not broken,we may witness 173 - 175 initially
& then around 180 - 185.
CADCHF bullish view for this week
OANDA:CADCHF price action visible, price is make push on bottom trend line from PA, currently bouncing on sup zone 4h TF and from here exepcting for this week bullish continuation
SUP zone: 0.59200
RES zone: 0.60600, 0.61200

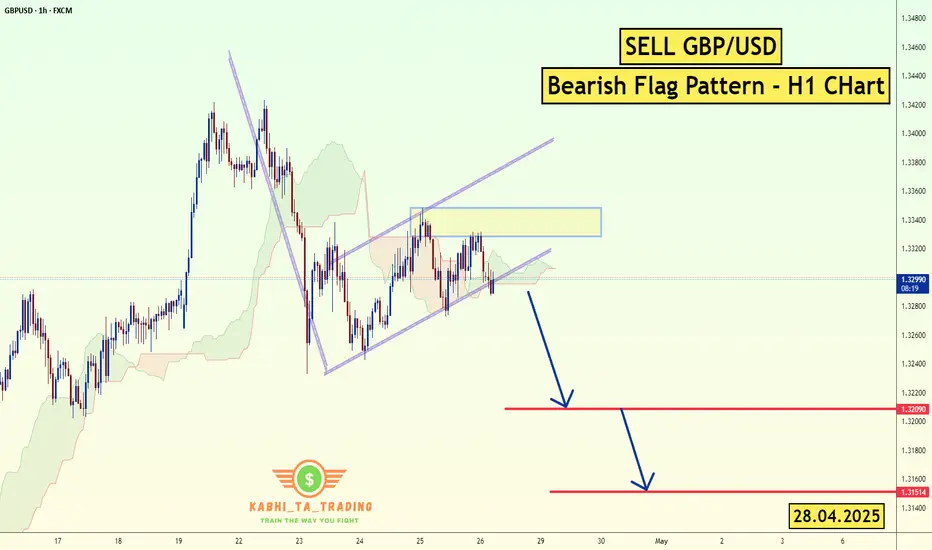
GBP/USD - H1 - Bearish Flag (28.04.2025)FX:GBPUSD The GBP/USD Pair on the H1 timeframe presents a Potential Selling Opportunity due to a recent Formation of a Bearish Flag Pattern. This suggests a shift in momentum towards the downside in the coming hours.
Possible Short Trade:
Entry: Consider Entering A Short Position around Trendline Of The Pattern.
Target Levels:
1st Support – 1.3209
2nd Support – 1.3151
🎁 Please hit the like button and
🎁 Leave a comment to support for My Post !
Your likes and comments are incredibly motivating and will encourage me to share more analysis with you.
Best Regards, KABHI_TA_TRADING
Thank you.
Fundamental Update :
on Monday as the trade tensions between the U.S. and China provided some relief to investors, while a stronger dollar further weighed on prices.
The U.S. dollar TVC:DXY rose 0.2% against a basket of currencies, making bullion more expensive for overseas buyers. TVC:DJI SP:SPX NASDAQ:IXIC also rising .
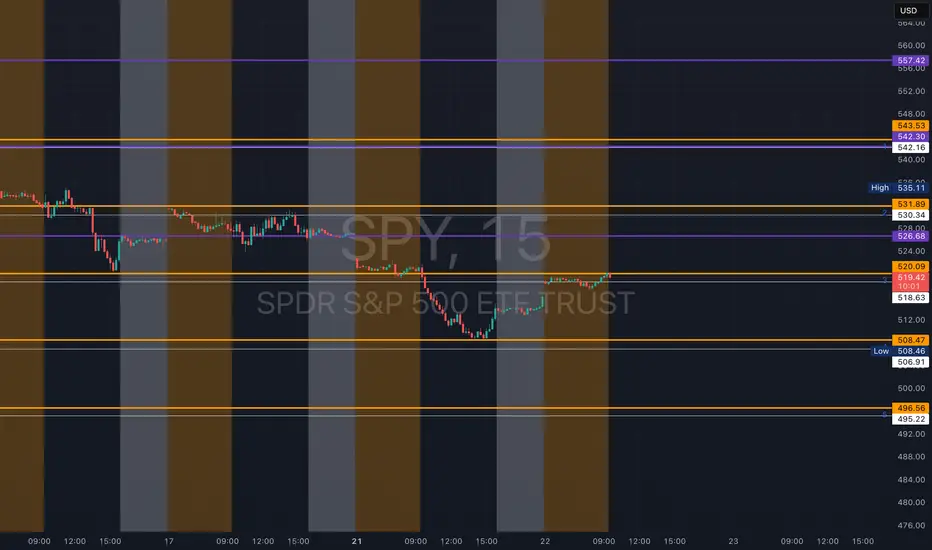
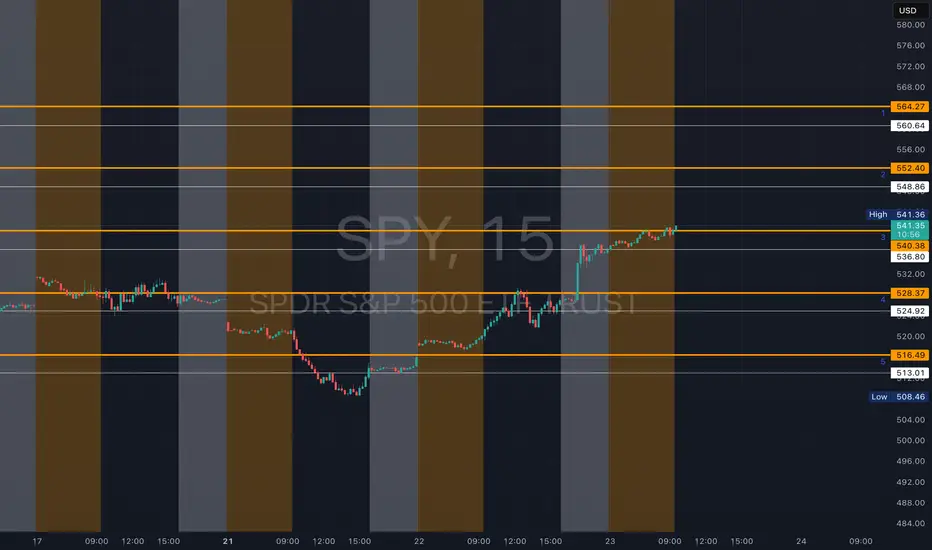
SPY - support & resistant areas for today April 28 2025These are Support and Resistance lines for today, April 28, 2025, and will not be valid for the next day. Mark these in your chart by clicking grab this below.
Yellow Lines: Heavily S/R areas, price action will start when closing in on these.
White Lines: Are SL, TP or Mid Level Support and Resistance Areas, these are traded if consolidation take place on them.
Sub R/S: An Area where price action could happen.

S&P 500: Key Levels and Potential ScenariosThis analysis of S&P500 will explore both bullish and bearish scenarios, incorporating key levels and considering possible market and crowd psychology.
Bullish Scenario: Potential Uptrend Resumption
From a bullish perspective, if the S&P 500 maintains a position above the 5482 level, it could suggest a potential end to the current correction and a resumption of the major uptrend. A hold above 5482 might reinforce bullish sentiment, encouraging further buying activity, as traders may view this as confirmation of renewed strength. The index could then potentially retest the 5801 level, where it's possible that the index may encounter resistance on the first attempt. A successful break above 5801 would then open the path towards the 6135 zone, which represents a key upside target.
Bearish Scenario: Potential Retest of Support Zones
Conversely, if the S&P 500 fails to hold above the 5482 support level might trigger increased selling pressure, as traders liquidate positions. The index could then potentially retest the 5092 to 4833 support zone. This zone represents a critical area where buyers may step in, but a break below it would signal further weakness.
Concluding Remarks
In conclusion, the S&P 500's price action around the identified key levels will be crucial in determining its short- to medium-term direction. A sustained hold above 5482 could favor a bullish continuation towards 5801 and potentially 6135, while a break below 5482 might lead to a retest of the 5092 to 4833 support zone.

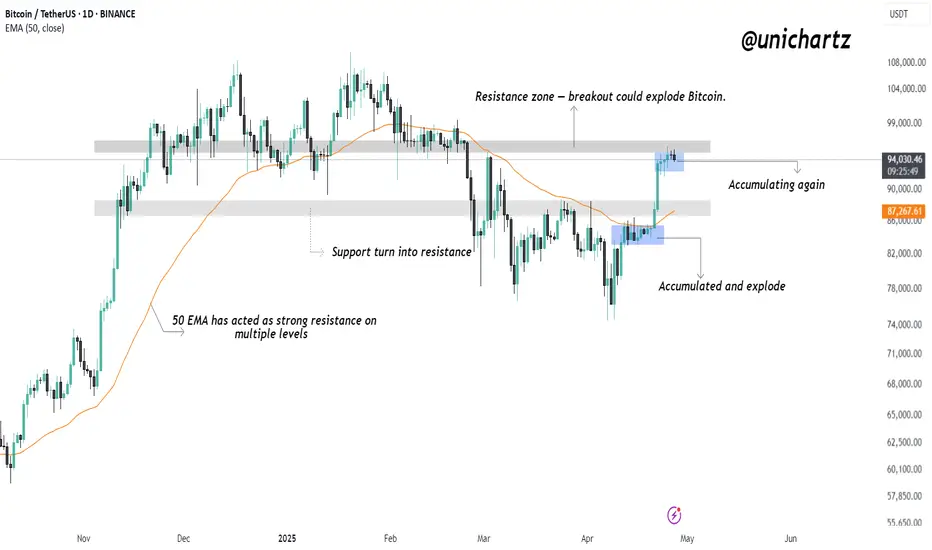
Accumulation Underway: Bitcoin’s Next Move Could Be ViolentBitcoin has shown a strong recovery after reclaiming the 50 EMA, which had been a major dynamic resistance across multiple levels. After accumulating between $83,000–$87,000, BTC broke out sharply and is now consolidating again just below a major resistance zone at $95,000–$97,000.
The current price action shows another accumulation phase just under resistance — similar to the previous pattern before the breakout.
A clean breakout above this resistance zone could explode Bitcoin toward $100,000+.
On the downside, if rejection occurs, the 50 EMA around $87,000 could act as strong support once again.
Let the Bearish Divergence dilute or Wait for 3322 atleast.Bearish Divergence is there on Daily Tf.
But Strong Support lies around 3229 - 3265
Otherwise, let it cross 3322 for the
target around 3350 - 3370

Formed Strong Double bottom around 40.Formed Strong Double bottom around 40.
Immediate Resistance is around 46 - 47
Crossing this level & sustaining with good volumes
may witness 48.50 - 49.
On the flip side, 44 - 44.50 seems to be a Good Support.

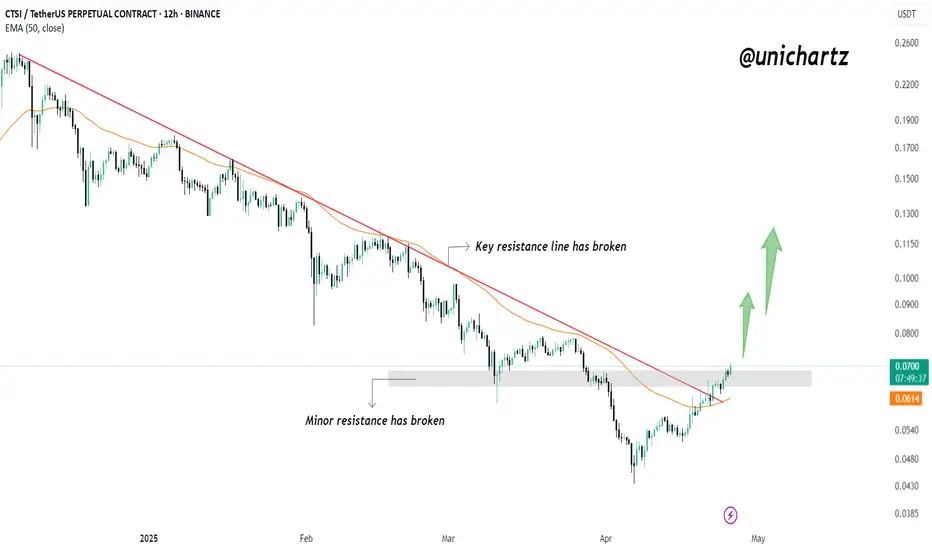
CTSI Breaks Major Downtrend – Is the Next Leg Up Here?CTSI/USDT – Bullish Breakout in Play
CTSI has broken out of a long-term descending trendline, signaling a major shift in market structure. After reclaiming the $0.063–$0.068 resistance zone as support, bulls are clearly in control.
Key Highlights:
✅ Downtrend broken after months of lower highs.
✅ Minor resistance flipped to support, confirming strength.
✅ RSI at 75.62 shows strong bullish momentum.
✅ Structure is now forming higher highs and higher lows — a key trend reversal sign.
🎯Upside Targets:TP1: $0.085
TP2: $0.110
Support to hold: $0.063
CTSI is gaining momentum — if support holds, the next leg up could be explosive.
SPY - support & resistant areas for today April 25 2025These are Support and Resistance lines for today, April 25, 2025, and will not be valid for the next day. Mark these in your chart by clicking grab this below.
Yellow Lines: Heavily S/R areas, price action will start when closing in on these.
White Lines: Are SL, TP or Mid Level Support and Resistance Areas, these are traded if consolidation take place on them.

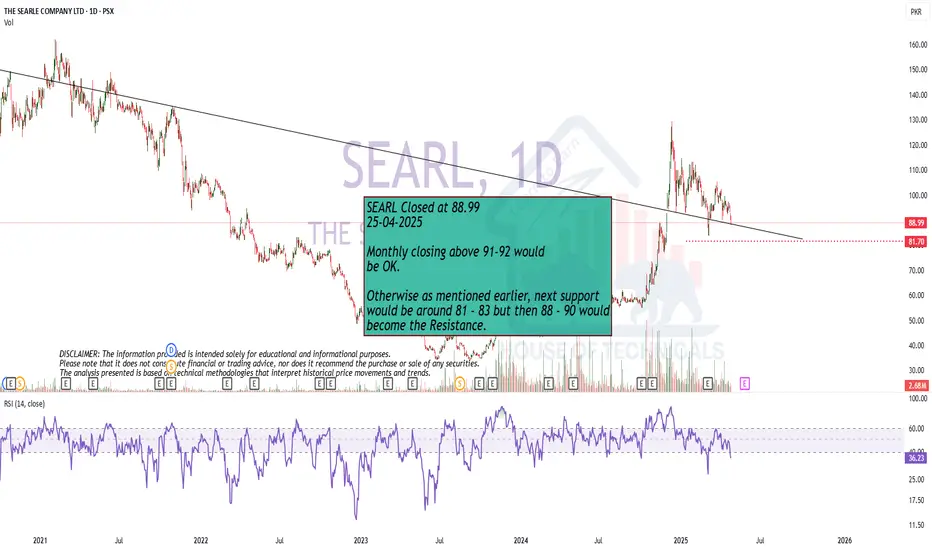
Monthly closing is Important!Monthly closing above 91-92 would
be OK.
Otherwise as mentioned earlier, next support
would be around 81 - 83 but then 88 - 90 would
become the Resistance.
Good Retracement Needed
Important Support levels are 77 , 69 & 63
in extreme selling.
a good retracement towards these levels would
open a way to new highs.
INTEL DROP --- FIELD COMM LOG #02242025🪖 WAR ROOM DISPATCH — FIELD REPORT FROM CAMP JARVIS & CAMP LIVERMORE
Date: 4/24/2025
Status: STANDBY
Volume: Normal
Current Order: HOLD
⚔️ SUMMARY OF ENGAGEMENTS – LAST 30 DAYS
The battlefield has been blood-red. Abnormal reactions litter the map. Morale was tested—but our troops never broke. The Red Army pushed hard, exploiting weakness, creating chaos. Yet we held.
📍Camp Jarvis
Coordinates: 115.10
☑️ Status: HOLD
📈 Trend: UPTREND
📊 ATR: Tightening (3.39)
🟩 Zone: Top of box: 115.10 | Bottom: 86.62
📢 Latest: “We’re nearing breakout. Position secure. Scouting volume now.”
Jarvis is seeing a shift—momentum is whispering beneath the soil. There's life stirring. But RSI is low (sub-45). This isn't the time for heroes—it’s a time for patience. Let the weak exhaust themselves.
📍Camp Livermore
Position: Natural Reaction Zone
☑️ Status: HOLD
📉 Trend: Weak uptrend but too early to act
🔄 Recent movement: Mixed signals, sporadic action, no confirmation.
Livermore's forces are strong in discipline, but not yet in numbers. They report: “Volume’s stable, but not convincing. We’ll move when the field confirms it—not before.”
📛 INTEL WARNING
The maps are clear—we are not in breakout yet.
There’s a false calm in the air.
Do NOT chase. Do NOT preempt.
This is how armies get slaughtered in the fog.
💡 Key Quote from Command:
“The Red Army still has strength. We’re holding—but holding isn’t winning. We wait for the flinch. The break. The rally cry. That’s when we move.”
🎖️ Current Position: HOLD
🛡️ Camp Jarvis: Monitoring breakout zone
🧭 Camp Livermore: Awaiting troop confirmation
📉 RSI low, Trend early
🔕 No All-Signal-Go confirmed
🚨 Mixed Signals = DO NOT ADVANCE
The war is not over.
But neither are we.

Why Should You Care About ER?🚀 Hey Traders! Have You Ever Felt Lost in the Chaos of Market Fluctuations?
What if I told you there’s a powerful tool that can help you cut through the noise and give you a statistical edge to predict SUPPORT and RESISTANCE movements with confidence?
Let me take 5 minutes of your time to introduce you to something that could transform your trading game: Expected Range Volatility (ER) .
What is Expected Range Volatility (ER)?
The Expected Range (ER) is a framework that helps traders understand how much an asset is likely to move within a specific timeframe. Based on CME market data and Nobel Prize-winning calculations, price movements within the expected volatility corridor have a 68% probability of staying within those boundaries.
💡 Key Insight: When the price approaching certain levels, there’s a 68% chance the price won’t break through those boundaries. This means you can use ER as a powerful filter to identify more precise entry and exit points for your trades.
Why Should You Care About ER?
When I first discovered the ER tool, it felt like stumbling upon a gold mine in the trading world. Here’s why:
It’s free and available on the CME exchange’s website.
It’s underutilized —95% of traders don’t even know it exists.
It provides statistical clarity in a world full of uncertainty.
I remember the first time I used ER in my analysis—it completely changed the way I approached intraday trading. Now, I never make a trade without checking the ER data. It’s become an essential part of my strategy.
How to Use ER in Your Trading
1️⃣ Input the Data: Head over to the CME website, plug in the necessary parameters, and get your ER values.
2️⃣ Set Boundaries: Use the ER range as a guide to set potential support and resistance levels.
3️⃣ Filter Trades: Only take trades that align with the ER framework to improve your precision.
A recent example is the Japanese yen futures market.
Don't be confused by the fact that we take futures levels, it can easily be plotted on a spot chart for forex market (the dollar/yen).
Limitations to Keep in Mind
While ER is a powerful tool, it’s not a crystal ball. Here are some limitations:
Market Dynamics: Short-term price movements can be unpredictable due to sentiment, news, or economic events. ER provides a statistical estimate, but it doesn’t guarantee outcomes.
Assumptions: The formula assumes price movements follow a log-normal distribution , which may not hold true in all market conditions.
Your Turn: Are You Using ER in Your Strategy?
💭 Here’s the million-dollar question: Are you leveraging the power of Expected Range Volatility in your trading? If not, why not start today?
💬 Share your thoughts in the comments below:
Do you currently use ER or similar statistical tools?
Want to Dive Deeper?
If you’re ready to take your trading to the next level, don’t miss out on our all-in-one resource designed to help you master tools like ER and other valuable sources to gain market edge!
🔥 Remember:
No Valuable Data = No Edge!
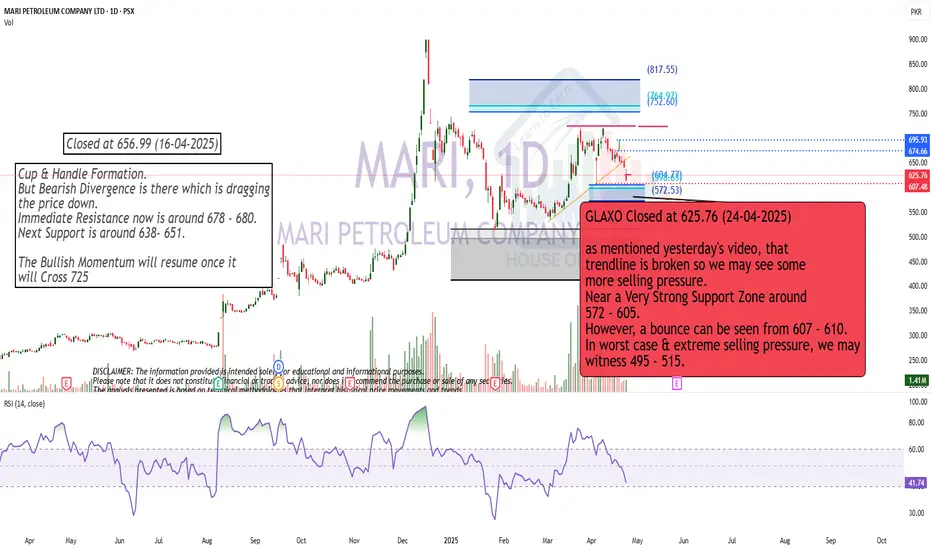
Play on levelsas mentioned yesterday's video, that
trendline is broken so we may see some
more selling pressure.
Near a Very Strong Support Zone around
572 - 605.
However, a bounce can be seen from 607 - 610.
In worst case & extreme selling pressure, we may
witness 495 - 515.
ETH gives a strong exit from the descending channel!Hello everyone, I invite you to review the current situation on ETH, because you can see a significant rebound at the level of 30% from the last low. When we enter the four-hour interval, we can see how the ETH price moved in the local downtrend channel, from which we got an exit at the top, such a scenario often gives increases at the level of the channel height, which would bring the price closer to the levels of $ 2100.
Here you can see how the current rebound brought the movement closer to the resistance at the level of $ 1830, and then resistance is visible at the price of $ 1950, where the ETH price must then face a strong resistance zone from $ 2060 to $ 2100, where there could potentially be an upward movement after leaving the channel as in this case.
Looking the other way, you can see that when the trend reverses, we first have support at the level of $ 1730, but if it is broken, the ETH price may continue to fall and return to a strong support zone from $ 1480 to $ 1380.
It is worth paying attention to the MACD and RSI indicators because you can see how in the 4H interval we have gone beyond the upper limits of the ranges, which may translate into visible price consolidation on the chart in order to cool the situation.

SPY - support & resistant areas for today April 23 2025These are Support and Resistance lines for today, April 23, 2025, and will not be valid for the next day. Mark these in your chart by clicking grab this below.
Yellow Lines: Heavily S/R areas, price action will start when closing in on these.
White Lines: Are SL, TP or Mid Level Support and Resistance Areas, these are traded if consolidation take place on them.
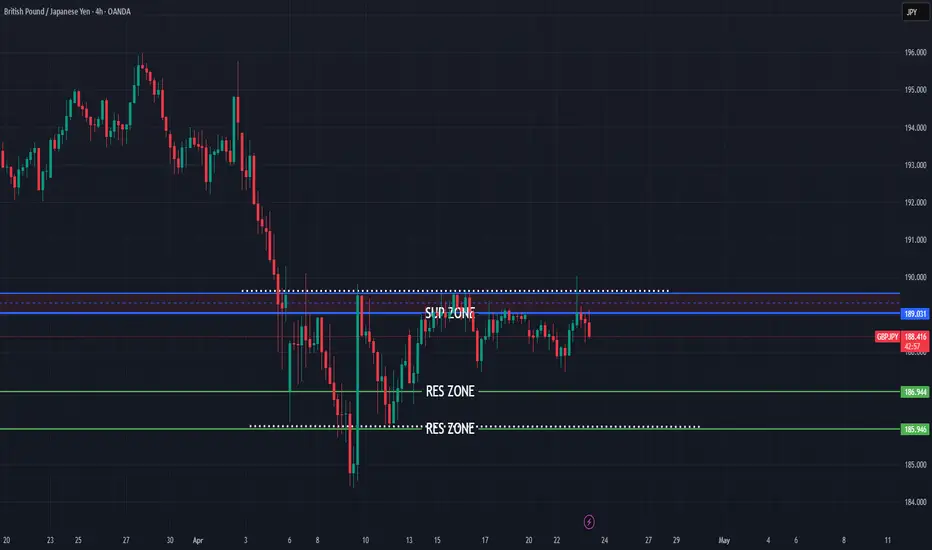
GBPJPY short bearish push expecting
OANDA:GBPJPY price action based trade, here short bearish push expecting till bottom line.
SUP zone: 189.050
RES zone: 186.950, 185.950
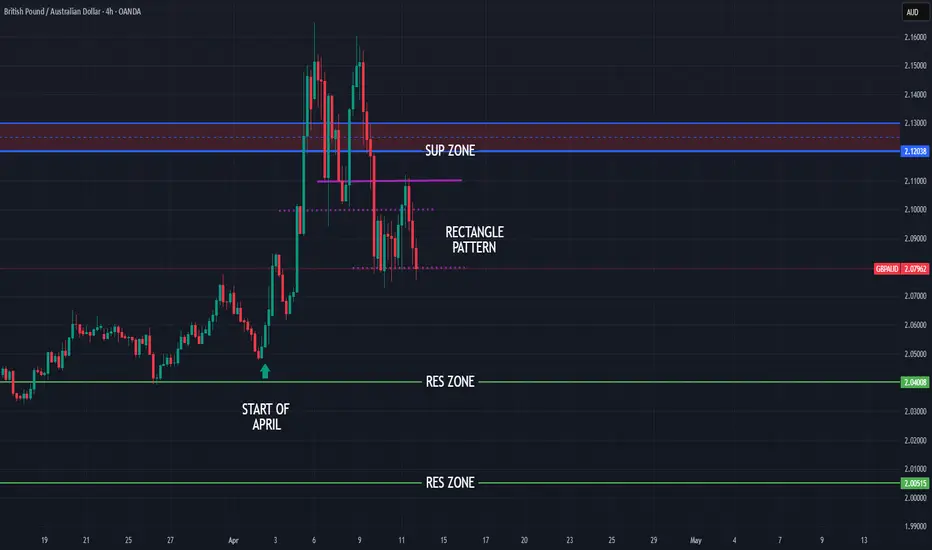
GBPAUD bearish view for new week
OANDA:GBPAUD from first analysis from 26.Mart we are folow situation, i am make updates, we are not have bearish trend confirmation, price is make new bullish push on start of April.
Currently from start of last week price is start showing bearish signs. We have now 4h rectangle pattern visible, from here in new week expecting still bearish continuation.
SUP zone: 2.12000
RES zone: 2.04000, 2.00500
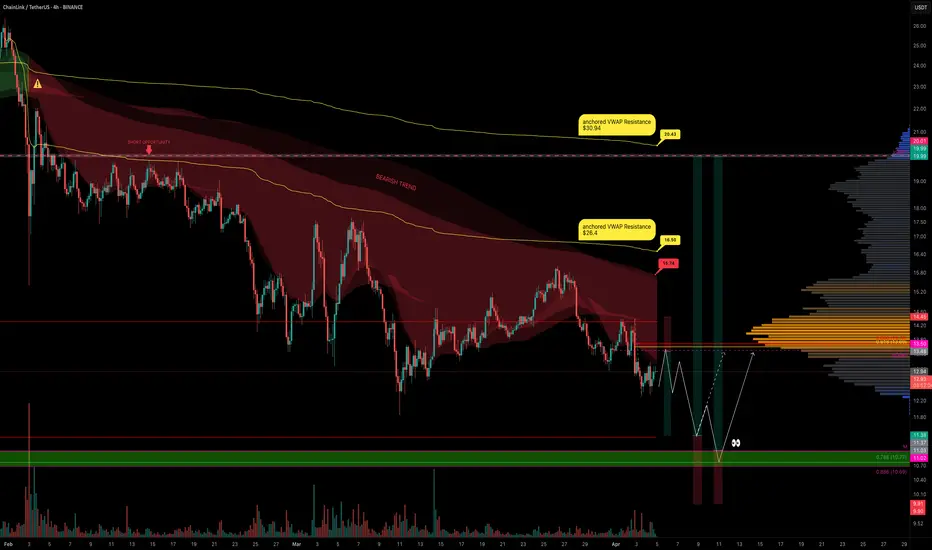
Panic Selling LINK? Here’s Your Master PlanBuckle up! LINK has been riding a relentless bearish trend for 113 days, ever since it kissed its peak of $30.94 back in December 2024. With economic uncertainty casting a shadow over the markets and fear gripping investors, the big questions loom: Is this the dip to buy while others panic-sell? Or is it wiser to sit on the sidelines? Let’s slice through the noise, dissect LINK’s chart like a seasoned pro, and uncover the setups that could turn this chaos into opportunity. Let’s dive in!
The Big Picture: LINK’s Bearish Blueprint
LINK is currently trading at $13, a far cry from its yearly open of $20. April has kicked off, and LINK has already surrendered the monthly open at $13.5, a critical level now acting as a brick wall overhead. Zooming out, the trend is unmistakably bearish: lower highs and lower lows dominate the chart. Adding fuel to the fire, LINK is languishing below the Point of Control (POC) at $14.32, derived from a 1.5-year trading range. This is a market screaming caution for bulls and whispering opportunity for bears, at least for now.
But charts don’t lie, and they’re packed with clues. Let’s map out the key levels, pinpoint trade setups, and arm ourselves with a plan that’d make even the most seasoned traders nod in approval.
Resistance Zones: Where Bears Sharpen Their Claws
1.) Resistance - The Golden Pocket ($13.6 - $13.7)
Using the Fibonacci retracement tool on the latest downward wave, the golden pocket (0.618 - 0.65 Fib) aligns beautifully with the monthly open at $13.5. Oh wait there’s more, this zone overlaps with a Fair Value Gap (FVG), making it a magnet for price action.
Trade Setup (Short):
Entry: ~$13.5 (if price tests and rejects this zone).
Stop Loss (SL): Above the recent swing high at $14.4.
Take Profit (TP): First target at $11.85 (swing low), with a stretch goal at $11.
Risk-to-Reward (R:R): A solid 2:1.
The Play: If LINK crawls up to this resistance and gets smacked down, bears can pounce. Watch for rejection candles (e.g., shooting star, bearish engulfing) to confirm the move.
2. Key Resistance - Cloud Edge & VWAP ($15.74 - $16.5)
The Cloud edge of my indicator sits at $15.74, while the anchored VWAP (from the $26.4 high) hovers at $16.5. A break above $16.5 would flip the script, snapping the bearish structure and signaling a potential trend reversal.
Bullish Scenario: If bulls reclaim $16.5 as support, it’s a green light for a long trade. Until then, this is a fortress for bears to defend.
The Play: No bullish setups here yet.
Support Zones: Where Bulls Build Their Base
1.) Support - Swing Low ($11.85)
This is the first line in the sand for bulls. A potential Swing Failure Pattern (SFP), where price dips below $11.85, sweeps liquidity, and reverses—could spark a long trade.
The Play: Watch for a bullish reversal candle or volume spike here.
2.) Major Support Cluster - The Golden Zone ($10 - $11.85)
This is where the chart sings a symphony of confluence:
Swing Low: $11.85.
POC: $11.33 (1.5-year trading range).
Monthly Level: $11.02.
Fib Retracement: 0.886 at $10.69 and 0.786 (log scale) at $10.77.
Psychological Level: $10.
Trade Setup (Long):
Entry: Dollar-Cost Average (DCA) between $11.85 and $10.
Stop Loss (SL): Below $10
Take Profit (TP): First target: $13.5 (monthly open), stretch goal: $20 (yearly open).
Risk-to-Reward (R:R): A monstrous 6:1 or better, depending on your average entry. This is the kind of trade we are looking for!
The Play: Patience is key. Wait for confirmation—think bullish engulfing candles, a surge in volume, or positive order-flow momentum. This isn’t a “hope and pray” trade; it’s a calculated ambush on the bears.
Market Structure: Bears Rule, But Bulls Lurk
Right now, LINK’s chart is a bear’s playground—lower highs, lower lows, and no bullish momentum to speak of. The $16.5 VWAP is the line in the sand for a trend shift, but until then, short trades take priority. That said, the $10 - $11.85 support zone is a coiled spring for bulls. If fear drives LINK into this range, it’s time to load the boat with longs—provided confirmation aligns.
Your Trading Edge
LINK’s 113-day bearish descent is a wild ride, but it’s not random chaos—it’s a roadmap. Bears can feast on rejections at $13.5 - $13.7 with a tidy 2:1 R:R short. Bulls, meanwhile, should stalk the $10 - $11.85 zone for a high-probability long with a 6:1+ R:R payoff. Whether you’re scalping the dips or swinging for the fences, these levels give you the edge to trade with confidence.
So, what’s it gonna be? Short the resistance and ride the wave down? Or stack bids at support and catch the reversal of a lifetime? The chart’s laid bare—now it’s your move. Drop your thoughts below, and let’s conquer this market together!
If you found this helpful, leave a like and comment below! Got requests for the next technical analysis? Let me know, I’m here to break down the charts you want to see.
Happy trading =)
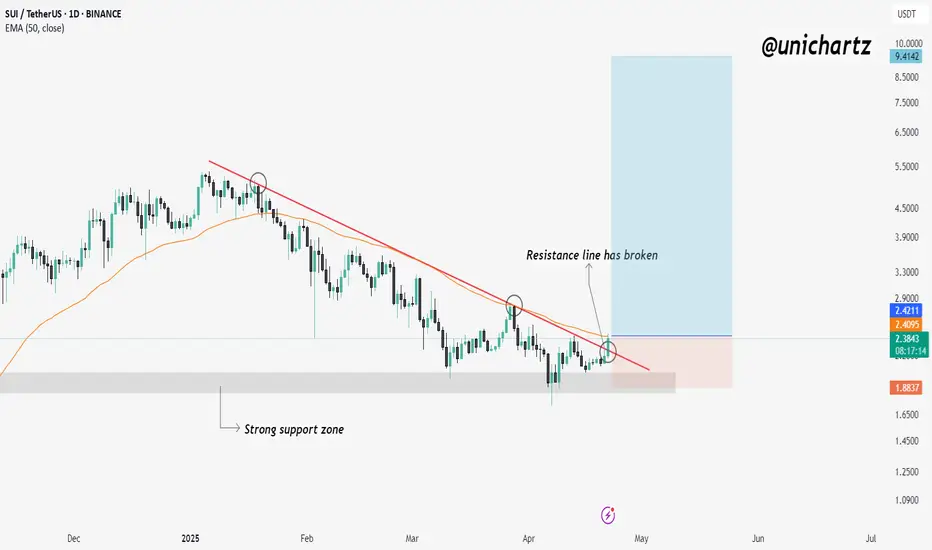
SUI Breaks Key Trendline – Bullish Reversal in MotionCRYPTOCAP:SUI has broken above the descending resistance line, confirming a trend reversal after weeks of downward movement. This breakout came after price bounced from a strong support zone, establishing a higher low structure.
The breakout is also supported by a move above the 50 EMA, adding strength to the bullish case.
DYOR, NFA
SPY - support & resistant areas for today April 22 2025These are Support and Resistance lines for today, April 22, 2025, and will not be valid for the next day. Mark these in your chart by clicking grab this below.
Yellow Lines: Heavily S/R areas, price action will start when closing in on these.
White Lines: Are SL, TP or Mid Level Support and Resistance Areas, these are traded if consolidation take place on them.