DOGE/USDT Technical Analysis – Breakout AnticipationDOGE/USDT Technical Analysis – Breakout Anticipation
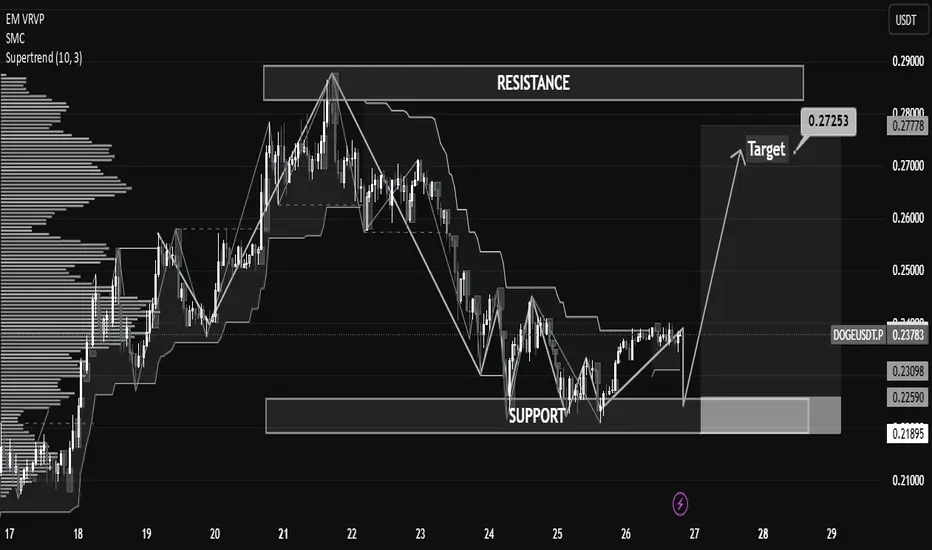
As of the current market structure, DOGE/USDT is showing signs of a potential bullish reversal from the demand zone (support), aiming toward the projected target at 0.27253 USDT.
🔍 Chart Structure & Price Action
Support Zone (0.21873 – 0.22568): The price has previously respected this area, making it a strong demand zone where buyers stepped in.
Resistance Zone (0.27756 – 0.29000): A key supply zone where previous rallies halted. This is the ultimate test for bulls after the breakout.
Current Price (0.23743) is showing consolidation above the support, suggesting accumulation before a move.
🧠 Technical Indicators
Supertrend Indicator: Currently flipping to bullish (10,3 settings), indicating potential upside continuation.
Volume Profile (VRVP): Shows high volume nodes around the support level, confirming strong interest from institutional players or large orders.
Market Structure: A higher-low is forming, indicating early signs of a bullish market shift.
🎯 Target
The projected move towards 0.27253 USDT aligns with previous price action and supply zone interaction. A clean breakout from the current consolidation could fuel momentum toward this level.
🎓 Educational Insight
This setup reflects the principles of Smart Money Concepts (SMC):
Price tapping into demand before impulse moves.
Liquidity grab at lows.
Break of structure (BOS) to the upside could trigger continuation.
Traders can learn the value of combining structure-based trading with volume analysis to improve entry precision and confidence.
Supportandresistancezones
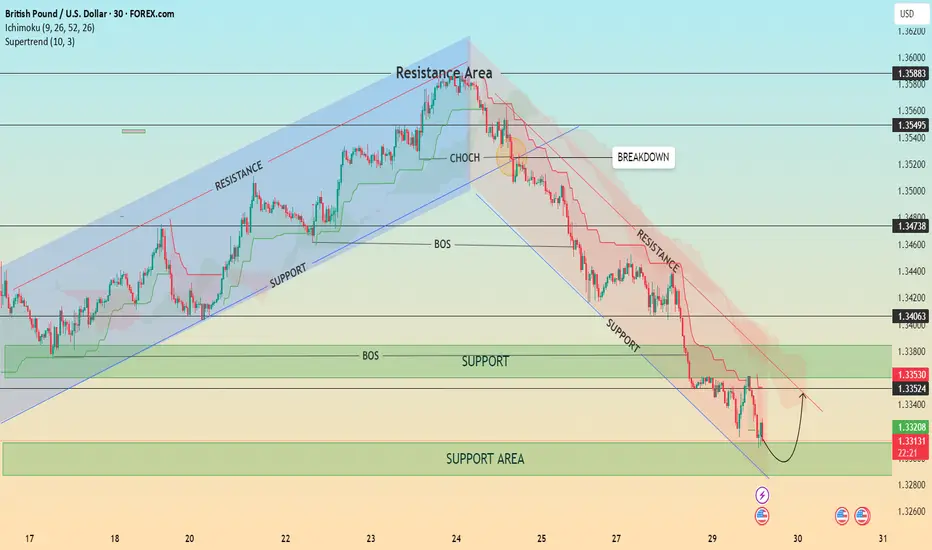
GBP/USD – Bearish Structure with Possible Short-Term Pullback📊 GBP/USD – Bearish Structure with Possible Short-Term Pullback
Timeframe: 30-Minute | Date: July 29, 2025
Price action recently broke down from a well-respected ascending channel, confirming a shift in market structure with a Change of Character (CHOCH) followed by a Break of Structure (BOS). Since then, GBP/USD has been respecting a descending trend channel, forming consistent lower highs and lower lows.
🔍 Current Setup:
Price is testing a major support area around 1.3300–1.3320.
A minor pullback is expected as indicated by the bullish wick rejections.
However, the overall bias remains bearish unless we break and hold above the 1.3353–1.3406 resistance zone and the descending trendline.
The Ichimoku Cloud and Supertrend both show bearish momentum.
📈 Potential Scenario:
Price may bounce from the support area and retest the upper boundary of the descending channel before resuming the bearish trend.
⚠️ Key Levels to Watch:
Resistance: 1.33530 / 1.34063 / 1.34738
Support: 1.33200 / 1.33000
💡 Structure Notes:
CHOCH = Trend Reversal Signal
BOS = Confirmation of Downtrend
Cloud = Dynamic Resistance
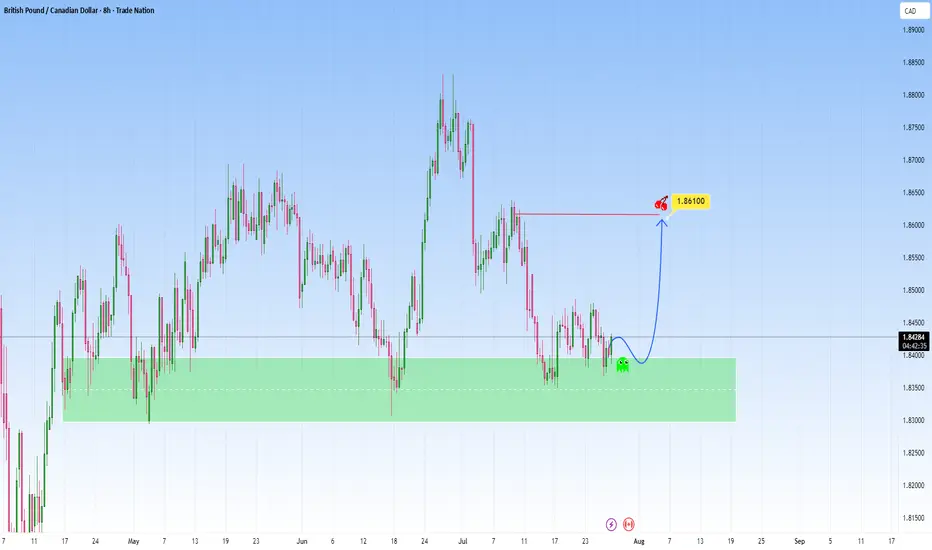
GBPCAD At Support - High probability reversalGBPCAD descended with strength, and has now reached a strong support zone.
Price now hovers above and this zone and is a great indication to use for possible reversal move, that could send price into the 1.86100 level.
But if price breaks below support with momentum, then I’ll back off this bullish bias and reassess, and consider the reversal idea invalidated, with potential for further downside.
Just sharing my thoughts for the charts, this isn’t financial advice. Always confirm your setups and manage your risk properly.
Disclosure: I am part of Trade Nation's Influencer program and receive a monthly fee for using their TradingView charts in my analysis.
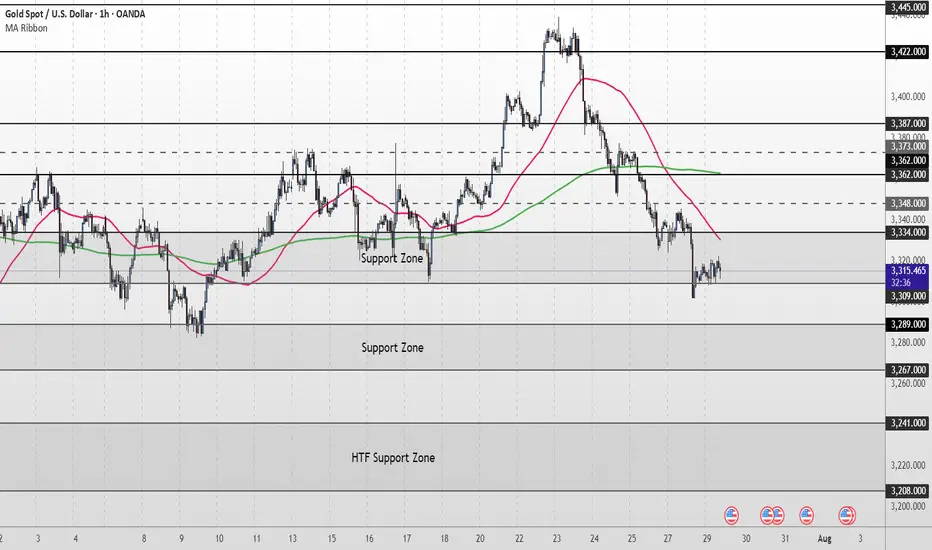
XAU/USD Intraday Plan | Support & Resistance to WatchGold remains under pressure, currently trading around 3,312. Price is holding just above the 3,309–3,289 Support Zone, but remains below both the 50MA and 200MA, which continue to slope downward—indicating short-term bearish pressure.
As long as price remains below the 3,334–3,348 resistance zone, the bearish momentum is intact. A clean break above this area would be the first sign of recovery, opening the path toward 3,362 and 3,373, where the next round of supply may emerge.
If price fails to reclaim 3,334 and breaks below 3,309, the 3,289–3,267 Support Zone becomes the next key downside target. Failure to hold that level would expose the HTF Support Zone (3,241–3,208).
📌 Key Levels to Watch
Resistance:
‣ 3,334
‣ 3,348
‣ 3,362
‣ 3,373
Support:
‣ 3,309
‣ 3,289
‣ 3,267
‣ 3,241
🔍 Fundamental Focus – Tuesday, July 29
Heads up — today’s focus is on 4:00pm, when we get JOLTS Job Openings 🟥 and CB Consumer Confidence 🟡
⚠️ Stay light and nimble — bigger moves may come tomorrow with red-folder data stacking up.
July 29, Forex Outlook : High-Reward Setups You Shouldn’t Miss!Welcome back, traders!
In today’s video, we’ll be conducting a Forex Weekly Outlook, analyzing multiple currency pairs from a top-down perspective—starting from the higher timeframes and working our way down to the lower timeframes.
Pairs to focus on this Week:
USDJPY
AUDJPY
CADJPY
EURGBP
GBPCHF
USDCHF
NZDCHF
EURNZD
Our focus will be on identifying high-probability price action scenarios using clear market structure, institutional order flow, and key confirmation levels. This detailed breakdown is designed to give you a strategic edge and help you navigate this week’s trading opportunities with confidence.
📊 What to Expect in This Video:
1. Higher timeframe trend analysis
2. Key zones of interest and potential setups
3. High-precision confirmations on lower timeframes
4. Institutional insight into where price is likely to go next
Stay tuned, take notes, and be sure to like, comment, and subscribe so you don’t miss future trading insights!
Have a great week ahead, God bless you!
The Architect 🏛️📉

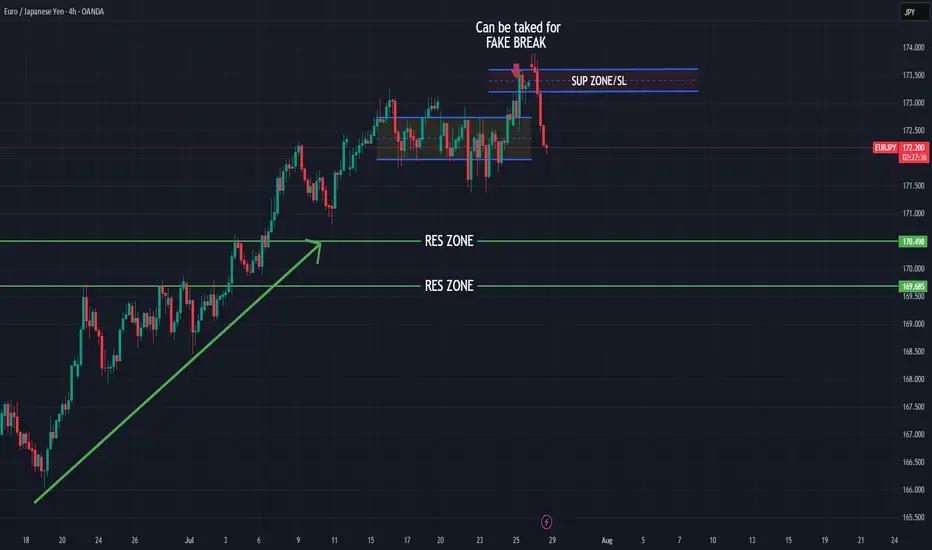
EURJPY point of revers?
OANDA:EURJPY constantly pushing in last periods, currently on this point expecting trend revers and short bearish push.
SUP zone: 173.200
RES zone: 170.500, 169.700
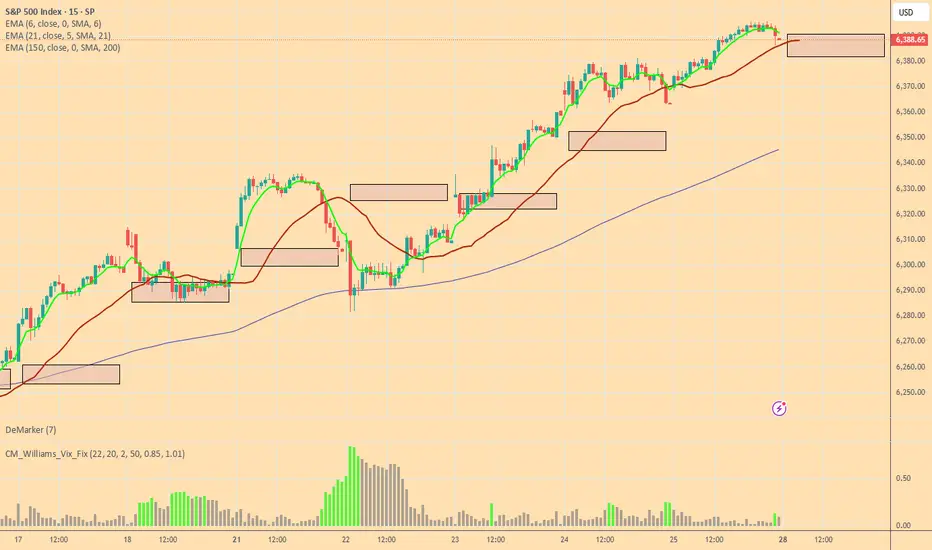
Bulls and Bears zone for 07-28-2025Last week 4 out of 5 sessions S&P 500 made new ATH. However they were all trading within a tight range.
Level to watch: 6434---6436
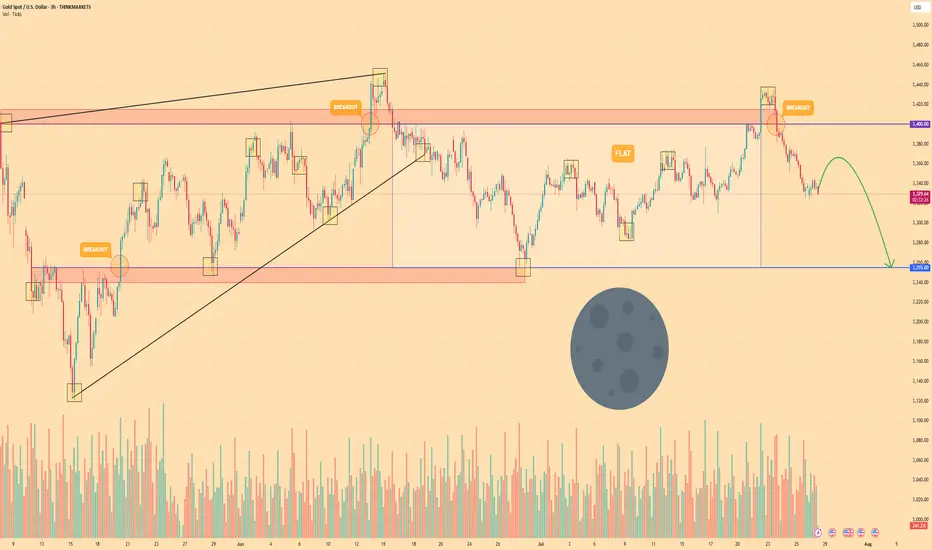
GOLD - Price can continue to decline to support levelHi guys, this is my overview for XAUUSD, feel free to check it and write your feedback in comments👊
After exiting a prior wedge formation, the price entered a prolonged phase of sideways movement.
This established a wide flat channel, with a clear resistance zone near $3400 and a strong support base around $3255.
For an extended period, the asset rotated within this range, making several attempts to breach both the upper and lower boundaries.
The most recent rally was forcefully rejected from the resistance area at $3400, indicating strong selling pressure.
This rejection initiated a significant downward impulse, which has now positioned the price in the lower half of the consolidation range.
I expect that after a brief upward retest, the bearish momentum will resume, pushing the price down to its primary target at the $3255 support level.
If this post is useful to you, you can support me with like/boost and advice in comments❤️
Disclaimer: As part of ThinkMarkets’ Influencer Program, I am sponsored to share and publish their charts in my analysis.
EURJPY ANALYSIS After seeing the weekly close bullish we could expect the pair to continue the bullish leg this new week with the daily and 4hr trading in the same direction. An upside target of 175.000 could be the profit taking areas for the next leg to the upside

GBP/CAD - H4 - Bearish Flag (26.07.2025)The GBP/CAD Pair on the H4 timeframe presents a Potential Selling Opportunity due to a recent Formation of a Bearish Flag Pattern. This suggests a shift in momentum towards the downside in the coming Days.
Possible Short Trade:
Entry: Consider Entering A Short Position around Trendline Of The Pattern.
Target Levels:
1st Support – 1.8242
2nd Support – 1.8139
🎁 Please hit the like button and
🎁 Leave a comment to support for My Post !
Your likes and comments are incredibly motivating and will encourage me to share more analysis with you.
Best Regards, KABHI_TA_TRADING
Thank you.
Disclosure: I am part of Trade Nation's Influencer program and receive a monthly fee for using their TradingView charts in my analysis.

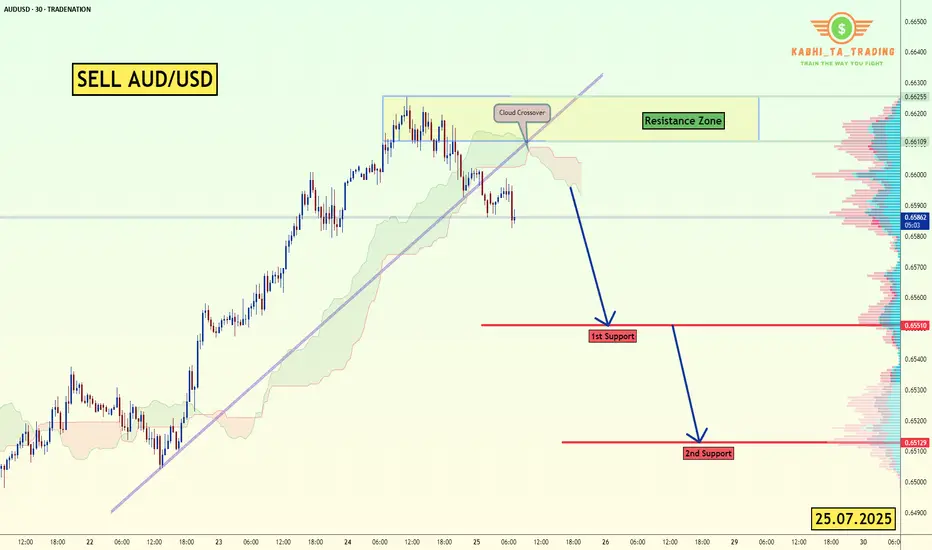
AUD/USD - Breakout (25.07.2025)The AUD/USD Pair on the M30 timeframe presents a Potential Selling Opportunity due to a recent Formation of a Trendline Pattern. This suggests a shift in momentum towards the downside in the coming hours.
Possible Short Trade:
Entry: Consider Entering A Short Position around Trendline Of The Pattern.
Target Levels:
1st Support – 0.6551
2nd Support – 0.6513
🎁 Please hit the like button and
🎁 Leave a comment to support for My Post !
Your likes and comments are incredibly motivating and will encourage me to share more analysis with you.
Best Regards, KABHI_TA_TRADING
Thank you.
Disclosure: I am part of Trade Nation's Influencer program and receive a monthly fee for using their TradingView charts in my analysis.
Understanding Market Structure: GBPJPY Trendline Support 📊 GBPJPY Technical Analysis — 15-Min Chart (As of July 24, 2025)
Trend Structure & Price Action
The chart shows a clear ascending trendline, connecting higher lows across the last sessions.
Multiple Break of Structure (BOS) points confirm bullish market behavior, with price consistently forming higher highs and higher lows.
The most recent BOS and price rejection from the lower boundary of the cloud band indicate bullish intent is still active.
Indicators Used
Custom Cloud Band (EMA Based 20, 1.5 settings):
Price is oscillating within and around the cloud band.
Recent candles are attempting to reclaim the upper band, suggesting building bullish momentum.
Volume Profile (VRVP) shows strong volume support around the 198.200–198.500 range, aligning with the trendline.
Support & Resistance
Support Zone: 198.200 (trendline confluence + volume shelf)
Immediate Resistance: 198.800–199.000
Major Resistance: 199.400 (next psychological level and prior high)
Forecast & Trade Idea (Educational Purpose)
If price continues to respect the ascending trendline and breaks above the recent local high (~198.750), we could see a bullish breakout toward 199.200+.
A bullish flag or small consolidation above the trendline before breakout is likely, as illustrated by the arrow.
Invalidation occurs if price breaks and closes below the trendline and 198.200, which may trigger a short-term correction.
✅ Conclusion
GBPJPY is currently in a bullish market structure with support from both trendline and volume profile. A clean breakout above 198.800 with volume confirmation could fuel continuation toward 199.200 and beyond. Risk management is crucial — watch for false breakouts or a shift in structure below the rising trendline.

BTCUSD Key Supply Zone Rejection – Bearish Target Mapped BTCUSD Key Supply Zone Rejection – Bearish Target Mapped (Educational Breakdown)
⸻
🧠 Technical Analysis (1H Chart):
• Range Structure: BTCUSD is currently trading within a well-defined consolidation range between the Resistance Zone ($119,850–$120,591) and the Support Zone ($116,937).
• Volume Profile (VRVP): Volume is noticeably thick near the mid-range, suggesting accumulation/distribution behavior. Price is struggling to break above the value area high near $120K.
• Resistance Rejection: After testing the upper supply zone, price failed to sustain bullish momentum and is showing signs of exhaustion – a possible sign of institutional selling.
• Target Zone: If price rejects this resistance again, a strong move toward the target level of $117,260 is expected. This aligns with:
• Mid-range liquidity sweep
• Low-volume node (LVN) below current price
• Fair Value Gap fill near $117,200–$116,900
⸻
🧩 Key Concepts Highlighted:
• Support & Resistance Mapping
• Volume Profile Readings
• Institutional Order Flow Bias
• Target Projection using Smart Money Concepts
⸻
⚠ Educational Insight:
This setup is a perfect example of how to combine Volume Profile + Price Action to identify liquidity traps and smart entries. Always wait for confirmation near key zones — not every level breaks!
⸻
✅ Trade Plan (Not Financial Advice):
• Watch for bearish engulfing/rejection wick at resistance
• Short entry below $119,000 with SL above $120,600
• Target: $117,260 / Final TP: $116,937 zone

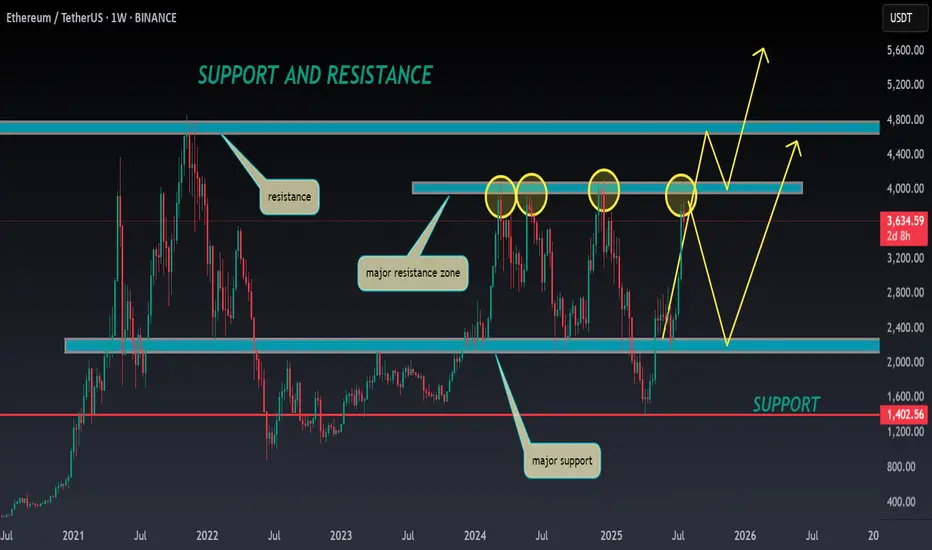
ETH ANALYSIS🔮 #ETH Analysis 🚀🚀
💲💲 #ETH is trading between support and resistance area. There is a potential rejection again from its resistance zone and pullback from support zone. If #ETH breaks the major resistance zone then we would see a bullish move
💸Current Price -- $3634
⁉️ What to do?
- We have marked crucial levels in the chart . We can trade according to the chart and make some profits. 🚀💸
#ETH #Cryptocurrency #DYOR
GBPUSD Idea – Demand Zones & Potential Reversal Play🧠 MJTrading:
After a steady downtrend, GBPUSD is now approaching a strong 4H demand zone (Support 1), where we previously saw explosive bullish reactions.
Price is also extended from both EMAs, showing potential for a technical pullback or full reversal.
💡Scenarios to consider:
🔹 If Support 1 holds → we may see a bounce toward 1.3500+
🔹 If broken → Support 2 & 3 offer deeper liquidity and high-probability demand zones
👀 Watch for:
Bullish reversal candles (engulfing / hammer)
Bullish divergence on lower timeframes
Volume spikes on reaction
⚠️ Invalidation:
If Support 3 breaks with strong momentum, we might enter a bearish continuation phase.
#GBPUSD #Forex #ChartDesigner #SmartMoney #PriceAction #MJTrading #ForexSetup #TrendReversal #SupportZones

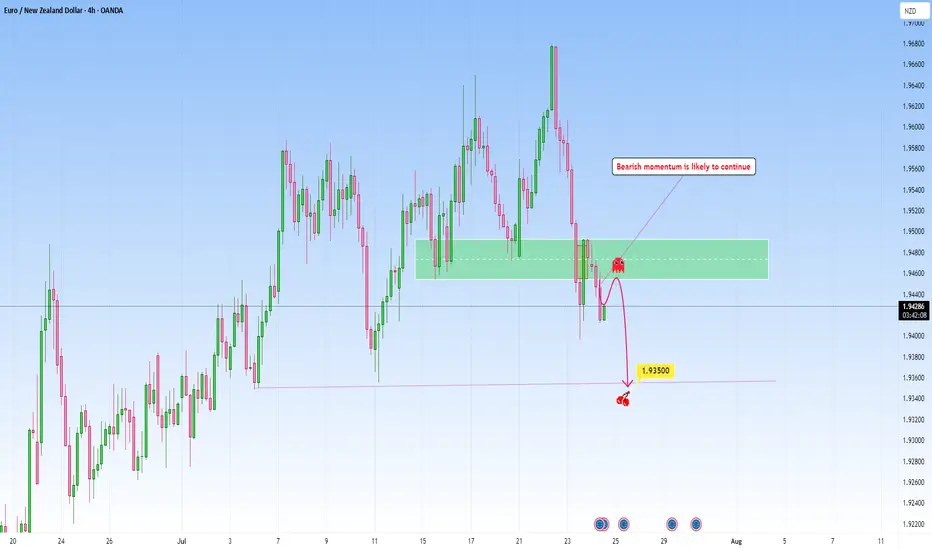
EURNZD Continuation setup following recent bearish momentumThe market has recently pushed down with momentum.
Price attempted a timid "echo bounce" back into the broken support but was rejected, confirming this area now serves as area for bearish re-entries.
From what I can tell, we're entering the next leg of what I call the “Gravity Spiral Phase”, where sellers take over after taking a clear zone. Each wave down is not just a move, but a continuation of momentum migration into new bearish move.
Target: 1.93500
This level marks the next gravity anchor, a zone where price memory may attempt to stabilize, but only temporarily.
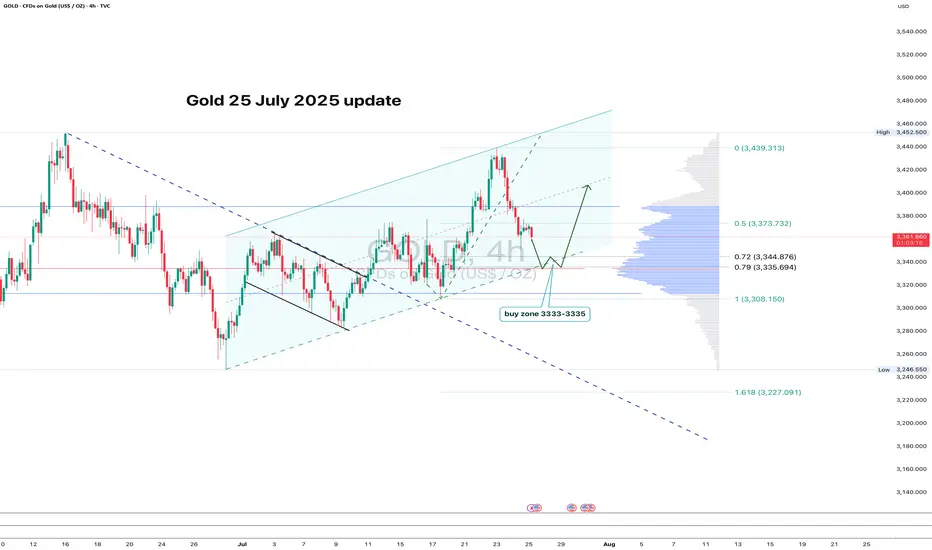
GOLD: clean pullback - now let’s see if support holdsGold continues to trade within an ascending channel on the 4H chart. After a local high, the price pulled back and is now approaching the key zone at 3333–3335. This area lines up with the 0.79 Fib retracement, the lower channel boundary, and a major volume cluster — a classic confluence zone.
If buyers show up here and we get a bullish reversal candle, this becomes a valid long setup with a tight stop just below the level. First target is 3373 (0.5 Fib), followed by a potential retest of the high near 3439.
The structure remains intact, the pullback is orderly, and volume supports the move. As long as the channel holds - the bias stays bullish.
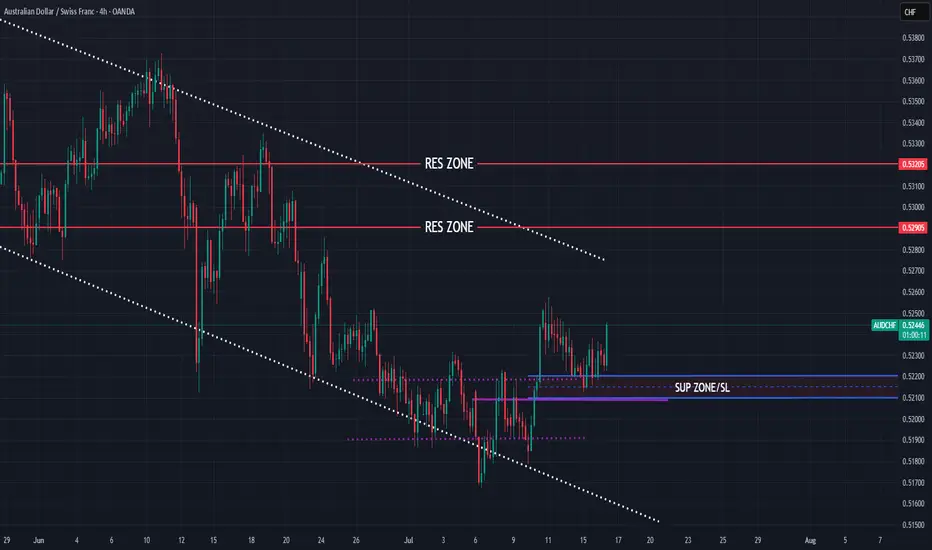
AUDCHF expecting bullish contianution
OANDA:AUDCHF interesting structure, trend based analysis, here exepcting bullish continuation.
SUP zone: 0.52200
RES zone: 0.52900, 0.53200
Welcome Back! Gold Trading Strategy & Key Zones to WatchIn this week’s welcome back video, I’m breaking down my updated approach to XAU/USD and how I plan to tackle the Gold markets in the coming days. After taking a short break, I’m back with fresh eyes and refined focus.
We’ll review current market structure, identify key liquidity zones, and outline the scenarios I’m watching for potential entries. Whether you’re day trading or swing trading gold, this breakdown will help you frame your week with clarity and confidence.
📌 Covered in this video:
My refreshed trading mindset after a break
Key support/resistance and liquidity zones
Market structure insights and setup conditions
What I’ll personally avoid this week
The “trap zones” that might catch retail traders off guard
🧠 Let’s focus on process over profits — welcome back, and let’s get to work.

BTC/USD 4H Chart Review📊 Technical Structure (Symmetrical Triangle)
Formation: The symmetrical triangle (orange lines) remains intact—price continues to move within it.
Approaching the apex: The closer to the intersection of the triangle's arms, the greater the probability of a breakout. The current candle is testing the upper boundary of the formation (around $119,300), but has not yet broken it.
Direction: The formation is neutral, but tension is increasing. A breakout of either line (the upper boundary ≈$119,500 or the lower boundary ≈$117,700) could trigger a dynamic move with a range of around $3,000 (the height of the triangle at its widest point).
🧱 Support and Resistance Levels (Red and Green Lines)
Type Level (USD) Description
Resistance 123205 All-Time High – Possible Target After an Upward Breakout
Resistance 120556 Local Resistance – Triangle Breakout Range
Resistance 119200–119300 Currently Tested Level
Support 117752 Lower Triangle Boundary – Critical Defense Line
Support 115764 Next Local Support
📈 Technical Indicators
🔵 RSI (Relative Strength Index)
Currently: ~55 – indicates a neutral situation, having broken down from the overbought level (~74).
Indicates that the market has temporarily cooled down after a previous impulse. There is still room for further upward movement without exceeding 70.
🔵 MACD
The MACD and signal lines are approaching a crossover – if the MACD crosses the signal line upward, it could be a bullish signal.
The histogram is slightly positive – indicating weak but growing bullish momentum.
📊 Volume
Slightly increasing in the last candles – no confirmation of a strong breakout yet, but upward pressure is building.
🧠 Interpretation
Scenario Technical Conditions Movement Objective
🔼 Upward Breakout
Candlestick close above $119,500 USD 122,000–$123,200 USD
🔽 Downward Breakout
Close below 117,750 and confirmed by volume at 115,700, then 114,000 USD
🔄 Consolidation
Inconclusive, continued sideways movement
Between $117,700 and $119,500 USD
✅ Summary
Bitcoin is still in a neutral symmetrical triangle formation but is approaching a turning point.
The RSI has broken out of the overbought range, and the MACD is signaling a potential upside breakout.
Volume confirmation is still lacking, but technical conditions favor the bulls – if it manages to break above 119,500 and hold above, a move towards 122,000–123,000 USD can be expected.
In the event of a rejection, maintaining 117750 will be key; breaking it opens the way to 115700 and below.

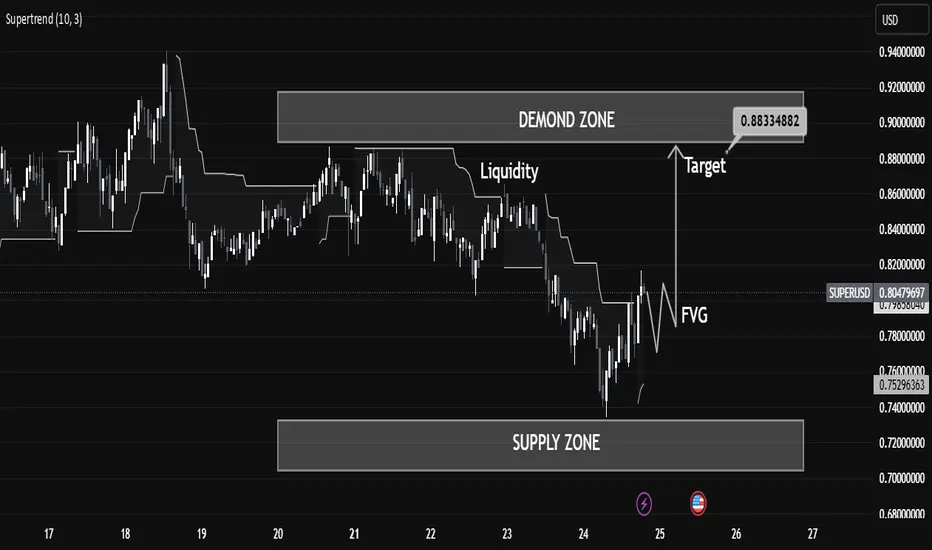
Smart Money Trap Identified! FVG + Liquidity Grab“Smart Money Trap Identified! FVG + Liquidity Grab Before Super USD Skyrockets to Target Zone ”
⸻
🧠 Technical Breakdown:
1. Liquidity Sweep (Manipulation Phase):
We see price aggressively sweep local liquidity around July 23, likely triggering stop-losses of early longs or breakout traders. This is a classic Smart Money trap, where big players induce volatility to grab liquidity before a move in the real direction.
2. Fair Value Gap (FVG):
A clear bullish FVG (imbalance) has formed post-liquidity grab, suggesting a potential institutional entry zone. This imbalance typically acts as a magnet for price and an entry point for Smart Money after manipulation.
3. Demand Zone & Target Projection:
• Price is now reacting from a well-defined Demand Zone, with clear rejection wicks indicating aggressive buying interest.
• The target zone (0.88334882) sits just below a previous supply zone, aligning with a potential distribution area where Smart Money may begin profit-taking.
4. Supertrend Indicator:
The supertrend has flipped bullish, confirming potential momentum shift, supporting the bullish bias as long as the FVG holds.
5. Confluence Factors:
✅ Liquidity Grab
✅ FVG Reaction
✅ Demand Zone Bounce
✅ Supertrend Confirmation
✅ High-Risk/High-Reward Entry Before Smart Money Run
⸻
🎯 Trade Idea (For Educational Purpose Only):
• Entry: On pullback into the FVG zone
• Stop Loss: Below the recent swing low or Demand Zone
• Target: 0.8833 (inside the upper supply/demand imbalance)
⸻
🧠 Educational Note:
This chart beautifully showcases how market makers operate — manipulate liquidity, fill imbalances, and target inefficiencies. Always think like Smart Money, not retail traders.
SHIB/USDT: A Fight for Recovery?SHIB/USDT is currently trading around $0.00001363, marking an approximately 11.5% drop over the past 24 hours. However, it's crucial to note that the price is successfully holding above the key support level of $0.00001373.
Recently, we've witnessed a significant increase in the activity of so-called "large holders" or "whales" concerning SHIB/USDT. Their netflow has reached a two-month high, signaling heightened interest. In the past 24 hours, addresses holding at least 0.1% of the total SHIB supply accumulated an impressive 4.66 trillion SHIB, representing an investment of a staggering $63.7 million. These major players clearly believe in the potential for a price recovery.
What's Next? Scenarios for SHIB/USDT
Bullish Scenario (Uptrend):
Should SHIB/USDT successfully bounce off the support level at $0.00001317, it would likely pave the way for further price appreciation. It could potentially reach $0.00001423. If this level solidifies as new support, it would mark a full recovery of today's losses and could initiate a new uptrend, provided that broader market conditions remain favorable. The investment by the whales would be crucial in this scenario.
Bearish Scenario (Downtrend):
However, if SHIB/USDT fails to hold above the support of $0.00001317 and falls below this level (likely due to profit-taking by other market participants), the popular "meme coin" could slip to $0.00001188. Such a development would invalidate the bullish thesis and further reduce investor confidence. The next few days will be critical for SHIB to demonstrate whether it can
maintain its current support levels.
#forex #SHIB #USDT #SwingTrade

XAUUSD Price Analysis — Support Zone Reaction & Potential XAUUSD Price Analysis — Support Zone Reaction & Potential Bullish Reversal
🔍 Market Structure Overview
The chart shows a clear bullish market structure characterized by multiple Breaks of Structure (BOS) and a strong upward trend that recently corrected into a key support zone around 3360–3340.
This correction phase may be coming to an end as price reaches a high-probability demand area, with bullish reaction forming at the support level.
🧠 Smart Money Concept (SMC) Breakdown
📌 Break of Structure (BOS) confirms institutional activity and directional bias.
🔄 After a strong uptrend and BOS on July 22–23, a healthy retracement has taken place toward a major demand zone.
The support level is aligning with past consolidation and previous BOS zones, providing confluence for a bullish bounce.
📊 Technical Confluence
✅ Volume Profile (VRVP) shows strong buyer activity at current levels.
✅ The price is reacting within the support box with a small bullish candle, indicating potential accumulation.
✅ A clean liquidity sweep may have occurred just below minor lows, shaking out weak hands before a move upward.
🎯 Forecast
If price holds above the 3360 level, and bullish confirmation continues (e.g., break above minor lower highs), we can expect:
Short-term target: 3400
Major target: 3440 (marked resistance zone)
⚠️ Invalidation: A clean break and close below 3340 may lead to deeper correction or change in structure.
📘 Educational Title Suggestion
"Smart Money Reaction at Demand: XAUUSD Poised for Reversal from Key Support"
