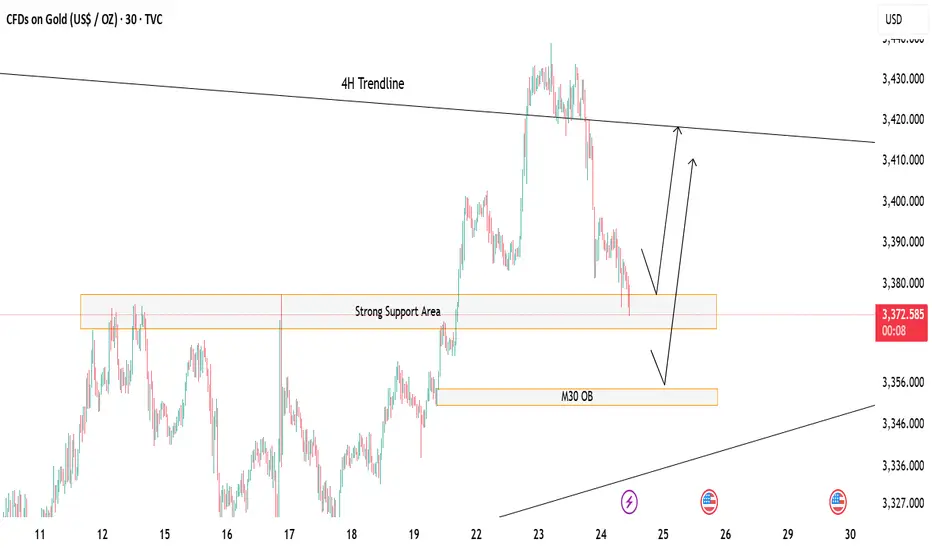
Gold at Key Decision Zone – Bounce or Break?Price is currently hovering above a strong support zone, showing potential for a short-term bounce. 🔁
If this zone holds, we could see a bullish reaction toward the 4H trendline resistance above. 📈
However, a break below may lead price to drop and tap into the M30 Order Block (OB) for a deeper mitigation before any move up. ⚠️
If this happen we could look for potential sell till the OB test otherwise the buying opportunity should focused more
🎯 Watch these key zones carefully – market is at a decision point!
Both buy and sell setups possible depending on how price reacts at these levels.
Supportandresistancezones
XRP/USD H1 Educational Market Analysis – Support-Based XRP/USD H1 Educational Market Analysis – Support-Based Long Opportunity
🔍 Structure Overview:
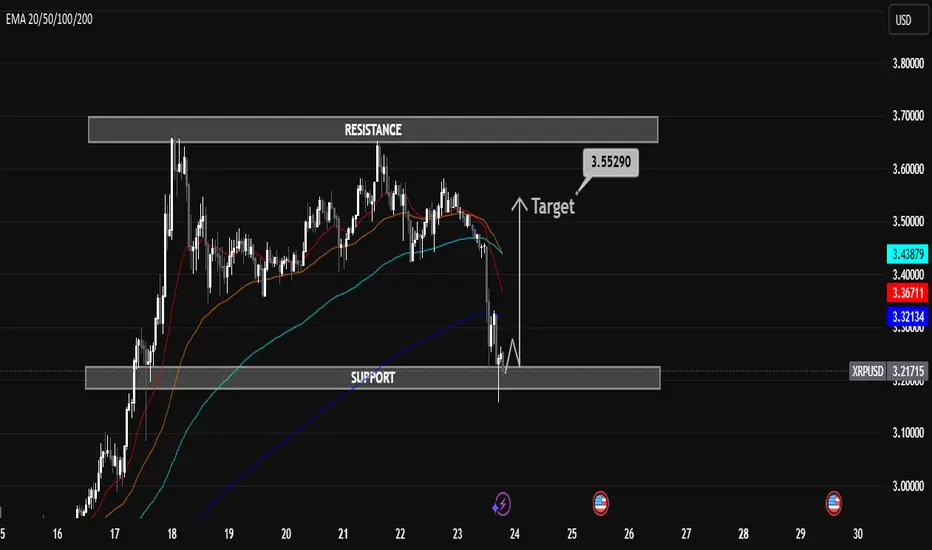
• Support Zone: $3.21 – $3.23
This level has acted as a strong liquidity pool and base for past bullish moves. Price has tapped into it, showing signs of potential demand returning.
• Resistance Zone: $3.65 – $3.70
Acts as a key supply zone, where previous bullish attempts failed. Targeting this area after a rebound is technically sound if structure confirms.
⸻
🔄 Price Action Insights (H1):
• Price broke down through EMAs (20/50/100/200), confirming short-term bearish pressure.
• A rejection wick from support hints at possible absorption of selling pressure.
• If price forms a higher low structure above $3.25 and reclaims EMAs, a potential bullish reversal may unfold.
⸻
🧠 Educational Note:
• H1 charts are ideal for intraday strategies, and this structure provides a clear example of:
• Support-resistance dynamics
• The use of EMAs as trend confirmation tools
• Reversal vs. continuation setups
⸻
🎯 Intraday Bullish Scenario:
• If price holds above $3.21 and breaks above the $3.40 (EMA cluster), bulls may push toward the $3.55290 target.
• This level aligns with the mid-range of the resistance zone, offering scalp-to-swing potential.
⸻
🚫 Bearish Risk:
• Failure to hold $3.21 could lead to a deeper correction toward $3.10 or even $3.00.
• Confirmation of bearish continuation would be a lower high rejection from EMAs without reclaiming them.
⸻
📌 Summary:
On the H1 chart, XRP is at a critical support. Watch for a clean bounce and break above EMAs for a move toward $3.55. However, losing $3.21 could attract further downside. Use price action confirmation before entries.
TONUSDT Technical Analysis – Bearish Shift with Clean TargetMarket Context:
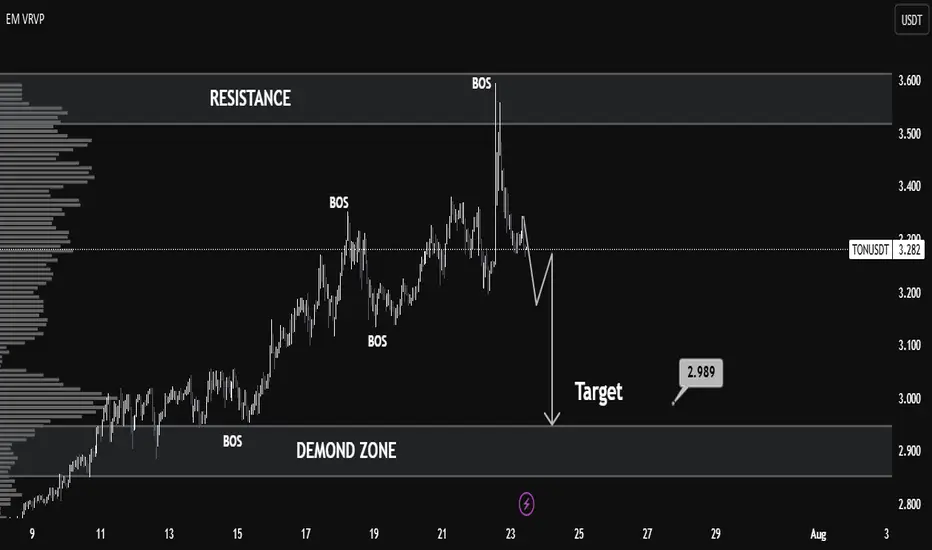
TONUSDT recently showed strong bullish momentum, breaking multiple structure levels (noted as BOS – Break of Structure), indicating a clear uptrend. However, the most recent price action reveals a sharp rejection from the resistance zone around 3.55–3.60, marking a significant trend reversal.
Key Levels:
Resistance: 3.55 – 3.60
Price tested this zone and was strongly rejected, forming a potential top.
Demand Zone: 2.88 – 2.99
This zone provided previous accumulation and serves as a probable liquidity area and downside target.
Target: 2.989
The chart marks this as the near-term bearish objective, aligning with the volume node and prior demand.
Technical Signals:
Multiple BOS (Break of Structure):
Confirmed bullish structure earlier, but the latest BOS downward indicates a possible trend reversal.
Volume Profile (VRVP):
Shows high volume nodes around 3.00, suggesting strong market interest at lower levels — acting as a magnet for price.
Bearish Market Structure:
After the peak, the lower highs and lower lows pattern reflects short-term bearish dominance.
Liquidity Grab & Selloff:
The spike above resistance likely induced liquidity before a rapid selloff — classic distribution behavior.
Outlook:
If the market fails to reclaim levels above 3.35, a bearish continuation toward 2.989 remains likely.
The demand zone (2.88–2.99) is a critical area where buyers may re-enter — look for reversal signals here.
Conclusion:
TONUSDT has shifted from bullish to bearish in the short term. A clean rejection from resistance and strong structural breaks suggest a move toward the 2.989 demand zone. Traders should watch for confirmation of support or continuation upon reaching this level.
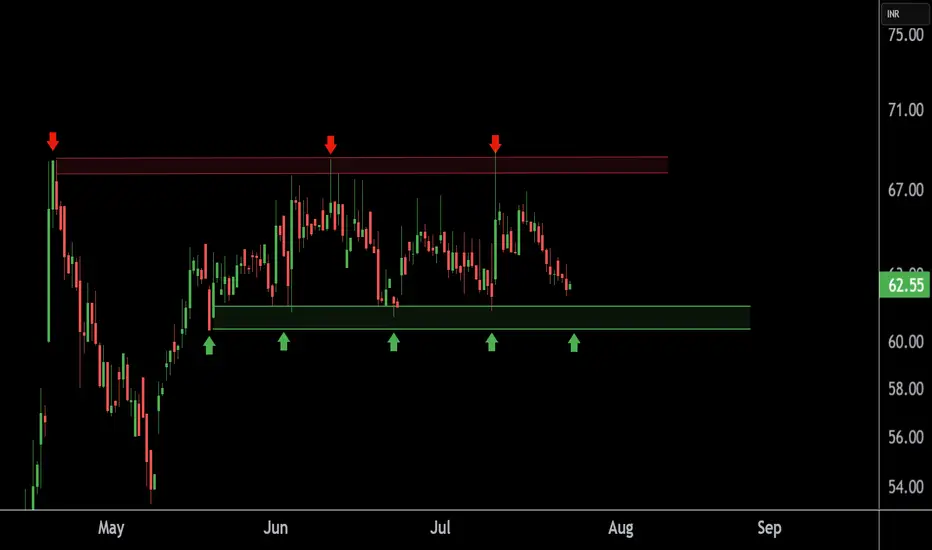
TEXMOPIPE Chart Speaks Strength – Buying Opportunity Near SupporThis is the 4 hour chart of TEXMOPIPES.
TEXMOPIPES having a good support zone near at 60 level.
If this level is sustain , then we may see higher prices in TEXMOPIPES.
Thank You !!
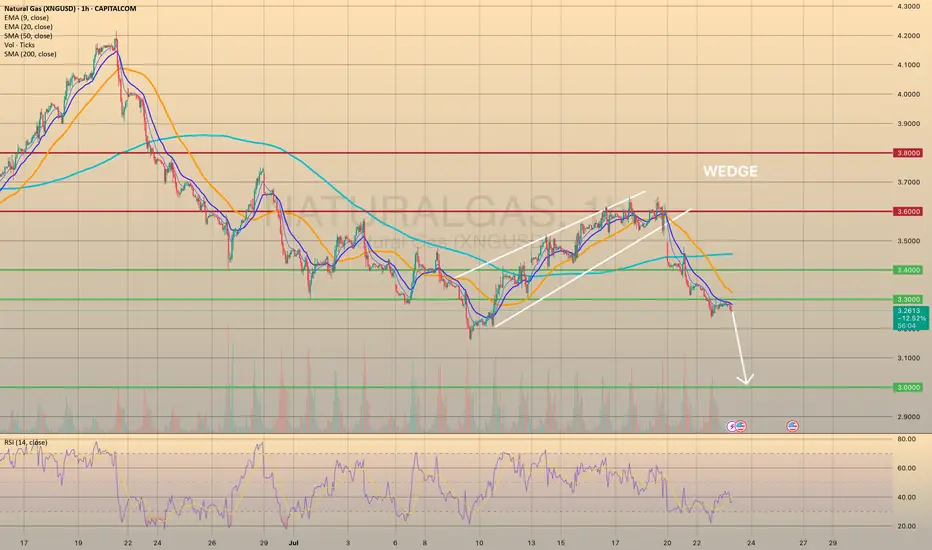
XNGUSD PULLED BACK FROM 3.3000 RESISTANCE LEVEL. WHERE TO GO NEXXNGUSD PULLED BACK FROM 3.3000 RESISTANCE LEVEL. WHERE TO GO NEXT?
This Monday natural gas prices have successfully broken down bearish wedge formation. As we may observe, the price went down through all major support levels, establishing a new short-term bearish trend. Recently the price broke through the 3.3000 and successfully retested it. It is crucial, due to this level is the last mid-term major support before the 3.000.
Additionally, the weather in the vast area U.S. is supposed to be milder at the end of July - beginning of August, which would curb nat-gas demand from electricity providers for air conditioning usage. To sum up, the decline towards 3.000 level is expected.
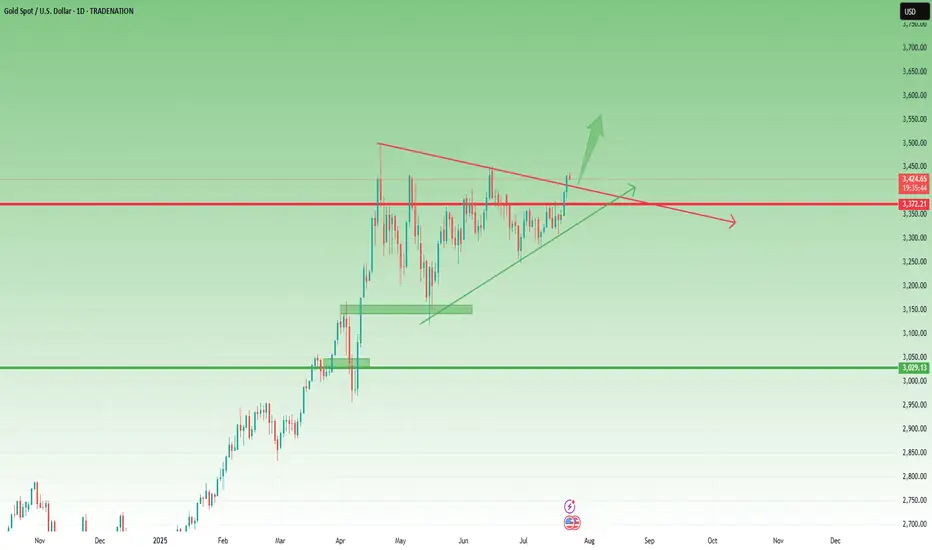
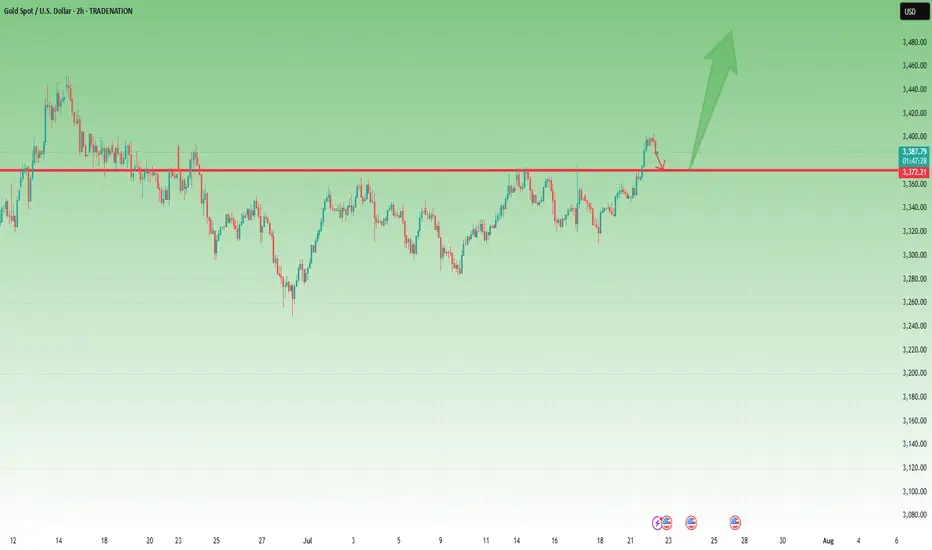
Gold Update – Strong Breaks, Strong BullsYesterday, after the break of the key 3370 resistance, Gold corrected slightly toward 3383, then consolidated briefly in that area. From there, it launched into a strong new leg up, closing the day once more near the highs, around 3430.
📌 What’s important here is that the price did not even come back to retest the broken resistance — now turned support. Combined with the strong daily close near the high of the range, this gives us a clear message:
➡️ Bulls are in full control.
________________________________________
🔍 This Week – Three Key Breaks
So far this week, Gold has delivered three major breakouts:
• ✅ A clean breakout from the box consolidation that kept price stuck and indecisive last week
• ✅ A decisive break above the 3400 psychological figure
• ✅ A breakout above the symmetrical triangle resistance, which had been forming since late April
Each of these is significant on its own. Together, they suggest a shift toward a more aggressive bullish scenario.
________________________________________
🔮 What’s Next?
All these breakouts point to the potential for more gains ahead.
In fact, the next logical step could be an attempt to mark a new All-Time High.
My view remains the same:
Buying dips remains the strategy of choice, with a focus on the 3400 zone as a key support area, and a swing target around 3500.
Disclosure: I am part of TradeNation's Influencer program and receive a monthly fee for using their TradingView charts in my analyses and educational articles.
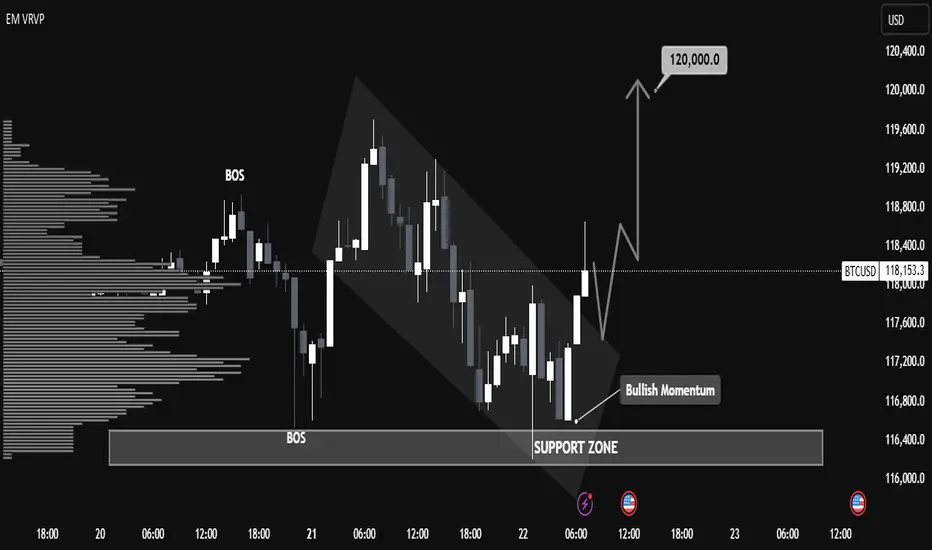
"BTC/USD Breakout Strategy: Identifying Bullish Momentum BTC/USD Technical Analysis – July 22, 2025
📈 Market Structure Overview:
The chart illustrates a recent Break of Structure (BOS) both to the upside and downside, indicating volatility and a shift in market sentiment. The price action formed a descending channel, followed by a breakout with strong bullish candles, suggesting a momentum reversal.
🧱 Support Zone (Demand Area):
Key Level: $116,400 – $116,900
This zone has acted as a strong demand level, with clear evidence of buying pressure pushing BTC higher after testing this area. The volume profile (VRVP) supports this, showing heightened trading activity at this price.
🔄 Bullish Breakout Confirmation:
A bullish breakout from the descending channel occurred just above the support zone, aligning with the label "Bullish Momentum".
The breakout candle has closed above minor resistance, which increases the probability of a trend reversal.
📍 Price Target:
The projection points toward $120,000, aligning with previous resistance and psychological round-number resistance.
This target is highlighted by an expected bullish leg after a possible retest of the breakout zone around $117,500 – $117,800.
🧭 Key Levels to Watch:
Support: $116,400 – $116,900
Retest Zone (Buy Opportunity): $117,500 – $117,800
Immediate Resistance: $118,400
Major Resistance / Target: $120,000
📊 Summary:
BTC/USD has shown a bullish reversal signal from a well-respected support zone after a descending correction phase. The current price structure, volume buildup, and breakout momentum suggest a high probability of continued upside movement toward the $120,000 mark. A successful retest of the breakout zone would provide a strategic entry for long positions with tight risk management.
Gold - Above 3370 Is Bullish Territory – But 3360 Must Hold📆 What happened yesterday?
After more than a week of frustrating, sideways price action, Gold finally broke out above the key 3370 resistance zone.
The breakout was clean and impulsive, with TRADENATION:XAUUSD pushing to an intraday high around 3400.
Following that move, price printed a small double top near the high and began a modest correction — perfectly normal after such a breakout. At the time of writing, Gold trades at 3385, still holding above former resistance.
📈 Why this breakout matters:
The daily close at 3396 came in strong and near the top, leaving behind a clear Marubozu candle
This kind of price action signals conviction and momentum
The breakout confirms what I’ve been anticipating for days — the range is resolved, and the market is choosing the bullish path
🎯 What to expect next:
If price stabilizes above 3400, the road to 3450 opens — which is the target mentioned in my previous analyses
That area represents the next major resistance and likely magnet for price if bulls stay in control
🧭 Trading Plan:
For me, the plan is now simple:
✅ Buy the dips — especially on a potential retest of the 3370–3375 broken resistance, which now turns into support
❌ Negation comes only with a daily close below 3360, which would invalidate this breakout and raise questions
📌 Conclusion:
The breakout has finally come. After days of coiling, Gold chose the upside.
Momentum is building, structure is clean, and bulls are back in control — unless 3360 fails.
Until then, I remain bullish, looking to buy dips into strength. 🚀
Disclosure: I am part of TradeNation's Influencer program and receive a monthly fee for using their TradingView charts in my analyses and educational articles.
GBPCAD new bearish expecting
OANDA:GBPCAD last analysis we are be accurate (attached), currently continuation type, RAISING WEDGE pattern visible, we are have strong bearish push, and still expectations are bearish.
SUP zone: 1.85000
RES zone: 1.83000, 1.82200

ETHUSD FORMED A BEARISH WEDGE. READY TO REVERSE?ETHUSD FORMED A BEARISH WEDGE. READY TO REVERSE?📉
ETHUSD has been moving bullish since July 9, forming the bearish wedge, supported by the bearish divergence. Today the price started to breakdown this pattern.
A bearish wedge is a bearish reversal pattern in an uptrend, where the price forms higher highs and higher lows within converging upward trendlines, signaling weakening bullish momentum and a potential downward reversal. To trade, identify the wedge with declining volume and confirm with RSI or divergence. Sell or short on a breakdown below the lower trendline with a volume spike. Set a stop-loss above the recent high or upper trendline. Target the wedge’s height projected downward from the breakdown or the next support level with a 1:2 risk-reward ratio.
The decline towards local support of 3,500.00 is highly expected. If the bearish impulse gets strong enough, we may see the decline towards 3,000.00 support level.

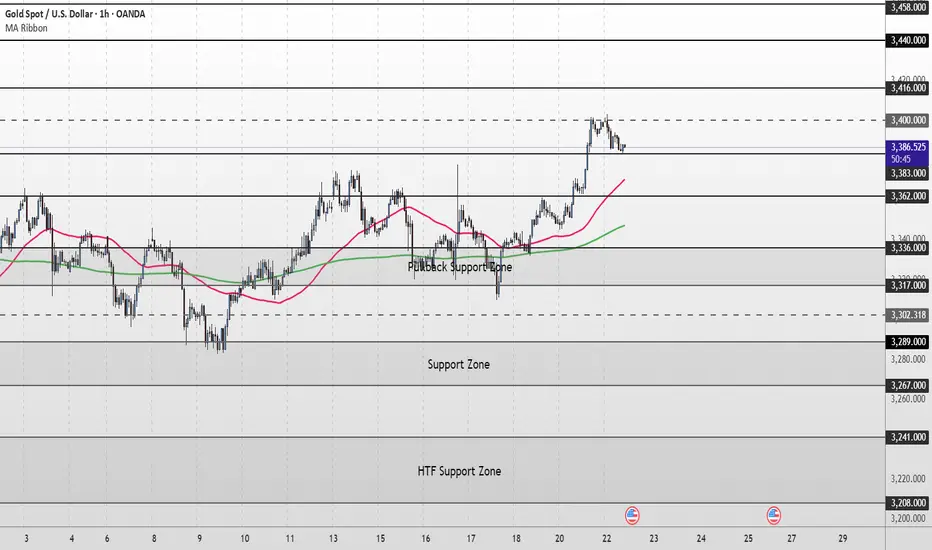
XAU/USD Intraday Plan | Support & Resistance to WatchGold broke above the 3,362 resistance and extended its rally into the 3,400 resistance zone, currently trading around 3,386. Price remains comfortably above both the 50MA and 200MA, which are sloping upward and acting as dynamic support—keeping short‑term structure bullish.
A confirmed break and hold above 3,400 would open the path toward the next upside targets at 3,416 and 3,440, with 3,458 as a higher‑timeframe extension if momentum continues.
If price fails to sustain above 3,383–3,400 and begins to fade, watch the initial pullback toward 3,362.
A deeper move below that would shift focus to the Pullback Support Zone.
Failure to hold there could expose price to the Support Zone and potentially the HTF Support Zone if bearish pressure builds.
📌 Key Levels to Watch
Resistance:
3,383 ‣ 3,400 ‣ 3,416 ‣ 3,440
Support:
3,362 ‣ 3,336 ‣ 3,317 ‣ 3,302 ‣ 3,289
🔎 Fundamental Focus –
📌 Fed Chair Powell Speaks – key event that can move USD and gold sharply.
XAUUSD HAS FORMED BEARISH ENGULFING PATTERN. WHAT'S NEXT?XAUUSD HAS FORMED BEARISH ENGULFING PATTERN. WHAT'S NEXT?
XAUUSD has been trading bullish within the last day. The price touched the resistance level of 3,400.00. As a result, the bearish engulfing pattern has formed on 4-h chart.
An engulfing pattern is a two-candle reversal pattern where a smaller candle is followed by a larger one that completely covers it, indicating a potential shift in the trend. A bullish engulfing pattern, which signals a buy signal, occurs in a downtrend when a small red candle is followed by a larger green candle. A bearish engulfing pattern, which signals a sell signal, occurs in an uptrend when a small green candle is followed by a larger red candle. To trade, identify the pattern in a clear trend with high trading volume on the engulfing candle. Enter a buy position (for a bullish engulfing pattern) or a sell/short position (for a bearish engulfing pattern) after the engulfing candle closes, confirming a rebound from support or resistance. Set a stop-loss below the low of the bullish engulfing candle or above the high of the bearish engulfing candle. Aim for the next support or resistance level or aim for a 1:2 risk-reward ratio.
So, here I expect the price to move down towards local support of 3,365.00, where supposedly, the price will start to consolidate.

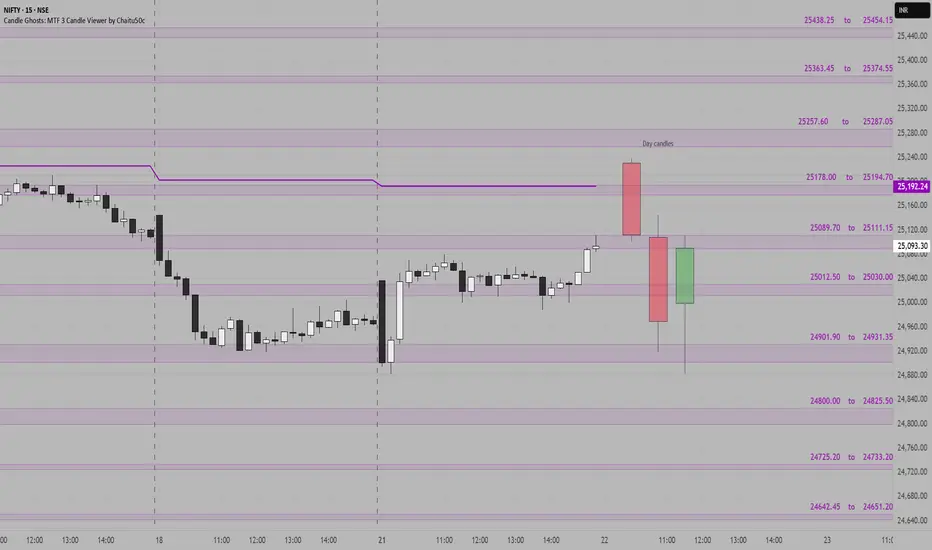
NIFTY SUPPORT & RESISTANCE ZONES FOR 22-07-2025Nifty Support & Resistance Zones for Tomorrow 22-07-2025
Based on price cluster analysis and recent market structure, the following key support and resistance levels have been identified for the upcoming session:
Resistance Zones:
25438.25 – 25454.15
25363.45 – 25374.55
25257.60 – 25287.05
25178.00 – 25194.70
25089.70 – 25111.15
Support Zones:
25012.50 – 25030.00
24901.90 – 24931.35
24800.00 – 24825.50
24725.20 – 24733.20
24642.45 – 24651.20
These levels are derived from high-probability zones where price has shown repeated interaction in the recent past. Watch how Nifty reacts at these zones for potential breakout, reversal, or pullback setups.
$CUSDT Breakout: Eyes on 94% Upside.BITGET:CUSDT is showing signs of strength again.
After a healthy pullback, it held support and broke out of the falling wedge.
This move could kickstart the next leg up, with a potential target near $0.53882, almost 94% from here.
Keep it on your radar if momentum picks up.
DYOR, NFA

July 21, Forex Outlook : Don’t Miss These High-Reward Setups!Welcome back, traders!
In today’s video, we’ll be conducting a Forex Weekly Outlook, analyzing multiple currency pairs from a top-down perspective—starting from the higher timeframes and working our way down to the lower timeframes.
Pairs to focus on this Week:
EURUSD
USDJPY
AUDJPY
CADJPY
EURJPY
GBPCHF
USDCHF
NZDCHF
EURNZD
Our focus will be on identifying high-probability price action scenarios using clear market structure, institutional order flow, and key confirmation levels. This detailed breakdown is designed to give you a strategic edge and help you navigate this week’s trading opportunities with confidence.
📊 What to Expect in This Video:
1. Higher timeframe trend analysis
2. Key zones of interest and potential setups
3. High-precision confirmations on lower timeframes
4. Institutional insight into where price is likely to go next
Stay tuned, take notes, and be sure to like, comment, and subscribe so you don’t miss future trading insights!
Have a great week ahead, God bless you!
The Architect 🏛️📉

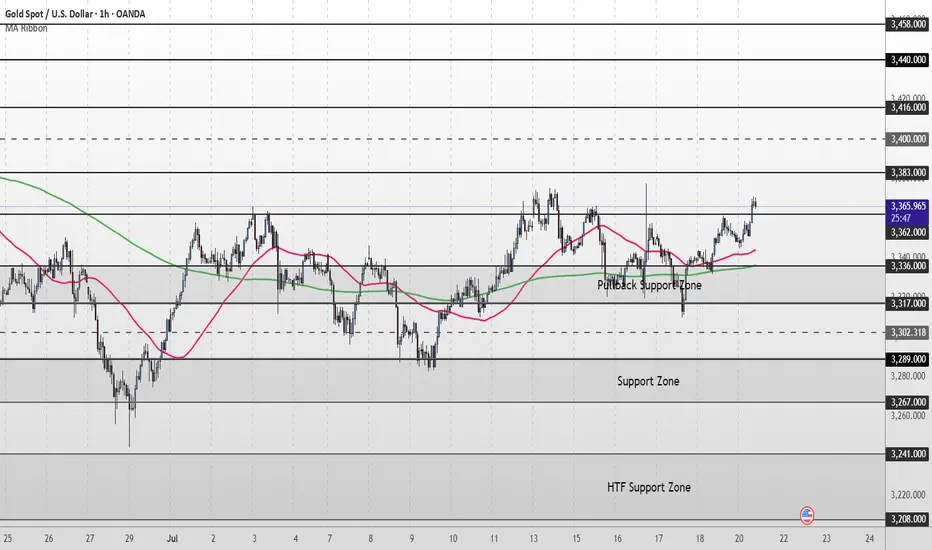
XAU/USD Intraday Plan | Support & Resistance to WatchGold has extended its recovery and is now trading around 3,366, pushing into the next resistance cluster.
Price is holding firmly above both the 50MA and 200MA, which are now flattening and beginning to turn upward, acting as dynamic support.
A confirmed break and hold above 3,362 would open the path toward the next upside targets at 3,383 and 3,400, with 3,416 and 3,440 as higher‑timeframe resistance levels if momentum continues.
If price rejects the 3,362 resistance zone and fades lower, watch the Pullback Support Zone (3,336–3,317) closely. A break back below that area would shift focus to the broader Support Zone (3,289-3,267).
Failure to hold there could expose price to the deeper HTF Support Zone.
📌 Key Levels to Watch
Resistance:
3,362 ‣ 3,383 ‣ 3,400 ‣ 3,416
Support:
3,336 ‣ 3,317 ‣ 3,302 ‣ 3,289 ‣ 3,267
🔎 Fundamental Focus – Week of July 21–25
📌 Tuesday, Jul 22
Fed Chair Powell Speaks
📌 Thursday, Jul 24
Unemployment Claims
Flash Manufacturing PMI & Flash Services PMI
Ethereum at Crucial Resistance – Will the Bulls Hold or Fade?Ethereum at Crucial Resistance – Will the Bulls Hold or Fade?”
Ethereum is currently trading near a key resistance zone around $3,800, as marked on the chart. After a strong bullish rally with clear Break of Structures (BOS) along the way, ETH has now reached an extended point where price may face selling pressure.
The Bollinger Bands are stretched, showing overextension, and the marked arrow suggests a possible correction or pullback from this level. A retest of previous support zones (~$3,400–$3,200) could be expected if the resistance holds.
⸻
Key Levels:
• 🔼 Resistance: ~$3,800
• 🔽 Support: ~$3,400 / ~$3,000
• 🔄 Price Action: Watching for rejection or breakout confirmation
This is a textbook case of price approaching a strong resistance level after a bullish wave, where caution and confirmation are key for the next move.

3-Year Euro Uptrend — An Absurdity Amid a Weak EconomyCMCMARKETS:EURUSD
The euro is climbing, hitting its highest levels since late 2021 near $1.18. This surge is driven by diverging central bank policies—with the ECB holding rates steady while the Fed leans dovish—amid global tensions that push gold higher and rattle markets, weakening the dollar even though the eurozone economy remains fragile.
📉 1️⃣ Dollar Weakness Takes Center Stage
Since its January 2025 peak, the U.S. Dollar Index (DXY) has fallen by over 11% 📉—one of its worst starts in decades, comparable to the slumps of 1986 and 1989. As inflation cools, markets are betting on Fed rate cuts, pulling U.S. Treasury yields lower. Coupled with monetary policy divergence and tariff drama, the dollar’s usual safe-haven appeal is fading, even amid ongoing geopolitical tensions.
📊 2️⃣ Fed–ECB Policy Divergence
While the ECB has signaled the possibility of one or two cuts this year, markets are pricing in a milder path. By contrast, the Fed is tilting dovish, with swaps markets expecting a rate cut in September and another by December 🗓️. This widening yield differential supports EUR/USD, even though eurozone growth remains soft.
⚖️ 3️⃣ Trump Tariff Risks and Sentiment Shift
Uncertainty around U.S. trade policy—especially the threat of renewed tariffs—has weighed more heavily on USD sentiment than on eurozone currencies. Markets view these tariffs as inflationary and damaging to U.S. growth prospects. Speculative positioning data confirms record bearish sentiment on the dollar, with funds underweight USD for the first time in 20 years 💼.
💶 4️⃣ Eurozone’s Fiscal Shift
Germany has begun spending and borrowing, marking a dramatic pivot from years of fiscal restraint. This has raised hopes for an investment-driven recovery across the eurozone. Meanwhile, ECB President Christine Lagarde is avoiding signaling aggressive cuts, stabilizing market expectations and maintaining a sense of monetary calm—for now 🛡️.
🛡️ 5️⃣ Safe-Haven Flows Shifting
Traditionally, geopolitical stress boosts the USD as a safe haven. This cycle is different: investors are increasingly turning to gold, the Swiss franc, and the yen as defensive assets, indirectly supporting the euro. In April, when Trump delayed tariff plans, safe-haven USD flows unwound further, fueling euro gains 💰.
⚠️ Risks Ahead for EUR/USD:
💔 Weak Eurozone Fundamentals:
The eurozone economy is not booming. The IMF projects just 0.9% growth for 2025, with Germany, France, and Italy struggling to regain momentum. The ECB’s Financial Stability Review flags worsening credit conditions, weak private investment, and deteriorating balance sheets, none of which support sustained euro appreciation 📉.
🚢 A Strong Euro Hurts Exports:
Eurozone exporters in machinery, chemicals, and autos are already facing squeezed margins from rising input costs and global protectionism. A stronger euro makes exports less competitive, shrinking the eurozone’s current account surplus, which dropped sharply from €50.9 billion in March to €19.8 billion in April, according to the ECB 📊.
⚡ Political Risks Looming:
Fragile coalitions in Germany, budget battles in France, and rising anti-EU sentiment in Italy and the Netherlands could swiftly unwind euro gains if tensions escalate. Should the ECB turn dovish to support a weakening labor market, the euro’s rally could reverse quickly 🗳️.
📈 7️⃣ Technical Picture: Overextension Warning
In addition to the macro drivers, EUR/USD is now technically overextended. The pair has already retraced exactly 78.6% of its major bearish trend that started in January 2021 and ended in September of that year. Ahead lies a strong resistance zone at 1.18000–1.20000, which will be difficult to break without a significant catalyst.
Notably, the daily chart shows bearish RSI divergence, indicating fading momentum beneath the surface of this rally. A pullback toward the 1.13000 level would not be surprising, even as near-term momentum remains strong. This technical setup calls for caution while the pair tests these critical levels.
📈 Technical Outlook: EUR/USD Showing Signs of Overextension
Beyond macroeconomic factors, EUR/USD is currently technically overextended. The pair has retraced exactly 78.6% of its major bearish trend that began in January 2021 and concluded in September the same year. It is now approaching the upper boundary of a 3-year ascending channel, facing a significant resistance zone between 1.18000 and 1.20000—a hurdle unlikely to be crossed without a strong catalyst.
Additionally, the weekly chart reveals a bearish RSI divergence, signaling that underlying momentum is weakening despite the recent rally. Given this, a pullback toward the 1.13000 level is plausible, even as short-term momentum remains robust. This technical setup advises caution as the pair navigates these critical resistance levels.

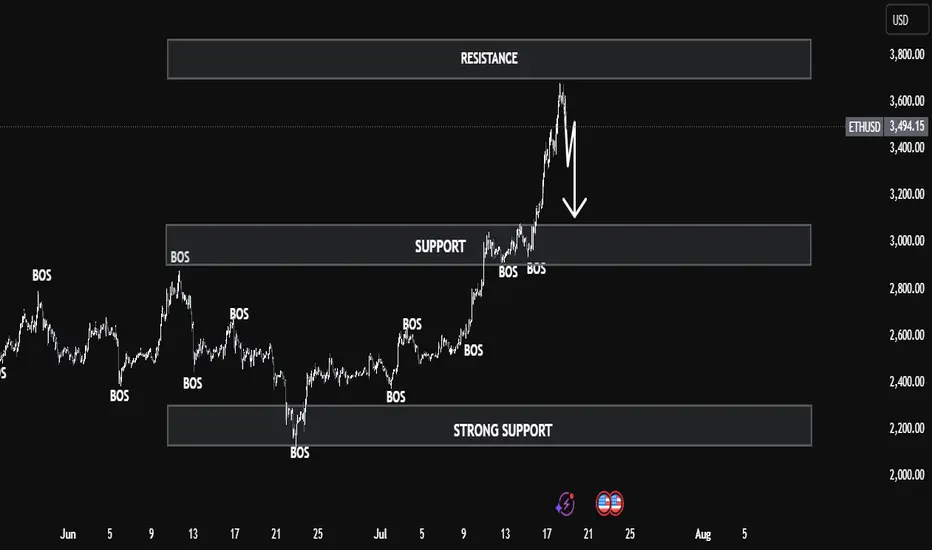
ETHUSD Smart Money Breakdown – Price Rejection from Premium ZoneEthereum has shown a strong impulsive rally after multiple Breaks of Structure (BOS) from early June, signaling a clear shift in market sentiment from bearish to bullish. Each BOS indicates that demand zones have been respected and liquidity has been efficiently used to fuel higher prices — a classic signature of institutional involvement.
🧠 Smart Money Insight
As price aggressively rallied into the resistance zone ($3,600–$3,800), the market entered a premium pricing area, where smart money typically offloads positions and hunts liquidity from late buyers. This area has historically been a high reaction zone — and as seen on the chart, ETH shows signs of buyer exhaustion, suggesting a possible short-term reversal.
🔁 Anticipated Market Behavior
A corrective move is likely from this resistance, and the first target for retracement lies in the support zone around $3,000–$3,200. This level aligns with:
Previous BOS retest area
Fair value imbalance fill
Mid-range equilibrium
If momentum continues downward, the next zone of interest will be the strong support region at $2,200–$2,400, which served as a major accumulation zone. That’s where large orders previously entered the market — and a strong reaction is expected again.
📊 Market Structure Summary:
BOS Confirmations: Validated bullish structure
Liquidity Grab: At resistance – potential sweep and reversal
Premium Zone Rejection: Smart money short opportunity
Discount Zone Targets: Support & strong support zones
✅ Conclusion
ETH is at a critical decision point. If price holds below resistance with continued bearish pressure, a retracement is not only healthy — it's expected. Traders should wait for confirmation of lower timeframe structure breaks before entering shorts, and target the $3,000 zone first, with eyes on $2,200 if momentum persists.
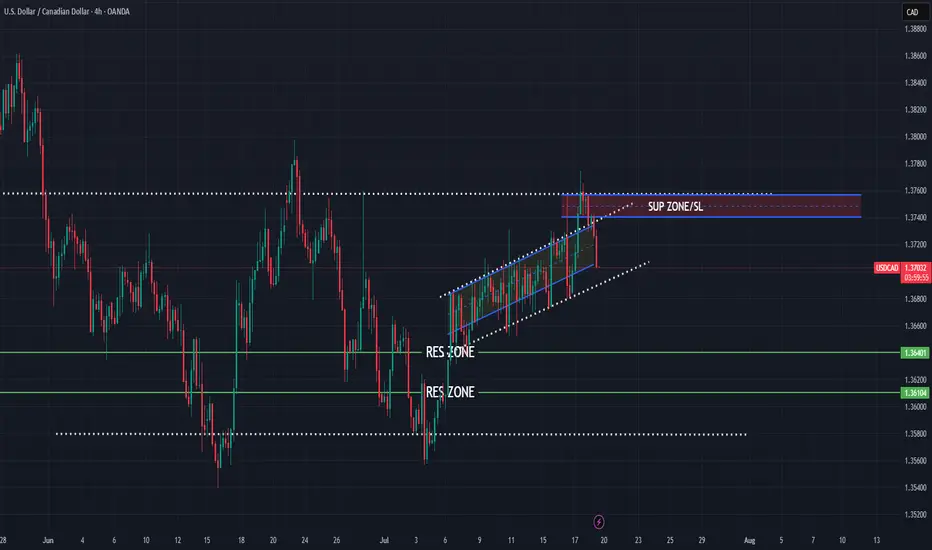
USDCAD bearish view
OANDA:USDCAD again on this pair, first analysis accurate, in new look having bearish view, price in PA moving, still we having nice structure, price is now come back in channel, looks like breaking first channel, which will take for confirmation and sign for bearish expectations.
SUP zone: 1.37400
RES zone: 1.36400, 1.36100
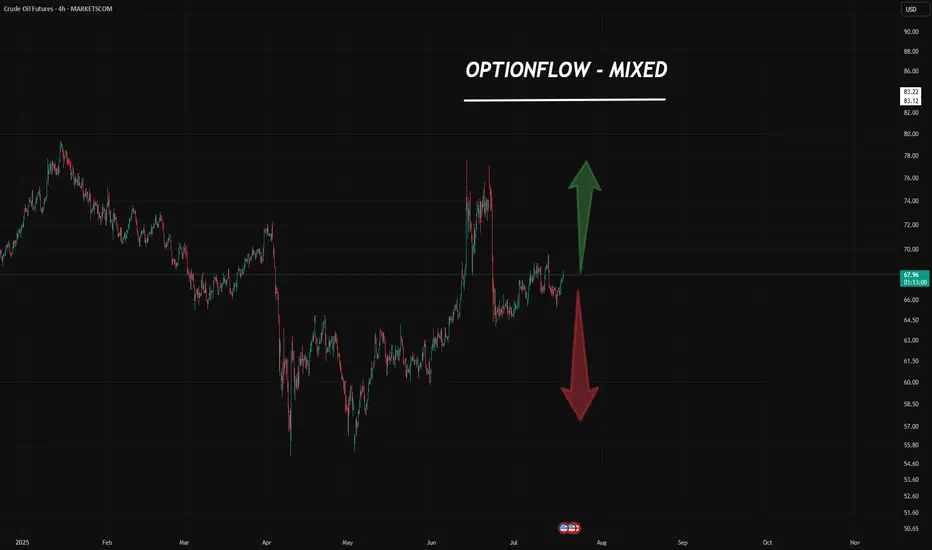
Crude Oil: Bulls vs. Bears — A Market at the Edge
Here’s what we’re seeing from the latest CME block trade data & CME report:
🐻 Confirmed & Detailed Bearish Sentiment
Big players are actively hedging and betting on a drop.
Block trades are targeting key downside levels:
$62.50 , $55.00 , and even as low as $45.00 .
This isn’t noise — it’s institutional conviction.
🐂 Strong Bullish Resistance
At the same time, there’s heavy buying in:
Long futures
Bullish call spreads (1,000+ contracts)
This tells us: there are serious buyers stepping in, targeting $67.50–$72.50 .
They don’t believe in the bear case — and they’re backing it with real money.
🧭 Market at a Bifurcation Point
The presence of massive, conflicting block trades is a clear sign:
The market is preparing for a big move — up or down.
“Smart money” isn’t betting on sideways action.
They’re positioning for breakout volatility .
📊 Final Forecast
Oil is under strong bearish pressure.
That makes a downward scenario more likely in the medium term .
BUT — there’s strong support from big buyers stepping in around $64–$65 .
So the most probable path?
A high-volatility phase , with attempts to test both:
Upper targets (bullish side)
Lower support zones (bearish side)
🔑 Key Battle Zone: $62 – $68
This range will be critical in the days ahead.
Break it — and we’ll know which side is in control.
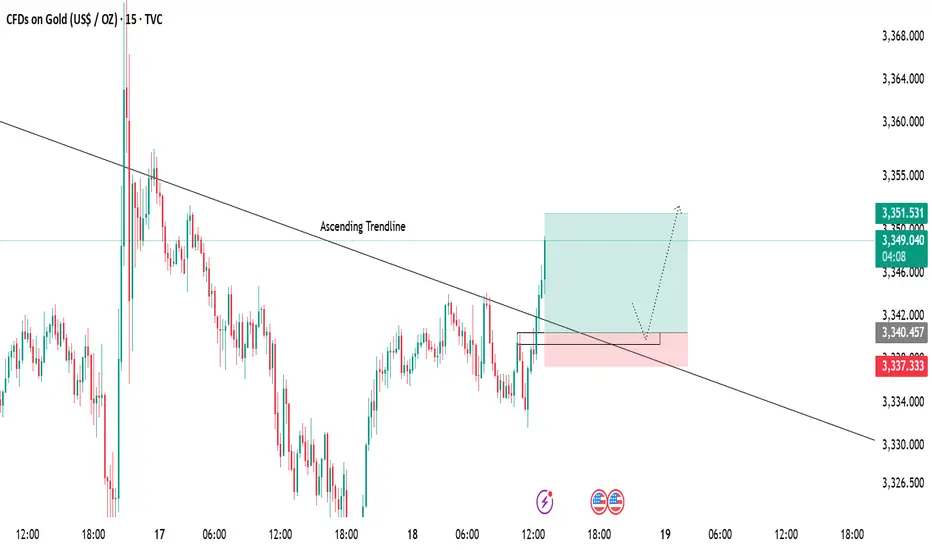
Gold 15-Min Chart Analysis Alert!Gold has successfully broken above the descending trendline, showing early signs of bullish momentum. Price has reclaimed structure and is now trading above the breakout level.
📌 Retest Zone:
We can expect a possible pullback towards the marked zone for a healthy retest before continuing the upward move.
🎯 Bullish Target:
As long as price holds above the support area, the bullish bias remains intact with targets around 3351+.
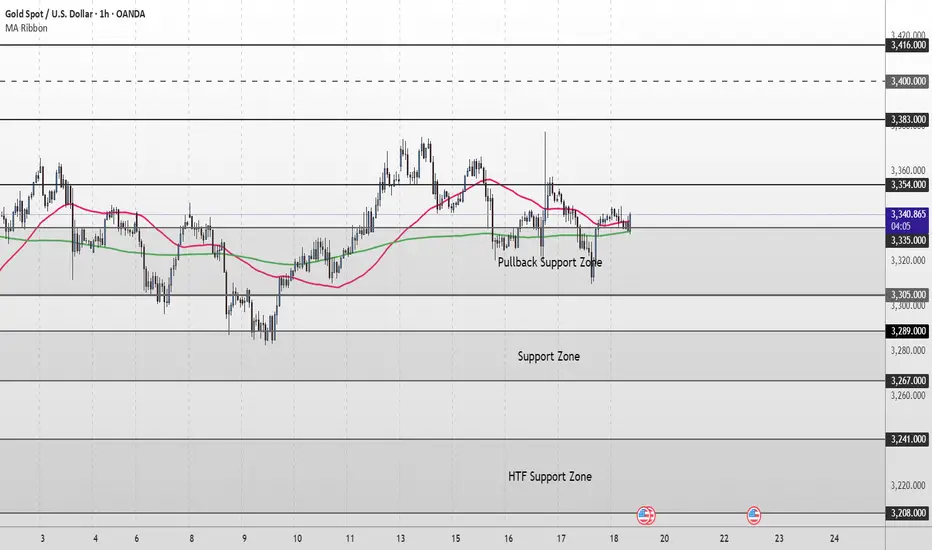
Gold Short Term Outlook Gold has held above the Pullback Support Zone (3,335–3,305) after yesterday’s volatility, with buyers stepping in to defend the zone.
Price is now trading around 3,338, caught between the 50MA and the 200MA.
Despite the recent dip, the structure remains supportive as long as price holds above 3,335.
A clean break and hold above 3,354 would confirm renewed bullish momentum, opening the path toward 3,383 and 3,400, with 3,416 as a higher‑timeframe target.
If price fails to clear 3,354 and turns lower again, watch for signs of exhaustion back into the Pullback Support Zone (3,335–3,305).
A decisive break below 3,305 would shift focus to the Support Zone (3,289–3,267), with further downside exposing the HTF Support Zone (3,241–3,208).
📌 Key Levels to Watch
Resistance:
‣ 3,354 ‣ 3,383 ‣ 3,400 ‣ 3,416
Support:
‣ 3,335 ‣ 3,305 ‣ 3,289 ‣ 3,267 ‣ 3,241
🔎Fundamental Focus
📌 4:00pm: UoM Sentiment & Inflation Expectations – can spark sharp USD/gold moves.
➡️ Expect volatility around releases.