July 13, Forex Outlook : This Week’s Blueprint to Profit!Welcome back, traders!
In today’s video, we’ll be conducting a Forex Weekly Outlook, analyzing multiple currency pairs from a top-down perspective—starting from the higher timeframes and working our way down to the lower timeframes.
Currency Pairs:
EURUSD
USDCAD
AUDUSD
EURGBP
EURJPY
GBPCHF
USDCHF
NZDCHF
NZDUSD
EURNZD
Our focus will be on identifying high-probability price action scenarios using clear market structure, institutional order flow, and key confirmation levels. This detailed breakdown is designed to give you a strategic edge and help you navigate this week’s trading opportunities with confidence.
📊 What to Expect in This Video:
1. Higher timeframe trend analysis
2. Key zones of interest and potential setups
3. High-precision confirmations on lower timeframes
4. Institutional insight into where price is likely to go next
Stay tuned, take notes, and be sure to like, comment, and subscribe so you don’t miss future trading insights!
Have a great week ahead, God bless you!
The Architect 🏛️📉
Supportandresistancezones

XRP Hits $3.10 — Rising Wedge or Ready to Fly?XRP has been on a strong run over the past 24 days, rallying from $1.90 → $3.10 — a +62% price increase. But after hitting key resistance, is XRP about to correct, or will it break out further? Let’s dive into the technicals.
🧩 Market Structure
Rising Wedge Pattern:
The current market structure resembles a rising wedge, with XRP likely completing wave 5.
Rejection Zone Hit:
Price tapped the nPOC at $3.10 and rejected — providing a clean short opportunity.
📉 Key Support Levels & Confluences
Taking the full 24-day bullish move:
0.382 Fib Retracement: $2.6326 — aligns with liquidity pool below the $2.6596 swing low.
226-day Trading Range VAH: ~$2.62 (red dashed line) — adds confluence.
Daily Level: $2.60 — further support.
Anchored VWAP from $1.90 Low: ~$2.54 (rising over time).
✅ Conclusion: The $2.66–$2.60 zone is a critical support area and offers a solid long opportunity.
Trade Setups
🔴 Short Setup (After Breakdown Confirmation):
Wait for a sell-off & breakdown of the wedge.
Ideal entry: retest of the lower wedge edge, ideal short entry would be between 0.618–0.786 fib retracement.
🟢 Long Setup:
Entry Zone: $2.66–$2.60
SL: below VWAP line
Target: Fib 0.618 as TP
🧠 Educational Insight: Rising Wedges Explained
A rising wedge is a bearish pattern, often signalling weakening momentum as price climbs within narrowing highs and lows.
Key points:
➡️ Volume typically declines as the wedge matures.
➡️ Breakdown below the lower wedge edge often triggers stronger sell-offs.
➡️ Retests of the broken wedge support turn into ideal short entries.
Pro tip: Combine wedge patterns with fib retracement zones and VWAP levels for higher-confidence setups.
Watch for wedge breakdown confirmation before shorting.
_________________________________
💬 If you found this helpful, drop a like and comment!
Want breakdowns of other charts? Leave your requests below.

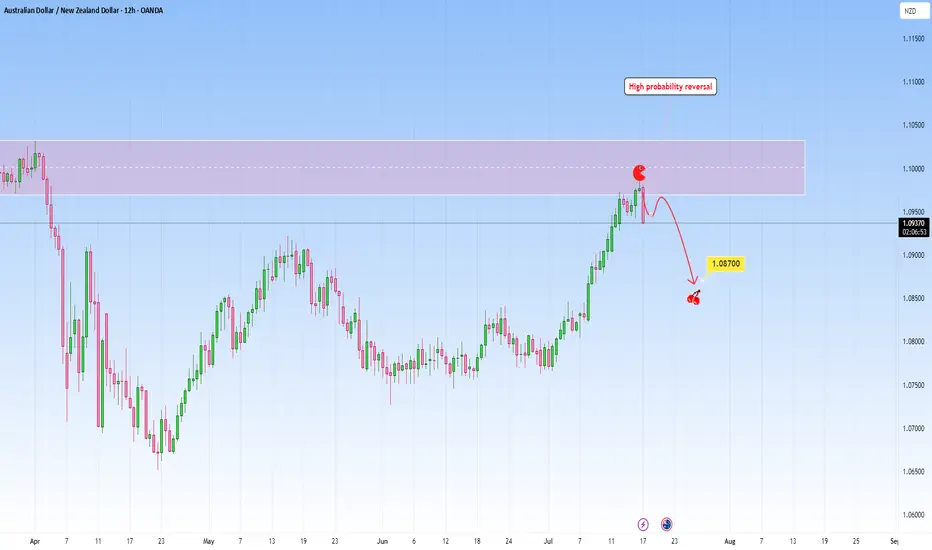
AUDNZD: Ongoing Reversal from ResistanceI am watching for a reversal on AUDNZD as marked on my chart, expecting a reversal with a downside target at around 1.08700.
This is a high probability setup taken into account the overextended upside move to this resistance zone.
Just sharing my thoughts for the charts, this isn’t financial advice. Always confirm your setups and manage your risk properly.
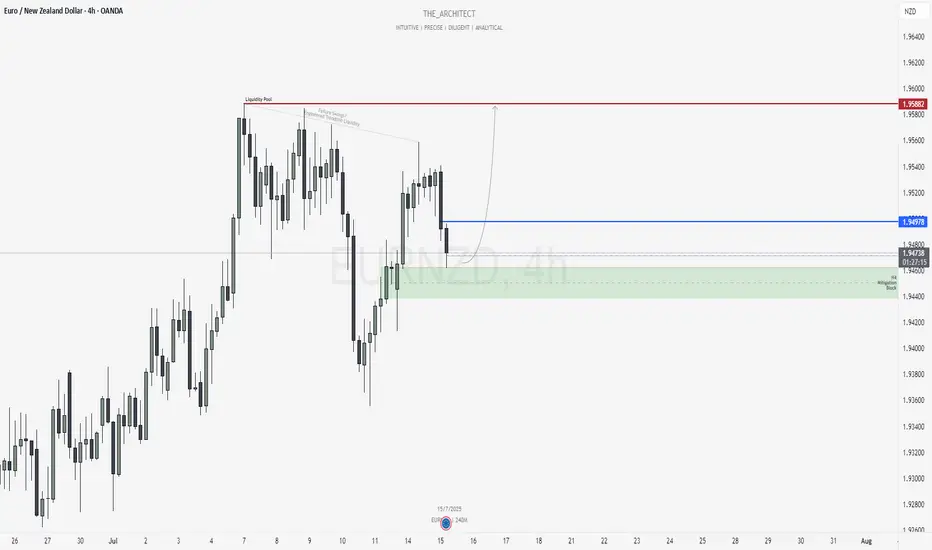
EURNZD: Bullish Setup Targeting Engineered Highs!Greetings Traders,
In today’s analysis of EURNZD, we observe that the market is currently operating within bullish institutional order flow. It is therefore essential that we align our bias with this narrative by focusing on buying opportunities.
Market Context:
Higher Timeframe Alignment:
The weekly timeframe is showing a bullish draw on liquidity, and this is confirmed by the H4 (intermediate) timeframe, which is also structurally bullish. This alignment between higher and intermediate timeframes provides strong confluence for long positions.
Mitigation Block Support:
Price has recently retraced into an H4 Mitigation Block—a key institutional support zone. This area represents a region where previous sell-side activity was initiated. Now that price has broken above it, institutions are likely using this retracement to mitigate prior sell positions and establish new buy orders.
Trade Idea:
Entry Strategy:
Look for confirmation on the lower timeframes within the H4 mitigation block to initiate long positions in alignment with institutional order flow.
Target Objective:
The primary target is the relatively equal highs residing in premium pricing. These levels coincide with engineered trendline liquidity and failure swings, making them highly attractive profit-taking zones for institutions—where significant buy-side liquidity is expected to be absorbed.
Stay patient and execute only upon clear confirmation signals.
Kind Regards,
The Architect 🏛️📊
Weekly Equities Trade Idea: CRCL Puts (Update)Hello Traders!
I'm providing an update to the CRCL trade idea from Monday July 14th. Here's what I'm watching:
- Price to open within the range from Tuesday July 15th
- Potential imbalance resolve from Monday July 14th at $204.70
- If price breaks Friday July 11th's high at $206.80 the trade is invalidated
Cheers,
DTD

Gold Short Term OutlookGold has pulled back sharply from the 3,354 resistance but found support inside the Pullback Zone (3,335–3,3305 where buyers have stepped back in. Price is now attempting to reclaim ground, trading around 3,341, with the 50MA acting as dynamic resistance overhead and the 200MA as dynamic support.
For the bullish move to continue, we need to see a clean break and hold above 3,354. That would reopen the path toward 3,383 and 3,400, with 3,416 as the higher-timeframe target.
If price fails to clear 3,354 and rolls over again, watch the Pullback Zone (3,335–3,305) for signs of exhaustion. A break below 3,305 would shift focus to the deeper Support Zone (3,289 - 3,267) and potentially toward 3,241 - 3,208 if bearish pressure accelerates.
📌 Key Levels to Watch
Resistance:
‣ 3,354
‣ 3,383
‣ 3,400
‣ 3,416
Support:
‣ 3,335
‣ 3,305
‣ 3,289
‣ 3,267
‣ 3,241
🔎 Fundamental Focus – PPI Release Today
Today’s U.S. Producer Price Index (PPI) will be closely watched as a follow‑up to yesterday’s CPI data.

AUDUSD good structure for higher bullish
OANDA:AUDUSD whats next, we are have DESCENDING CHANNEL breaked, its followed by bullish push, but its not make to much in my op, at end price is make revers, its stop at end on strong sup zone (0.64900).
We are have in last day-two RBA and RBNZ today, price is start pushing looks like zone 0.64900 can be taked for valid zone, from which now expecting higher bullish push in next periods.
SUP zone: 0.65100
RES zone: 0.66300, 0.66600

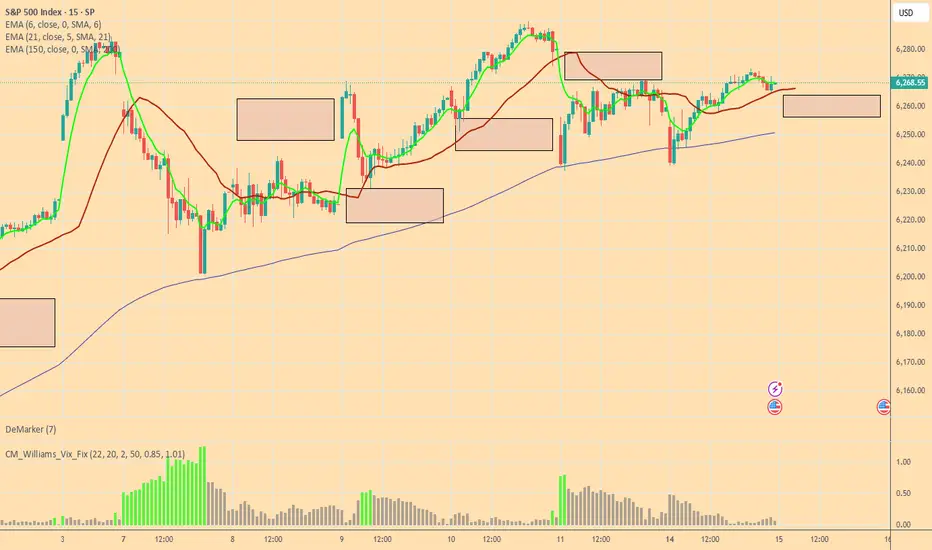
Bulls and Bears zone for 07-15-2025ETH session market is trading higher and expected to Open gap up.
Would traders be able to keep that momentum going rest of the RTH session.
Level to watch: 6328 --- 6330
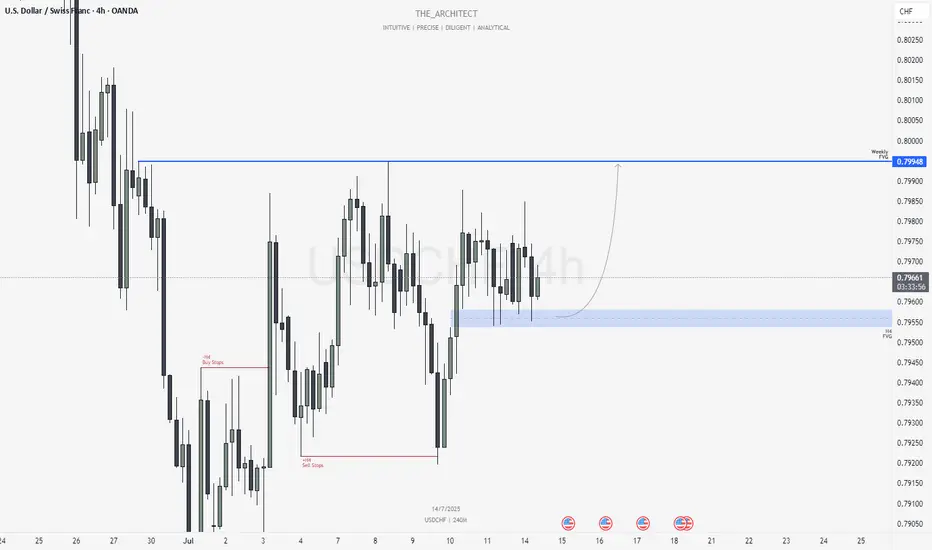
USDCHF: H4 Bullish Order Flow Targeting Weekly FVGGreetings Traders,
In today’s analysis of USDCHF, we observe that the H4 timeframe is currently delivering bullish institutional order flow. As a result, our directional bias is aligned with seeking buying opportunities that reflect this bullish momentum.
Market Context:
Higher Timeframe Objective:
The current draw on liquidity is aimed at a Weekly Fair Value Gap, which now serves as our primary upside target. Since the higher timeframe narrative is bullish, it’s essential that our intermediate timeframe—the H4—confirms this bias, which it does through consistent bullish structure.
Institutional Support Zone (H4):
As price continues to form higher highs and higher lows, it has now retraced into an H4 Fair Value Gap, functioning as an institutional support zone. Notably, this area has been retested multiple times, further reinforcing its strength and significance.
Trading Plan:
Entry Strategy:
Monitor the lower timeframes for confirmation signals within the H4 Fair Value Gap. Look for bullish price action cues before executing buy orders.
Target:
The primary objective remains the Weekly Fair Value Gap, which represents a key area of institutional interest and a likely zone for price to be drawn into.
July 13, Forex Outlook : This Week’s Blueprint to Profit!
Stay patient, follow your confirmations, and align with the flow of smart money.
Kind Regards,
The Architect 🏛️📊
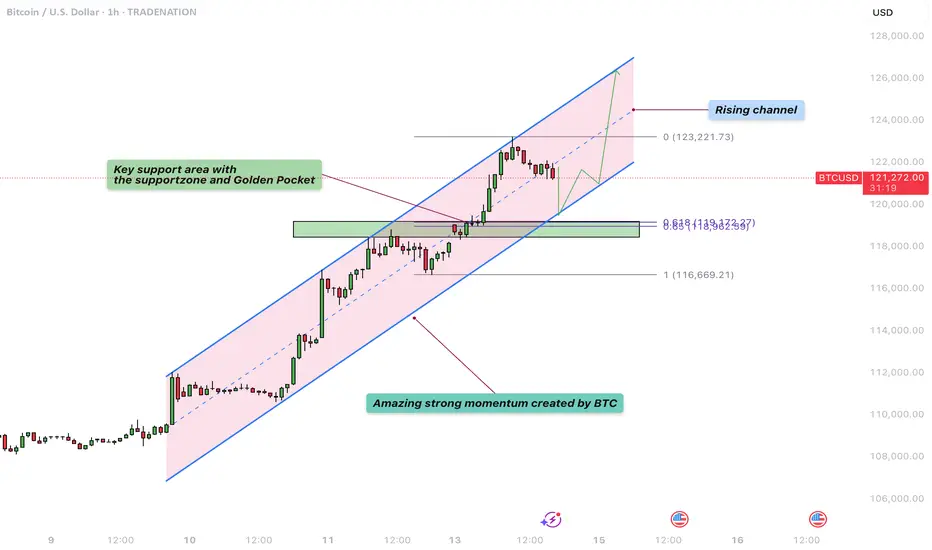
Bitcoin – Rising channel with critical support at $119.000!The chart presented shows Bitcoin in a well-defined rising channel, highlighting a strong bullish momentum over recent trading sessions.
Rising channel
The price action is currently oscillating within the boundaries of this upward sloping channel, marked by parallel trendlines. The channel suggests that Bitcoin has been consistently making higher highs and higher lows, with the current price hovering around $121,794. The upper boundary near $123,200 acts as potential resistance, while the lower boundary of the channel provides dynamic support, suggesting a continuation pattern if this structure holds.
Uptrend
The overall uptrend is clearly visible and remains strong, especially since July 10th, where a significant bullish breakout occurred. The breakout was followed by steady gains, with minimal pullbacks, indicating strong buying interest and market confidence. The momentum shows a healthy bullish structure with minimal price overlap, characteristic of a trending market, which favors continuation as long as critical support levels remain intact.
Support area
A critical element in this chart is the key support area, highlighted in green. This support zone is located between approximately $118,500 and $119,600. This zone was previously a resistance level that has now turned into support following the breakout. It also aligns with the mid-level of the rising channel, reinforcing its significance. Should the price retrace, this area is likely to act as a cushion where buyers may step in again to defend the trend.
Fibonacci
Additionally, the chart features a Fibonacci retracement drawn from the swing low to the current swing high. The 0.618 Fibonacci level is particularly noteworthy, sitting at around $119,623. This level is known as the “golden ratio” in technical analysis and often acts as a strong retracement level during corrections. Below it, the 1.0 level is marked at $116,669, which represents a full retracement of the move and a deeper correction scenario if the support fails. These Fibonacci levels coincide with the key support zone, further validating it as an area of high confluence and likely buying interest.
Final thoughts
Overall, the technical structure remains bullish within the rising channel, with key levels of interest lying around $119,600 for support and $123,200 for potential resistance. A successful defense of the support area could propel the price higher toward the channel’s upper bound, while a breakdown may lead to a test of deeper Fibonacci retracement levels.
Disclosure: I am part of Trade Nation's Influencer program and receive a monthly fee for using their TradingView charts in my analysis.
Thanks for your support. If you enjoyed this analysis, make sure to follow me so you don't miss the next one. And if you found it helpful, feel free to drop a like and leave a comment, I’d love to hear your thoughts!
Short-term Bear Case for CRCLHello Traders!
As part of my weekly equity trade analysis, I will be uploading my recordings of what I am seeing and intending to trade for the week. A quick summary of what's in the video is as follows:
- CRCL is a high beta stock that seems to not be moving in tandem with its peers as of late
- I am expecting volatility due to market data and monthly options expiration
- CRCL has formed a new bearish order block below another bearish order block and is wedged with a weekly bearish setup. We are anticipating expansion out of this range to the downside
- I am waiting for a re-test of $199-$205 for a full move to $155-$145
Cheers,
DTD

Big Week for Markets: U.S. CPI Tomorrow – What It Means for GoldThis week is packed with news, but the main focus is the U.S. CPI report dropping tomorrow.
🗓 Key Event: U.S. CPI Report
📍 July 15, 2025 | 12:30 p.m. UTC
The CPI report measures inflation and heavily influences the Fed’s rate decisions. Last month’s CPI came in at 2.4% vs. 2.5% expected, following 2.3% vs. 2.4% in April. While it seems inflation is rising, the bigger picture shows stable annual inflation in the 2.3%–3.0% range, keeping things under control—likely the reason Trump is pressuring Powell to cut rates.
Market expects June CPI to be 2.7%.
🤔 Possible Scenarios:
1️⃣ CPI > 2.7%: Bullish for DXY 📈. The stronger the print, the bigger the spike, but I see this scenario as less probable.
2️⃣ CPI < 2.7%: Bearish for DXY 📉. We may see a USD dump, though likely shallow since CPI could still be higher than previous months.
✨ What About Gold?
I don’t expect a major reaction in gold:
✅ Higher CPI? Gold often benefits as an inflation hedge.
✅ Lower CPI? Also supportive for gold as it weighs on the USD.
🔍 Technical Outlook:
Gold has been trading within a triangle since April 22, forming lower highs and higher lows. We may currently be in Wave D (Elliott Wave), aiming toward the triangle’s upper boundary slightly above $3,400 resistance. After that, Wave E may develop – but that’s a story for another post.

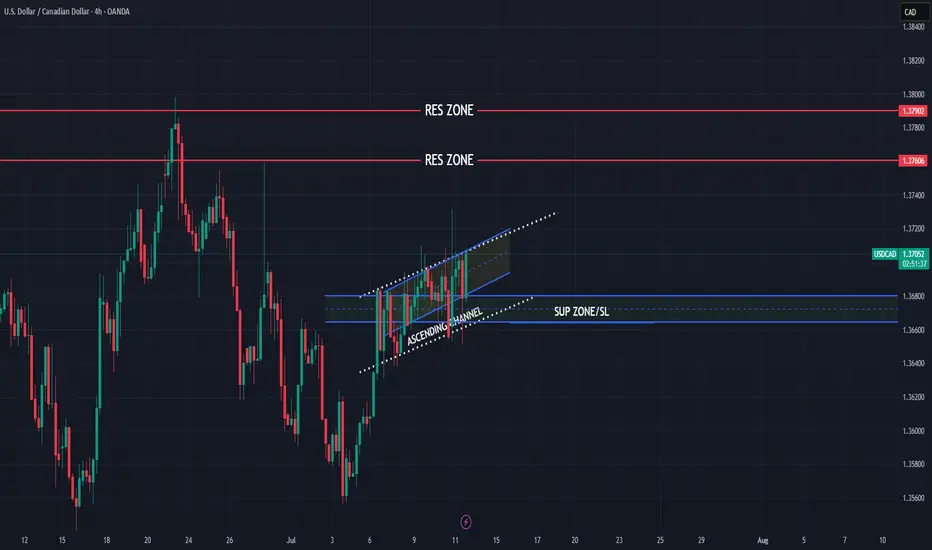
USDCAD still bullish?
OANDA:USDCAD what's next, we are have bullish push, currently price in ASCENDING CHANNEL and in ascending channel is visible and one more ASCENDING CHANNEL (marked yelow), interesting chart,- can we see higher bullish push?
SUP zone: 1.36800
RES zone: 1.37600, 1.37900
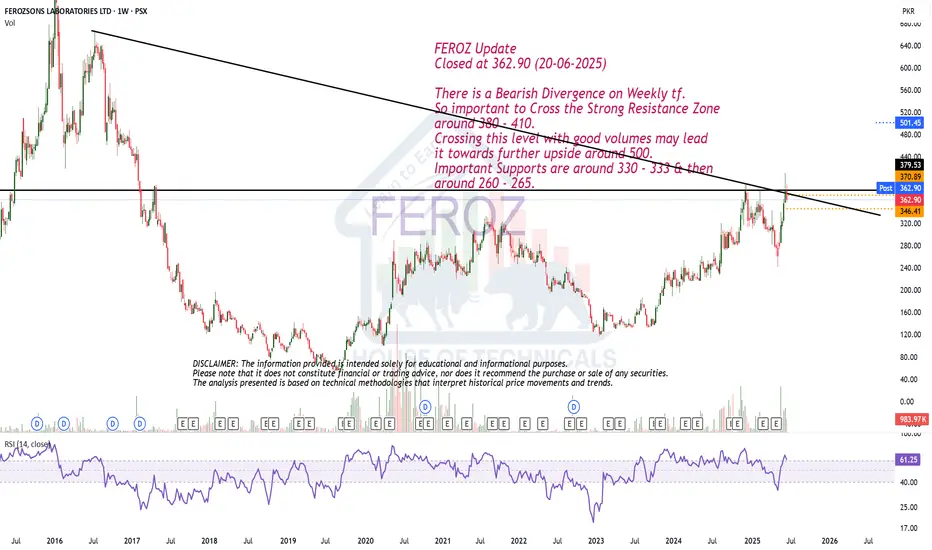
Bearish Divergence on Weekly tf.FEROZ Update
Closed at 362.90 (20-06-2025)
There is a Bearish Divergence on Weekly tf.
So important to Cross the Strong Resistance Zone
around 380 - 410.
Crossing this level with good volumes may lead
it towards further upside around 500.
Important Supports are around 330 - 333 & then
around 260 - 265.
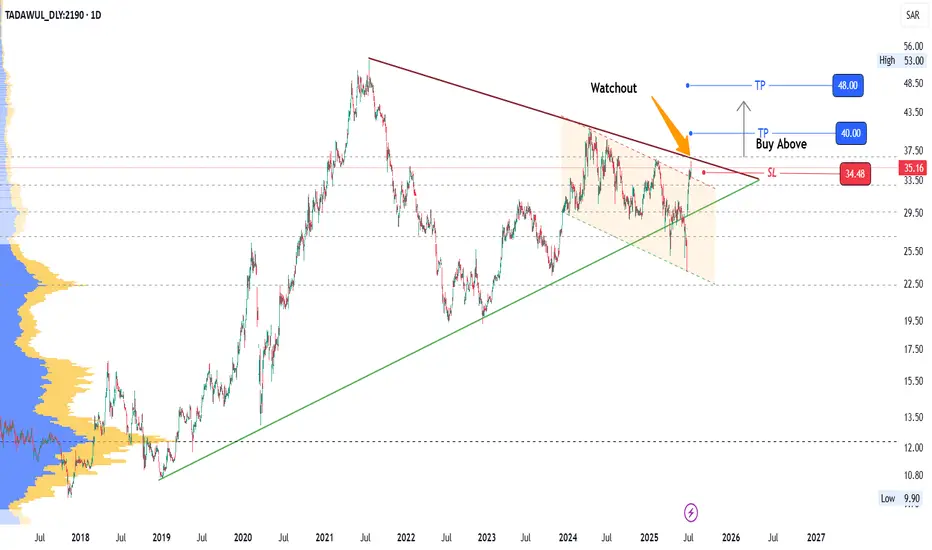
2190: Watch for Breakout2190 has reached Triangle Top (Trendline resistance) breaching a descending parallel channel resistance recently.
Watchout for the breakout of resistance.
Levels are marked.
Manage your risk with proper SL.
Enjoy the ride!
GBPUSD - Also continued downside continuationLooking at GU. This is a little bit ahead of its time in comparison to EU.
And what i mean by that is EU is a lot further away from its 4H demand zone compared to GBP so it will be super interesting to see how we react at the level we are fast approaching on GU.
I am in a short position as of Friday. I will be posting a video tomorrow showing exactly how and why i got short on GU so stay tuned for that one.
As always if there is anything else i can be of assistance with give me a message and i will be happy to answer any questions you may have
EURUSD - Still Orderflow remains bearishLooking at EU. The 1H Orderflow is still maintaining that bearish intent. My area is set now for where i want to take a potential sell to the downside seeing as everything else is pretty much mitigated.
The only issue with this potential sell of is that we never really had a sweep of liquidity before we rolled over and moved to the downside.
We do have a level of inducement before our POI but i think in an ideal world i would love to see us build up a bit more liquidity before the POI just to induce the early sellers before making that move to the downside.
For now. On the lower TF's i will be looking to take short term long positions back up to our POI before looking for the longer terms short. to our 4H POI in which i will be looking to get long once again.
Any questions feel free to give me a message

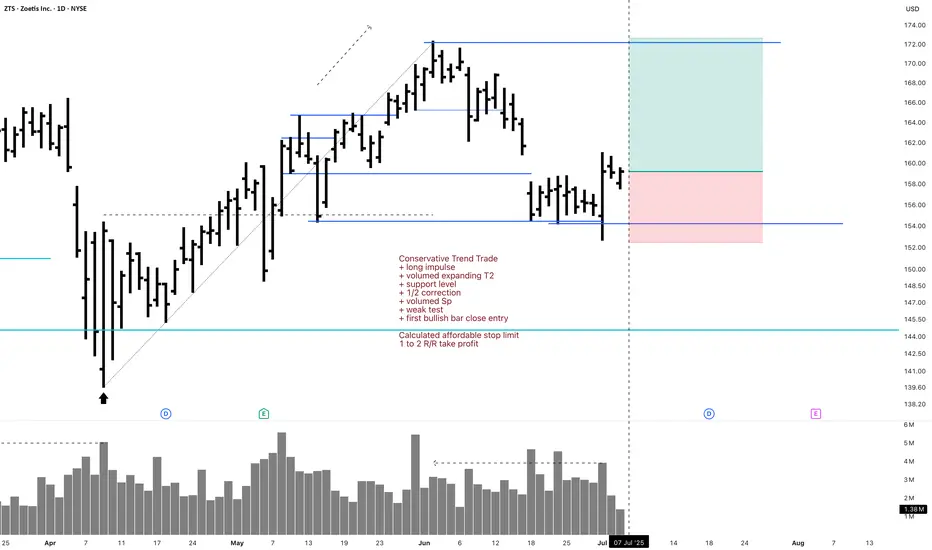
ZTS Investment 1D Long Conservative Trend TradeConservative Trend Trade
+ long impulse
+ volumed expanding T2
+ support level
+ 1/2 correction
+ volumed Sp
+ weak test
+ first bullish bar close entry
Calculated affordable stop limit
1 to 2 R/R take profit
Monthly trend
"+ long impulse
+ ICE level
+ support level
+ 1/2 correction
+ volumed 2Sp
+ weak test?"
Yearly trend
"+ long impulse
- correction"
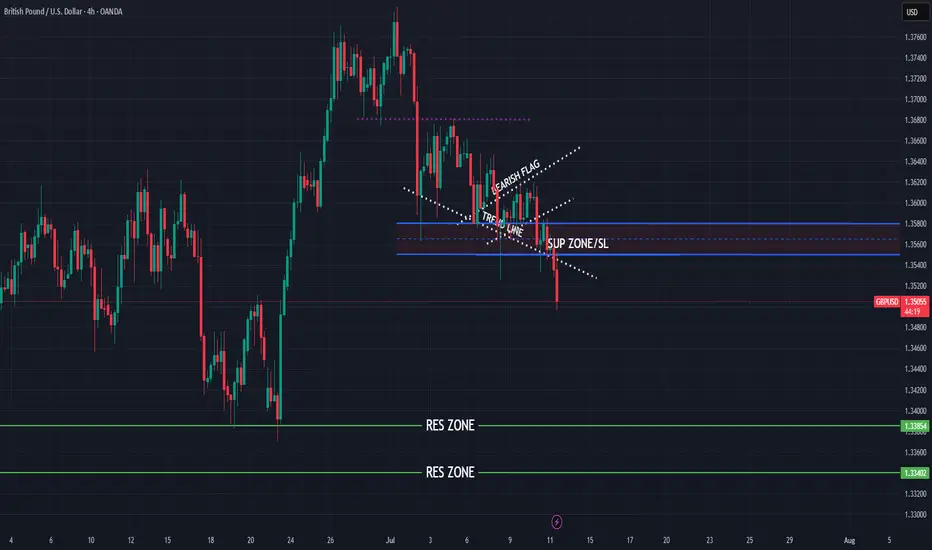
GBPUSD bearish continuation for expect
FX:GBPUSD strong bearish pushing, we can see BEARISH FLAG pat and trend line breaked, here still strong bearish to expect till TPs.
SUP zone: 1.35500
RES zone: 1.33850, 1.33400
Gold Short Term OutlookGold has extended its recovery after reclaiming both the 50MA and 200MA, now trading just below the $3,341 resistance. Price has broken out of the short-term descending channel and is showing early signs of bullish continuation.
A confirmed break and hold above $3,341 would open the path toward the next resistance cluster at $3,356–$3,370, followed by $3,383.
If price rejects this resistance and pulls back, the $3,328–$3,313 area will be key to maintain the bullish structure. Below that, focus returns to the $3,300 level and the broader Support Zone.
📌 Key Levels to Watch
Resistance:
‣ $3,341
‣ $3,356
‣ $3,370
‣ $3,383
Support:
‣ $3,328
‣ $3,313
‣ $3,300
‣ $3,267
⚠️ It’s Friday! Stay sharp and manage your risk.

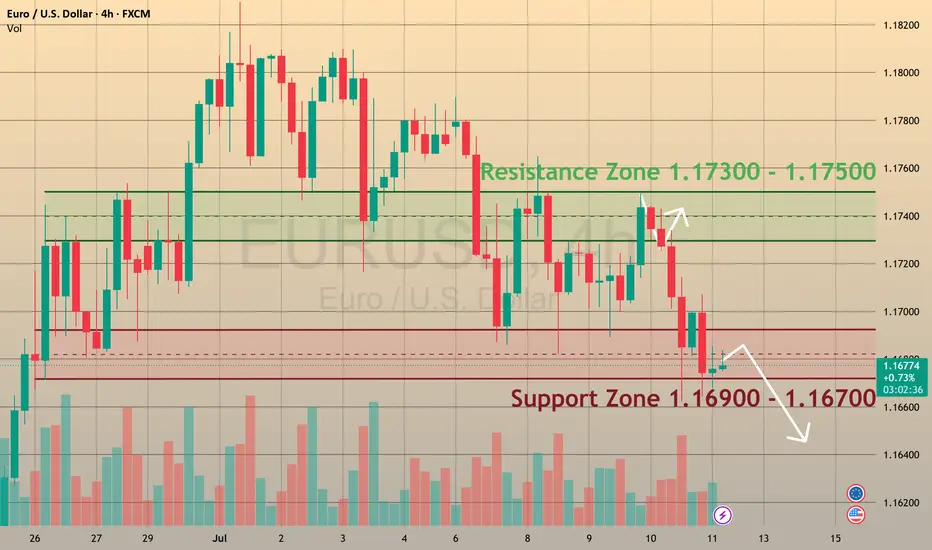
EURUSD is ready to break supportCMCMARKETS:EURUSD
The Euro fell to 1.1670 on Friday, positioning for nearly a 1% weekly loss 📊, as investors recalibrated risk exposure amid escalating trade tensions ⚔️ and shifting monetary policy signals 🏦.
📉 Market Structure:
🔻 EURUSD has traded in a bearish trend since July 1.
🔹 Support levels: 1.1680 and 1.1590.
🔹 Retested the 1.1680 support zone on Friday.
💡 How to Trade This:
✅ If the pair rebounds from support 🔄, consider BUYING with a Take Profit near the next resistance level.
❌ If the support breaks with confirmation 🩻, consider SELLING to target lower support zones.
📰 What’s Driving the Move?
🏦 Monetary Policy:
Chicago Fed President Austan Goolsbee pushed back against calls for aggressive rate cuts 🗣️, reaffirming the Fed’s focus on its dual mandate of maximum employment and price stability ⚖️. His cautious stance adds uncertainty 🤔 to the policy outlook for the second half of the year as markets weigh inflation risks vs. growth slowdown signals.
💼 Economic Data:
The labor market remains solid 💪, but recent jobless claims data show early signs of cooling 🧊, following last week’s strong NFP report.
💵 Dollar Strength:
The dollar advanced sharply against the euro 🚀, driven by risk aversion, relative yield advantages, and investor positioning ahead of upcoming inflation data and the Fed’s next policy signals 📈.
🚨 Watch for:
🔸 A confirmed breakout or rebound at 1.1680 to guide trade entries.
🔸 Upcoming U.S. inflation data 🪙 for direction on Fed policy and USD strength.
🔸 Further developments in trade tensions 🌐, which could drive risk sentiment.
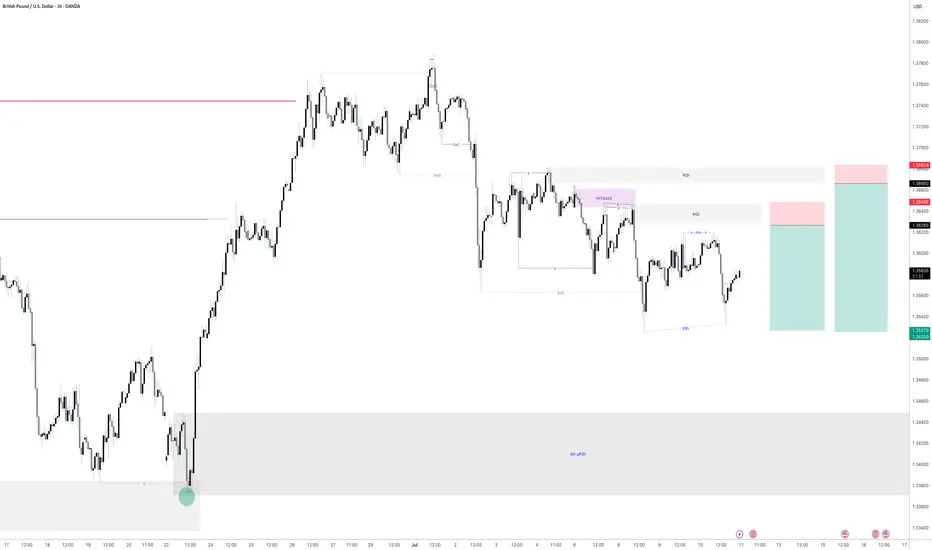
GBPUSD - 2 Selling opportunitiesLooking at GBPUSD
We have 2 opportunities to get short. Both have a build of liquidity before the areas of supply before them. This means we are looking for the early seller to get into the market before we get in so that all the early seller get stopped out.
As we can see the order flow on this is still bearish. So until the market shows me it want to go higher then we will remain bearish
Keep a close eye on this for tomorrow
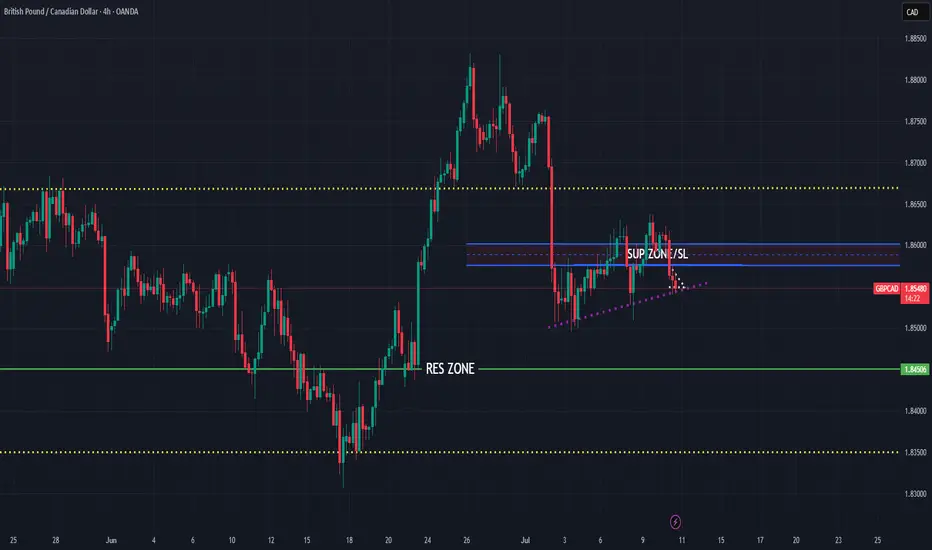
GBPCAD bearish for expect
OANDA:GBPCAD last 4 ideas on this pair attached, we are have one strong fall, price is make few pushes on sup zone (violet doted), which taking for legal zone, currently price in ASCENDING TRIANGL better visible on 15TF (will make in note), expecting break of same and higher bearish continuation.
SUP zone: 1.85750
RES zone: 1.84500