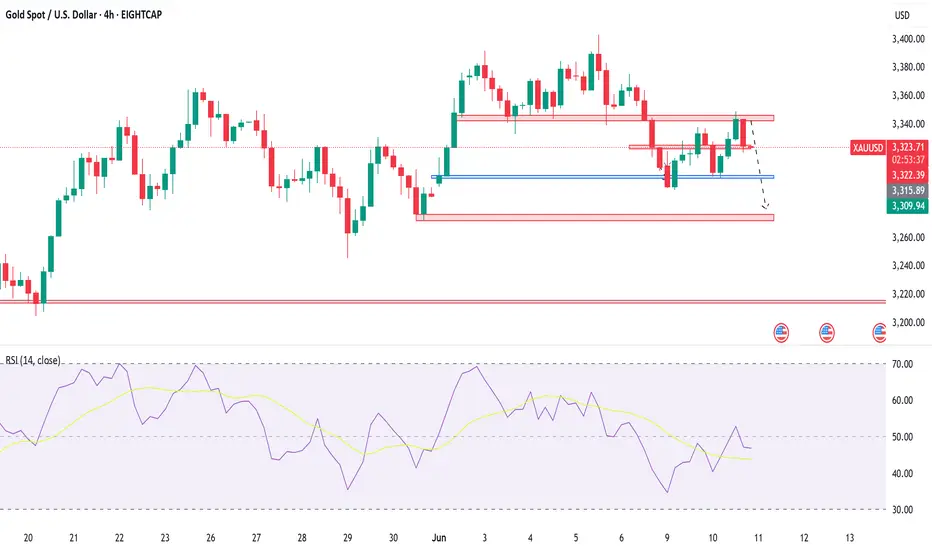
Gold ShortAmidst dxy consolidation, gold seems to be forming a correction. A new trading range is formed between 3300 and 3340. Earlier in the session, false breakout of 3340 resistance formed, but price got rejected strongly. Our focus is on gold correcting itself, where it has the potential to tap the important support zone at 3275.
Levels to lookout for
Support: 3300, 3275
Resistance: 3340
Happy trading!
Supportandresistancezones
[GEX] TSLA Breakdown & Options Trade Idea for 39DTELast week, TSLA dropped hard, likely due to political tensions. Let’s not forget — just a month ago, their EVs were showcased at the White House entrance...
In the span of 30 hours, TSLA fell -22% (see red line below), while SPX barely reacted. Why? Because both realized and implied volatility dropped — remember VIX is around 17/18.
This sharp TSLA drop already seemed overdone, which helped fuel the +5% bounce on Friday.Most TSLA options positions are near-term and still show negative sentiment — but further expirations grow increasingly bullish.
🔍 If you use options GEX matrix , you’ll see the bearish hedging flow gradually turns more neutral-to-bullish.
Most cumulative support/resistance zones lie between 250–340, with spot currently just under the chop zone.
🧠 TSLA Trade Idea
It’s been a while since I posted a neutral Iron Condor, but TSLA might be an exception.
Despite last week’s IV spike, call pricing skew still dominates across expirations — as seen in our Options Overlay indicator.This tells me the market doesn’t fear TSLA crashing below 200. So, I’m aiming to capture premium on the July 18th expiry without day trading.
I’m thinking of something simple, well-manageable in either direction.To refine leg placement, I use visual GEX zones.
🐻🔴 Downside:
Strong put support at 250
Gradual support layers up to 280
🐂 🟢 Upside:
Target area: 340–350 for the July 18 expiry.
📅 Closing the Trade:I'll consider closing or adjusting at 21 DTE or when 50% max profit is hit — per TastyTrade’s studies.
🔁 Rolling Plan:IF short delta on one side drops below ~14 and price pulls away, I’ll roll the untested side to collect more credit.
🧑🏫 I’ll likely post trade management live in Discord for educational purposes.
~~~~~~~~~~~~~~~~~~~~~~~~~~~~~~~~~~~
🦋 Bonus Idea: TSLA Broken Wing Butterfly
If you think TSLA has more downside, a Put Broken Wing Butterfly — like the one shown in my previous YT video — is also a great way to structure this trade using the same GEX levels.
There’s no single way to use Gamma Exposure — it’s the most actionable hedging signal we have. Combine it with your knowledge of strategies and you can trade almost any scenario.
One thing’s for sure — this market moves faster than ever.A single day of internal conflict wiped -22% off TSLA…The next morning, the market already moved on, so as always:
Trade Safe Out There!

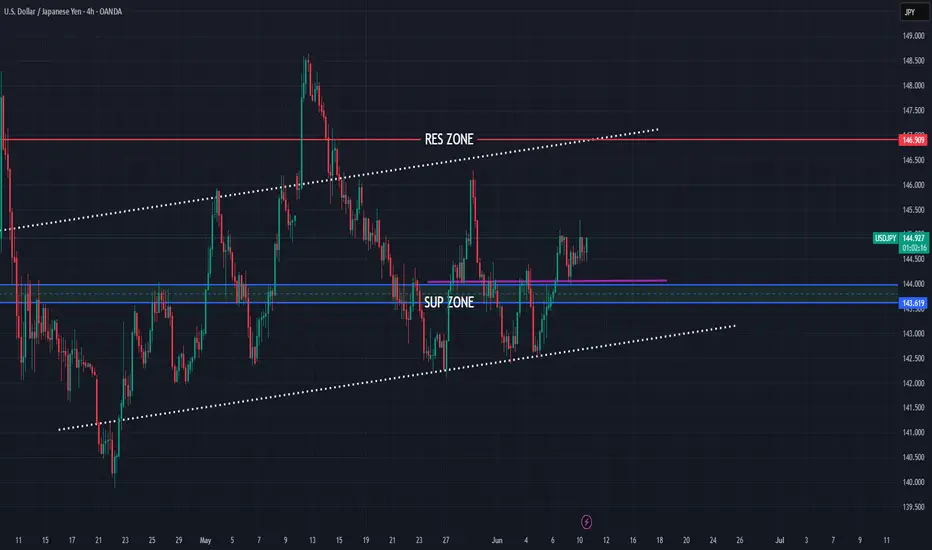
USDJPY higher bullish for exepct
FX:USDJPY PA based analysis, price is bounce few times on bottom line of PA, last we have bullish push with short revers till zone 144.000, which taking here for sup zone from which expecting higher bullish continuation.
Technicalls are here same strong bullish for expect
SUP zone: 144.000
RES zone: 146.900
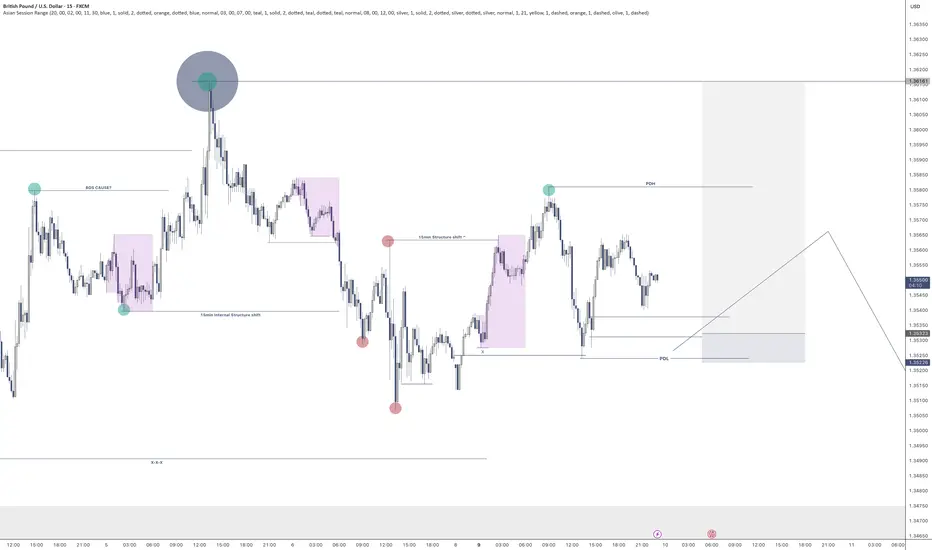
GBPUSD - Long on fullfillment Looking at GBPUSD
The order flow on the 4HR and 15min are still bullish.
Looking for that upside momentum until we take out a 4HR level of demand.
So until the buyers have had enough and the sellers take over. Lets see what we get overnight.
Will leave a pending order on this until the London open and then re-assess in the morning
If you have any questions don't be shy
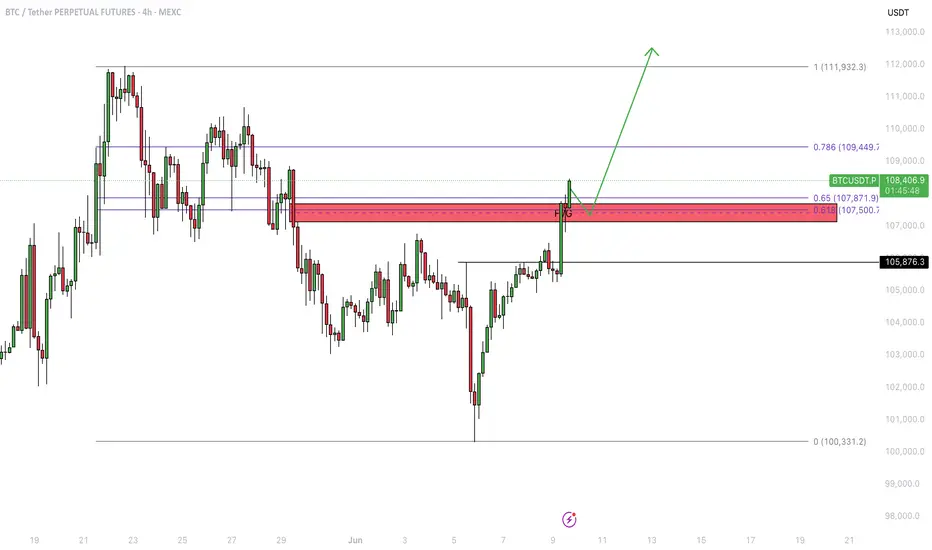
Bitcoin - Showing strength as it breaks key resistance levels!Bitcoin (BTC) recently demonstrated impressive strength by bouncing off a well-known confluence zone consisting of the golden pocket and a 4-hour fair value gap (FVG) around the $100,000 level. This technical area has historically acted as a reliable support and once again proved its significance, offering a solid foundation for the current rally.
Following this bounce, BTC surged to $108,000, decisively breaking above the 4-hour FVG near $107,000. With this breakout, the previously resistant zone is now expected to flip into support, adding further confidence to the bullish outlook. This type of price action is often seen in strong uptrends, where key resistance levels are reclaimed and converted into support, providing a base for further upside.
Importantly, BTC has also managed to push through the golden pocket resistance, a critical Fibonacci retracement area closely watched by traders. This breakout, in conjunction with the 4H FVG clearance, clears the path for a potential continuation toward Bitcoin’s all-time high.
Momentum is clearly building. Buying pressure is strong, and retracements have been shallow, indicating a market dominated by demand. While this is a bullish sign, a brief pullback or bounce off the newly formed support (the 4H FVG zone) would be healthy. Such a move would allow BTC to consolidate and build strength before potentially pushing toward new highs.
Overall, the technical landscape looks increasingly favorable for BTC. As long as it holds above the reclaimed support zones, the path to retesting, and possibly surpassing, the all-time high appears wide open.
Thanks for your support.
- Make sure to follow me so you don't miss out on the next analysis!
- Drop a like and leave a comment!
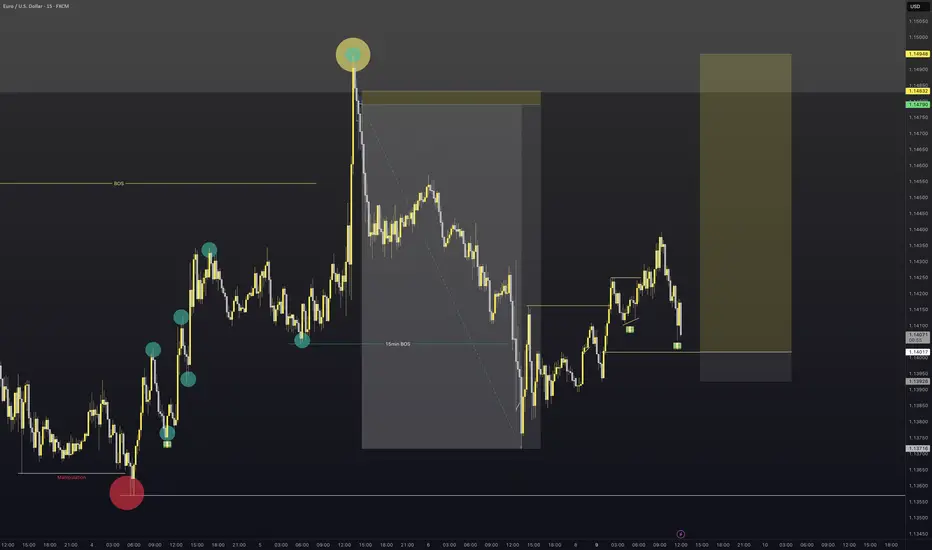
EURUSD - Long 15min orderflow changeI have set a pending order on EURUSD based on the structure shift and liquidity left behind to the left and now the right.
Entry order placed. lets see what happens on this position.
TSLA: Uptrend channel bounce, trading between 50 and 200-day SMAHey guys/gals!
So we all know that Tesla took a massive drop last week. It fell about 14%, and was down even 3% after hours at one point. I think we can all agree this crash wasn't technicals driven - it was clearly headline impacted. This was a clear black swan even t, and even in my case, nothing like this has ever happened to me as a trader. It was unforeseeable, forced me to hedge overnight and I'm still having nightmares (lol). Definitely one to remember as I don't think something like this would happen with any other stock. Tesla is truly unique in this sense.
But looking at the bigger picture, the bounce that we experienced on Friday must've been technicals driven, and psychologically influenced, as I am almost certain that the crash was a massive overreaction. People woke up the next day and thought this was severely discounted over a couple social media tweets (I won't go into the politics of things).
As you see on the chart, Tesla may in a new upward channel. At first I figured this may be a bear flag, however due to the upcoming catalyst like the Robotaxi launch - this would likely only be a bear flag if prices crashes below the lower support trend line.
As long as price is within the channel, I'd say things are holding up. We'd likely see a jump towards the upper side of the channel - however it's important to note that $300 and £360 are major resistance points. Robotaxi launch and any future tweets will definitely move price, and I think those will be a factor in determining whether price goes up or crashes below the trend line.
Another thing to point out is that price is currently trading between the 50-day and 200-day moving averages. The 50-day SMA is acting as vital support, whereas the 200-day SMA is the resistance. If there is a break above the 200-day SMA, price will likely go higher. The opposite may happen if price crashes below the 50-day SMA.
Either way, headlines and technicals mentioned above will continue to influence price.
Note: not financial advice.

Gold ShortThis week's focus is on Gold going short (despite it being bullish Globally). Fundamental pressure + technicals point towards it going further down. We might see gold touching 3300-3303 zone, a short bounce back from here to the 3325 zone, before it delves deep down towards the important zone at 3275. All zones confluence with fibonacci as well as shown.
Once this correction is completed, it can resume its global bull run.
Important levels to watch out for
Support: 3300-3303, 3275
Resistance: 3325, 3342-45
Happy trading!

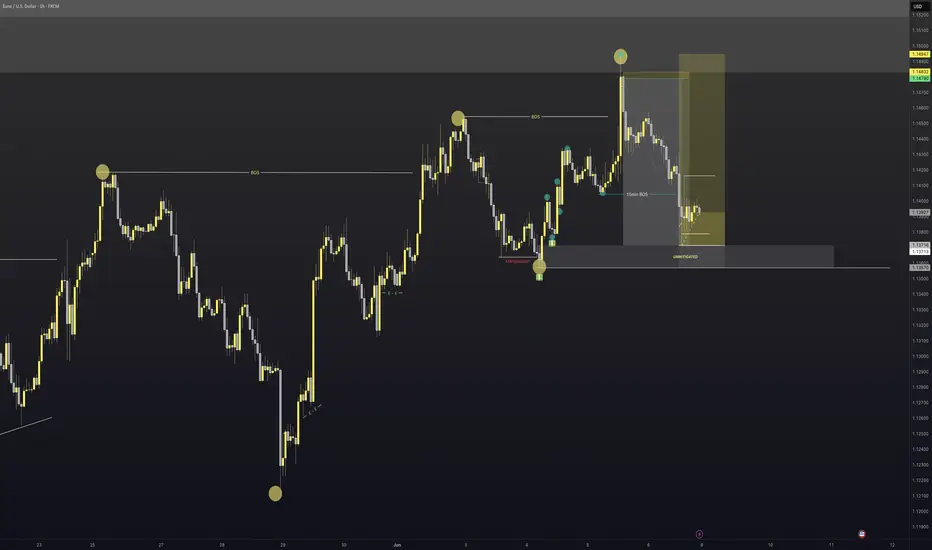
EURUSD - Where to next?I managed to catch a nice 1:21 RR on EU
I am now triggered into a long position taking price back up to the previous highs and potentially beyond.
Price is at a very key area on the HTF and we are at a key area of Supply.
As price sits I'm still expecting it to continue higher, however, if we break the 4HR orderflow to the downside there is a strong possibility price will move lower.
We will keep an eye on this one this week!
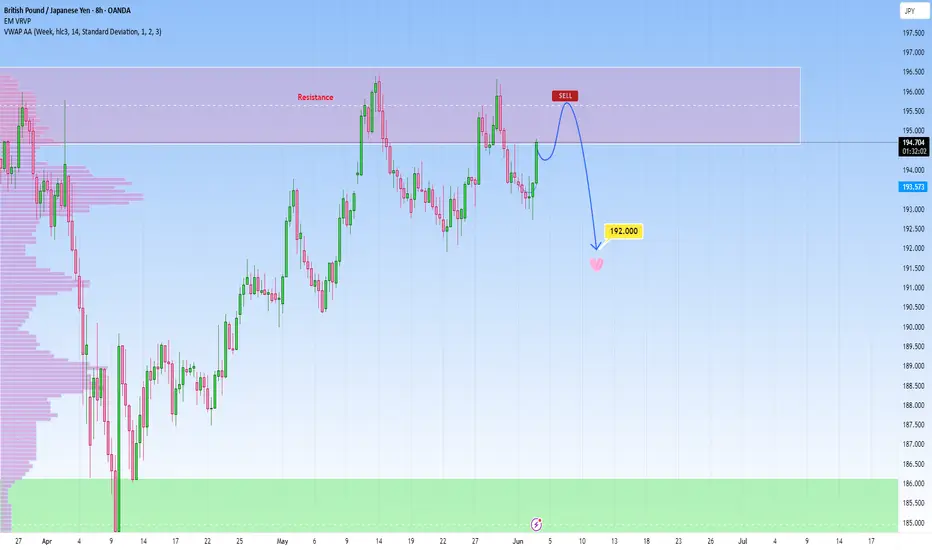
GBPUSD reaches resistance zone: Watching for potential reversalOANDA:GBPJPY has reached a pretty significant resistance level, that has been an obvious turning point in the past, with several strong reversals from the area. So naturally, I’m watching to see how price reacts here again.
If we get confirmation of rejection (what I usually watch for: like a bearish engulfing candle, long upper wicks or signs of increased selling pressure), I’ll be looking for short setups from there.
🟥 My sell idea is based on the expectation that this resistance will hold. I would be targeting a move down toward the 192.000 level, which I feel is a realistic and clean target, especially if price respects this structure again.
But if price breaks above and starts holding strong above the zone, then I’ll back off the bearish bias and reassess, and I’d consider the bearish idea invalidated, with potential for further upside 🚀
Just sharing how I see the chart right now, not financial advice 💕✨
BIOCON LIMITED KEY ZONE !!This is the Daily chart of BIOCON LIMITED.
Biocon is currently trading near its pattern resistance zone around the 340 range.
BIOCON has a strong support zone near the 300 range.
Thank You !!

RITESRITES showing good strength in recent session. And currently trading near strong hurdle. It has a strong resistance near 310-15 levels and rejected many times earlier. So if now closing above 315 may start new momentum rally in the counter which may continue for next 20-22% upwards. On lower side 270 seems very good support But closing above 315 is very crucial. I would avoid before that but surely keep a closer watch on it.
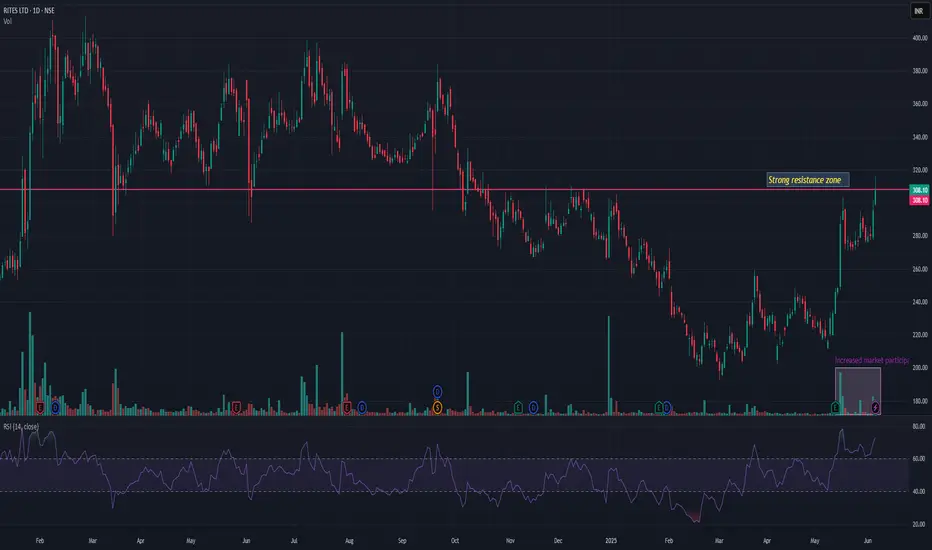
Currently in Consolidation.
Closed at 276.91 (04-06-2025)
Currently in Consolidation.
Crossing 280 would make it more
bullish; but 315 - 317 is the immediate
resistance.
If this level is Crossed with Good Volumes,
we may witness 450+

AAPL Bounce at 200 EMA- Remains in ascending channelAAPL has been in ascending price channel since August 2020. At the end of April we saw a retest of support where it temporarily broke through, tested the 200 ema, bounced, then broke back above the previous support line. I believe AAPL will remain in this channel and price will continue to rise with an eventual retest of resistance.

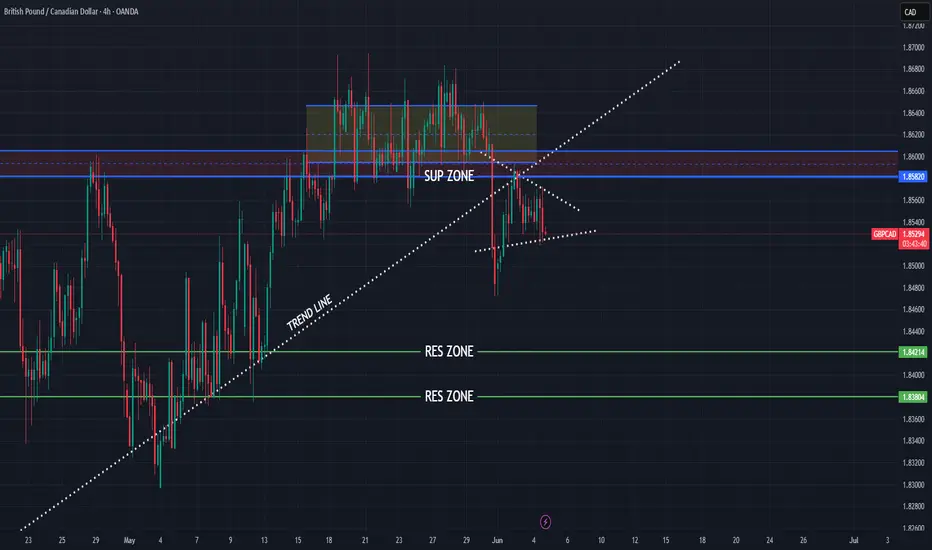
GBPCAD new bearish push expecting
OANDA:GBPCAD price break zone, currently in BEARISH PENNANT, after todays BOC event here for expect bearish push
SUP zone: 1.85800
RES zone: 1.84200, 1.83800
EURJPY higher bearish expectations from here
OANDA:EURJPY analysis before this one, is be closed, i am note will share new analysis on EJ soon.
ASCENDING CHANNEL visible, price in zone currently, after ISM events today, we are not see break of res zone 164.250, which for me having positive imact on bearish expectations here.
Trend line is breaekd and soon exxpecting to see and break of ASCEDING CHANNEL and higher bearish fall continuation.
SUP zone: 164.250
RES zone: 161.750, 160.900

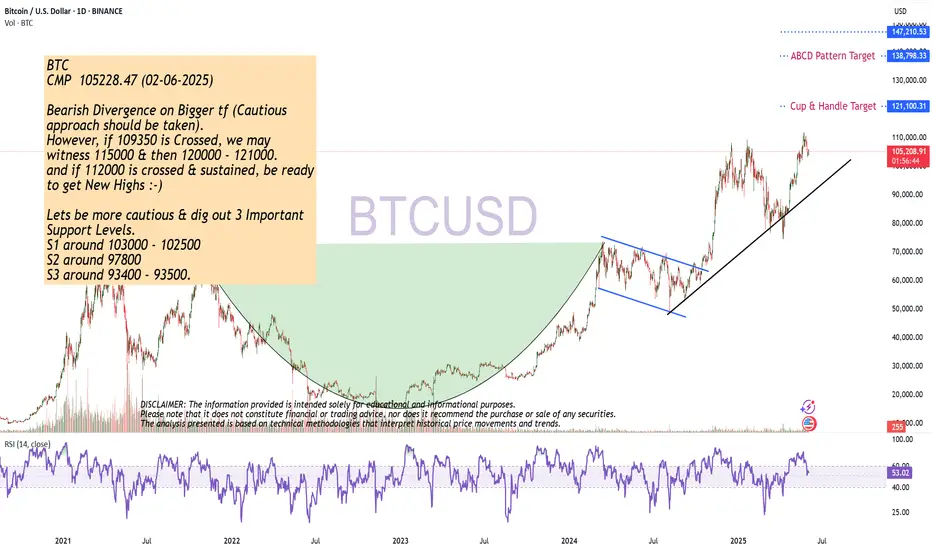
Bearish Divergence on Bigger tf
CMP 105228.47 (02-06-2025)
Bearish Divergence on Bigger tf (Cautious
approach should be taken).
However, if 109350 is Crossed, we may
witness 115000 & then 120000 - 121000.
and if 112000 is crossed & sustained, be ready
to get New Highs :-)
Lets be more cautious & dig out 3 Important
Support Levels.
S1 around 103000 - 102500
S2 around 97800
S3 around 93400 - 93500.
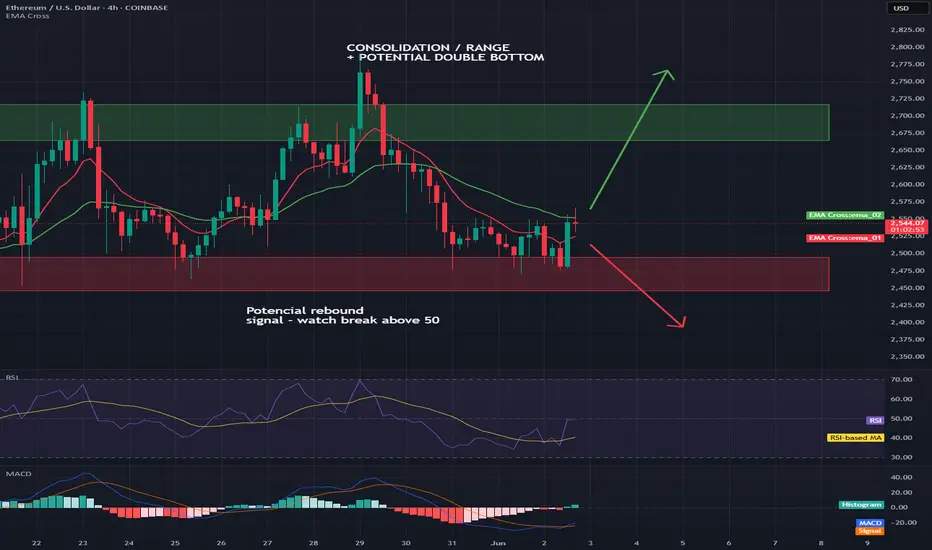
ETHUSD short-term🔍1. Technical situation
ETH/USD is in a consolidation phase — the price is moving in a rather narrow range, without a clear upward or downward trend.
📊
The upper limit of this consolidation is the resistance zone of USD 2,664–2,717 (green rectangle on the chart).
The lower limit is the support zone of USD 2,495–2,446 (red rectangle).
2. Potential formation
A potential double bottom formation can be seen on the chart, which is a classic trend reversal formation to an upward one.
The lows occurred around May 25–31 and at the end of May.
Confirmation of the formation would be a breakout of the resistance zone of USD 2,664–2,717.
3. Technical indicators
RSI:
Currently, the RSI has rebounded from zone 40 and is heading up. Exceeding the 50 level may be a signal of buyers' strength and support for the bullish scenario.
On the chart: "Potential rebound signal - watch break above 50"
MACD:
MACD is close to generating a momentum change signal (potential intersection of the MACD and signal lines).
On the chart: "MACD near signal - watch for momentum shift"
4. Scenarios for the coming hours/days
Bullish scenario (up):
✅
If the price breaks above USD 2,717 (exit from consolidation upwards), a dynamic move towards USD 2,800 can be expected.
Support for this scenario will be signals from RSI and MACD.
Bearish scenario (down):
🔻
If the price rejects the resistance zone and returns below USD 2,446, the risk of going down to the next support in the area of USD 2,300 increases.
🧠
Summary
Key Levels:
📌
Support: $2,495-$2,446
Resistance: $2,664-$2,717
Currently, the market is in consolidation with an attempt to break out to the top.
Watch for: Resistance breakout (potential bullish signal) and support reactions (potential bearish).
Pattern: Potential double bottom - needs confirmation.
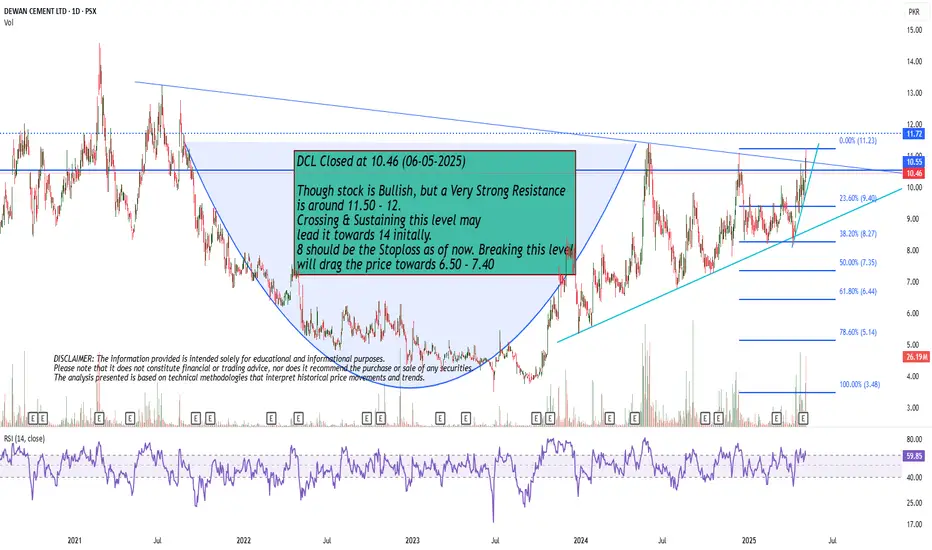
Though stock is Bullish, but
Though stock is Bullish, but a Very Strong Resistance
is around 11.50 - 12.
Crossing & Sustaining this level may
lead it towards 14 initally.
8 should be the Stoploss as of now. Breaking this level
will drag the price towards 6.50 - 7.40
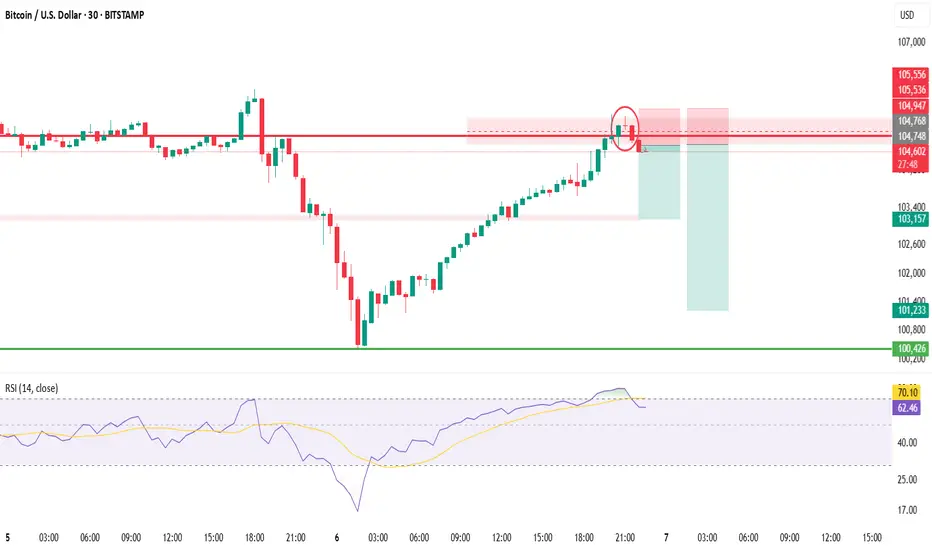
BTCUSD BUY IDEA-EASY CONFLUENCE PLAY??After reaching an all-time high (ATH) last week, Bitcoin is currently positioned at a pivotal $105,484 at the .23 level according to the Fibonacci trend. It has retraced to previous highs around $105,000 to $106,000. Recently, it bounced off the support level of approximately $102,740 on the 4-hour and daily charts and seems to be forming higher lows. I believe we could see a confluence play that aligns with the previous price action that led to the ATH.

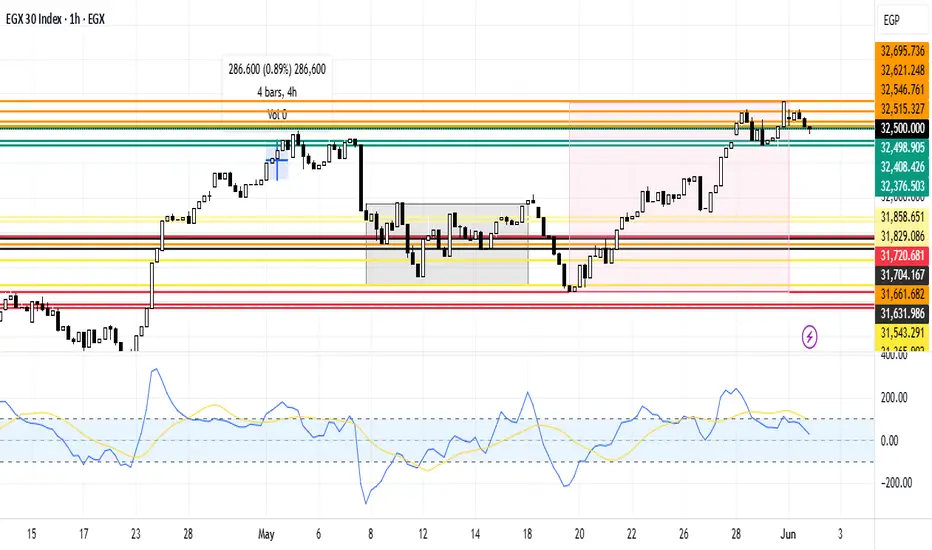
EGX30 Current Region AnalysisEGX30 stock is currently in a neutral region. In case of falling, it's expected to break the support line 32,498.905 to reach then 2nd at 32,408.426 then the third at 32,376.503. In case of rising, it's expected to breach the resistance line 32,546.761, to reach then 2nd at 32,621.248 then the 3rd at 32,695.736
HBAR (Local) Elliot Wave ii UnderwayHBAR appears to have completed a leading diagonal for wave 1 after finding a bottom at the major support high volume node (HVN).
Wave 2 has retraced the expected 61.8% Fibonacci but alt coins have their own Golden Pocket at the 78.6% retracement which aligns with the S1 pivot and high volume node.
The descending resistance line has been tested as support leaving a doji but does not look strong enough to be the bottom yet.
Wave 3 should be a powerful move up.
This analysis is invalidated below macro wave 4 -$0.12556
Safe trading
