How to Draw Support & Resistance In TradingViewLearn how to effectively identify, draw, and utilize support and resistance levels in TradingView with this comprehensive step-by-step tutorial. Whether you're a beginner trader or looking to refine your technical analysis skills, this video covers everything you need to know about one of the most fundamental concepts in trading.
What You'll Learn:
Understanding support and resistance: the foundation of technical analysis and price action trading
Step-by-step instructions for drawing horizontal support and resistance lines in TradingView
Creating support and resistance zones for more flexible trading approaches
Practical tips for using TradingView's drawing tools effectively
This tutorial may be helpful for day traders, swing traders, and investors using TradingView who want to improve their chart analysis skills. The techniques covered could help you make more informed entry and exit decisions by understanding where price might find support or encounter resistance.
Visit Optimus Futures to learn more about trading futures with TradingView: optimusfutures.com
Disclaimer:
There is a substantial risk of loss in futures trading. Past performance is not indicative of future results. Please trade only with risk capital. We are not responsible for any third-party links, comments, or content shared on TradingView. Any opinions, links, or messages posted by users on TradingView do not represent our views or recommendations. Please exercise your own judgment and due diligence when engaging with any external content or user commentary.
This video represents the opinion of Optimus Futures and is intended for educational purposes only. Chart interpretations are presented solely to illustrate objective technical concepts and should not be viewed as predictive of future market behavior. In our opinion, charts are analytical tools—not forecasting instruments. Market conditions are constantly evolving, and all trading decisions should be made independently, with careful consideration of individual risk tolerance and financial objectives.
Supportandresitance

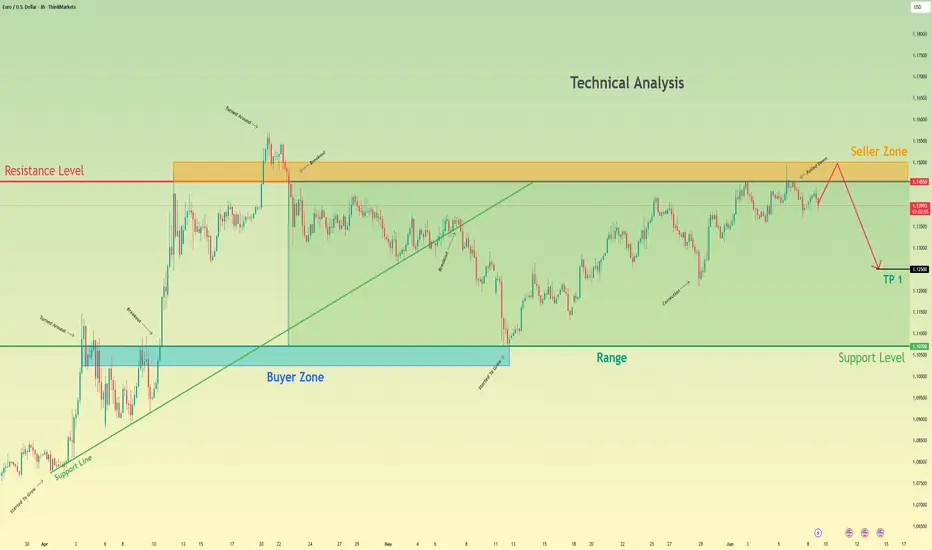
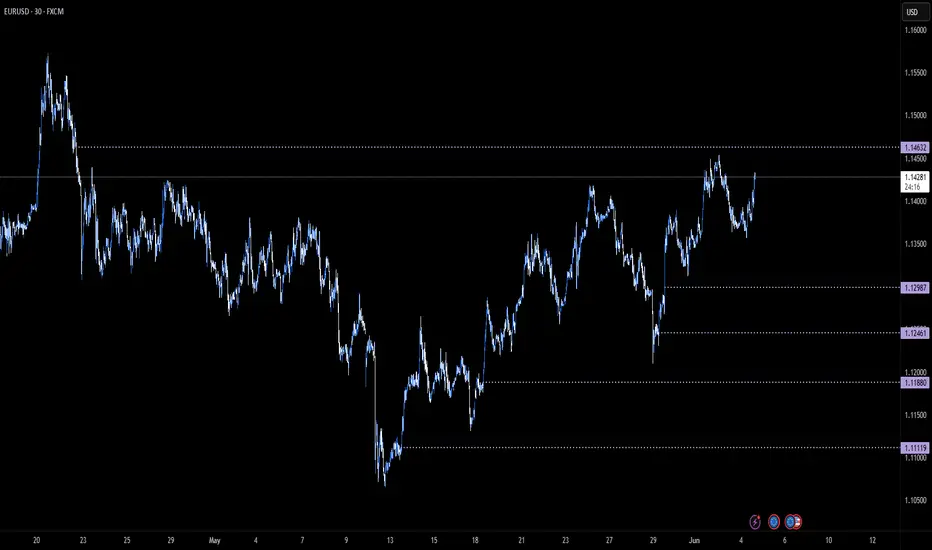
Euro may reach seller zone and then continue to declineHello traders, I want share with you my opinion about Euro. In this chart, the price started to grow, bouncing from the support line, and soon reached the support level, which coincided with the buyer zone. Then it declined to support line, making the correction and then made an impulse up from this line to the resistance level, breaking the 1.1070 level. After this movement, the Euro made a correction and then continued to grow and broke the resistance level, which coincided with the seller zone, and even rose higher than the seller zone. But soon Euro turned around and started to decline and broke the 1.1455 level again, after which it declined to the support line inside the range. Price little grew near this line, but later broke the support line and continued to decline. It fell to the support level, which is the bottom part of the range, and then started to grow. Euro later reached the top part of the range, which is the resistance level, and not long time ago turned around and started to decline. So, after looking for this chart, I think that the Euro may enter to seller zone and then continue to decline inside the range. For this case, I set my TP at 1.1250 points. Please share this idea with your friends and click Boost 🚀
Disclaimer: As part of ThinkMarkets’ Influencer Program, I am sponsored to share and publish their charts in my analysis.
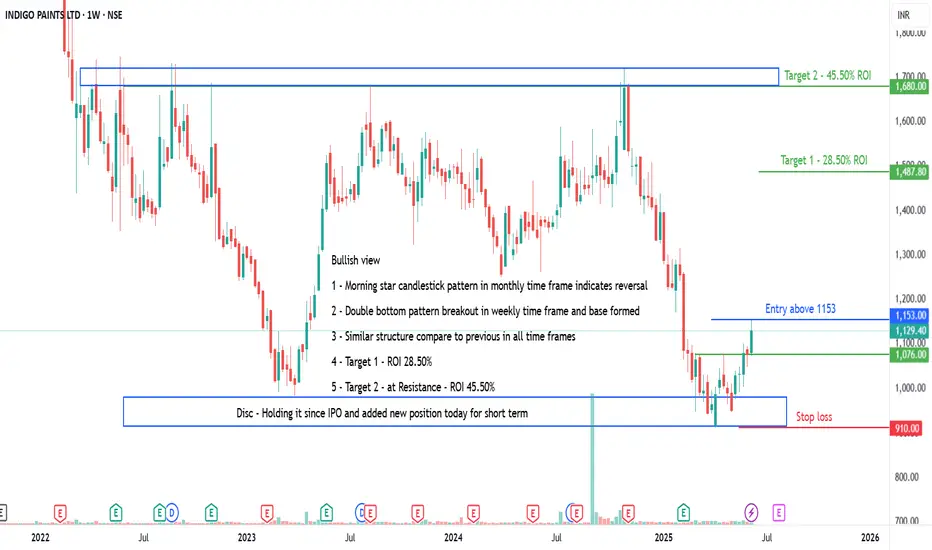
INDIGOPNTS - Bullish view potential of 28 to 45% ROIAll details are given on chart for educational purpose only. If you like the analyses please do share it with your friends, like and follow me for more such interesting charts.
Disc - Am not a SEBI registered analyst. Please do your own analyses before taking position. Details provided on chart is only for educational purposes and not a trading recommendation
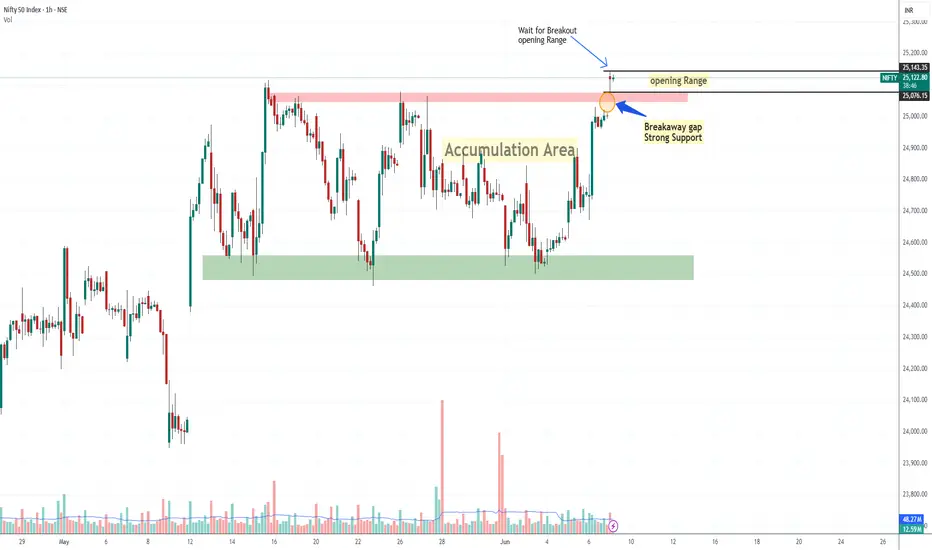
Nifty Gave Breakaway Gap Strong Bullish SignalWhat is Breakaway GAP?
A breakaway gap refers to the situation in the market where there is a strong price movement that crosses support or resistance. Breakaway gaps are formed after substantial periods of consolidation of prices in the market. It signifies a break from the previous trading range or pattern, and it suggests that a new trend or direction is emerging.
Nifty was trading in a range for 5 days and today 6/09/2025 it gap up and sustained above 25000 crucial level, the importance of break-away gap is that it's very strong sign of bullishness in market this also strong support too so if nifty come to retrace it would become support around 25000 level,
if nifty break today opening rang then it's very likely that it will go further so there are possibly Two entry Sign for Long: - first, OR breakout, second: -retracement on 15 Min chart near 20 Ema -50 Ema. Thats My opinion
AAPL Ascending Price ChannelAAPL has been in ascending price channel since August 2020. At the start of April we saw a retest of support where it temporarily broke through, tested the 200 ema, bounced, then broke back above the previous support line. Since then it has retested support 3 separate times which is a strong indication that AAPL will continue to remain in this price channel for the foreseeable future.

Profit Target/Reverse on EUR/USDOld volume accumulation from April about to be approached at 11463 area. This area should be a natural resistance and a good take profit on buy trades.
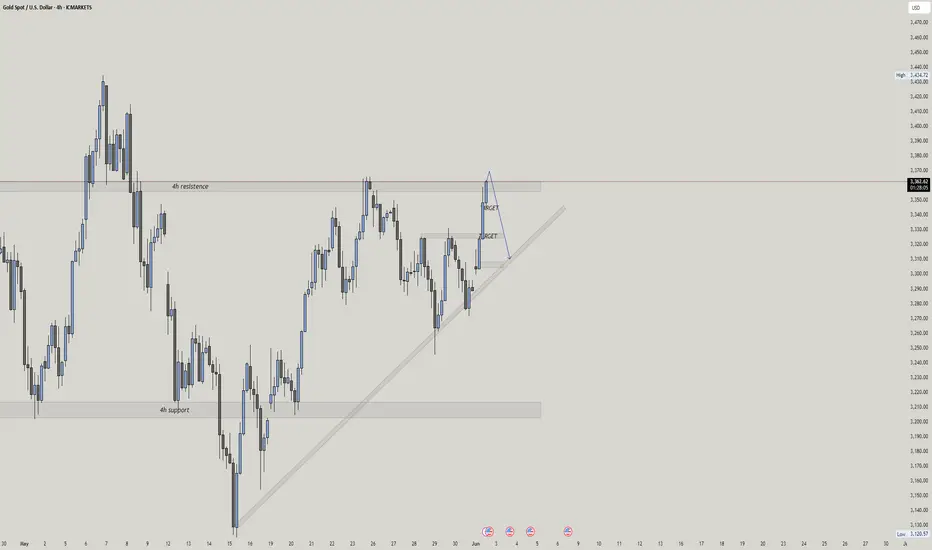
XAUUSD – Bearish Rejection from 4H Resistance | Trendline RetestGold (XAUUSD) is currently reacting to a well-respected 4H resistance zone. After a bullish push, the price is showing signs of rejection, suggesting a potential pullback toward the trendline support.
📌 Trade Idea:
Bias: Short-term bearish
Entry Zone: Near current resistance area
TP1: Minor support zone
TP2: Ascending trendline (watch for reaction)
SL: Above the resistance zone (invalidate on bullish breakout)
🧠 Confluences:
Strong historical 4H resistance
Clear market structure with higher lows
Trendline acting as dynamic support
Bearish reaction expected before continuation
⚠️ If price breaks and holds above resistance, this bearish idea becomes invalid. In that case, look for bullish continuation.
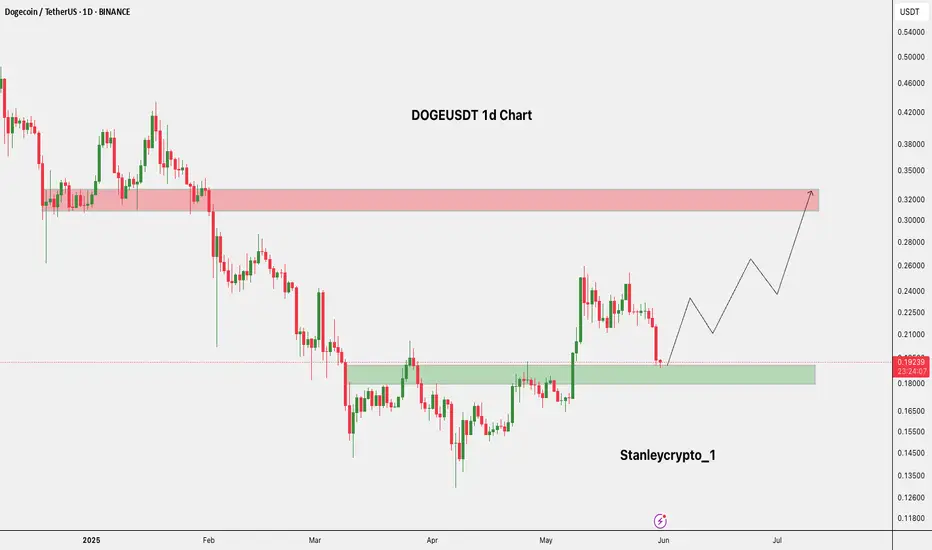
$DOGE At Key Support Reversal Ahead?The DOGEUSDT 1D chart shows price testing a strong support zone around $0.18–$0.19.
If this level holds, a bullish reversal could push DOGE toward the $0.32 resistance area.
The setup suggests a potential uptrend with higher highs, but a breakdown below support may invalidate this move.
DYRO, NFA
NVDA: Ascending triangle break, bull flag on S/R retestHey traders! I'm back and once again, I've spent almost the whole evening (lol) trying to figure out the odd, strange price action we've seen from NASDAQ:NVDA over the past few weeks, and especially today!
As we all know (I assume), Nvidia failed to disappoint on earnings once again, and we saw a HUGE gap up overnight, as far as up to the $143 mark. However, we soon began to see a dip. That's fair, as traders will likely sell and take profit.
However, the dip became a larger dip, and Nvidia finished the day basically at 3.2%. But it seems that the pullback may been pretty healthy.
Because as you can see from the chart, Nvidia has been forming an ascending triangle ever since the 14th May. That was after the sweet run it had prior to that. It has tested the £136-137 area as a major resistance line ever since until finally, a strong earnings report sent Nvidia above the line.
After the gap up, throughout the day, the stock went into a controlled, composed downward channel which what we like to call, a bull flag. This is taking into consideration market hours, not extended hours. This bull flag is bullish in its own way, but it is also a sign of a retest of the $136-137 resistance zone. This is officially a support zone now.
A successful retest from this support zone will cause a bounce, especially from the support trendline, and likely send the stock towards $140+, possibly extending its reach to $150 if broader market strength (Nasdaq) continues.
On the contrary, a dip below the support line and a crash below the red support trendline, would likely send the stock lower to $133 as next support.
As long as Nvidia maintains $136-137, the bulls are in control.
Note: Not financial advice. Please do your DD.

Review and plan for 23rd May 2025 Nifty future and banknifty future analysis and intraday plan.
Quarterly results
This video is for information/education purpose only. you are 100% responsible for any actions you take by reading/viewing this post.
please consult your financial advisor before taking any action.
----Vinaykumar hiremath, CMT

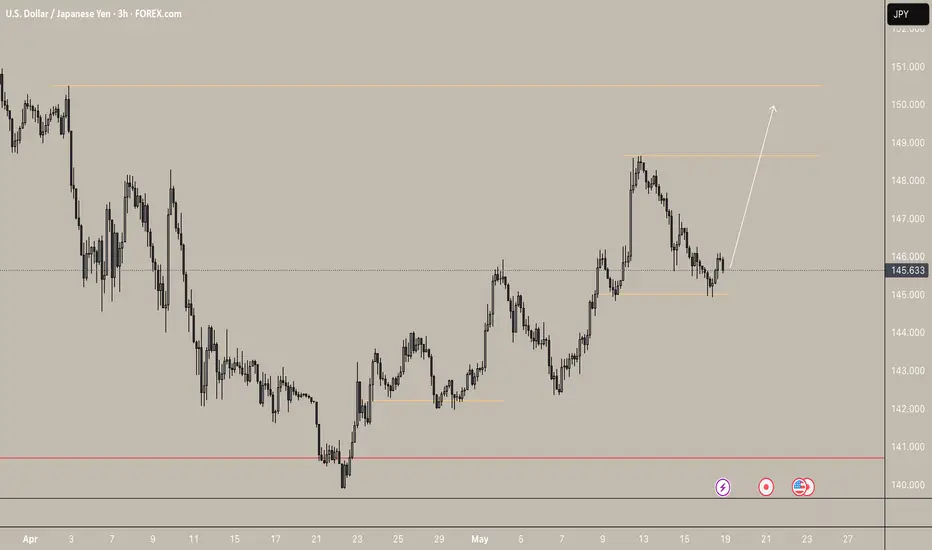
USDJPY Bullish Breakout Setup – Retest at Key Demand ZoneUSDJPY is respecting a clean bullish structure after rebounding from the 140.100 base. Price made a higher high near 148.650, followed by a pullback into the previous demand zone around 145.000.
Technical Breakdown:
Market Structure: Higher highs and higher lows indicate a strong uptrend.
Demand Zone: Clean reaction from the 145.000 zone, which previously acted as resistance-turned-support.
Target Zones:
First TP: 147.900 (previous swing high)
Final TP: 150.600 (key resistance level)
Invalidation Level : Close below 144.800 could invalidate this bullish scenario.
If price sustains above 145.000, the bullish trend is likely to continue.
As always, manage risk carefully.
Like & Follow for more clean, high-timeframe breakdowns!
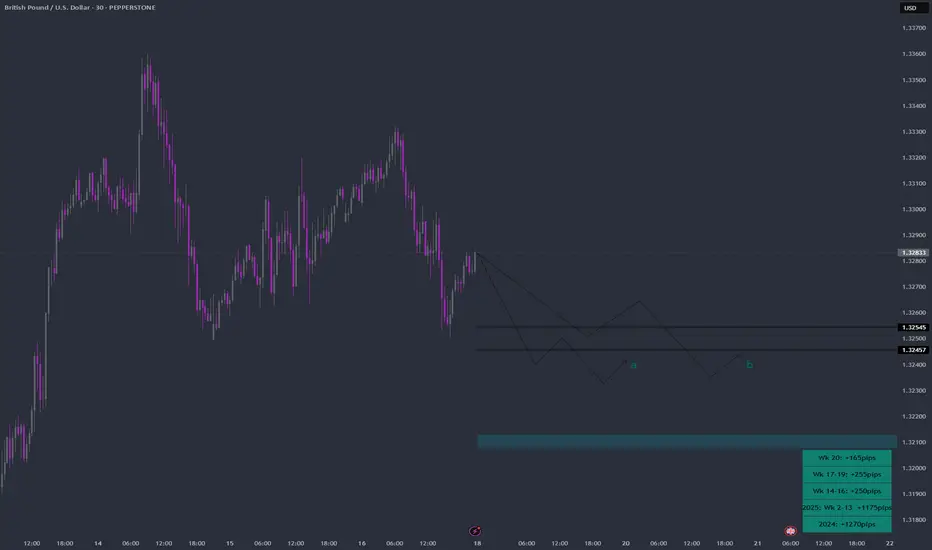
GBPUSD Week 21 Swing Zone/LevelsNot Always.
Not always will price conform to hypothesis, but in following good RRR success is assured.
We setup week 21 levels and zone as shown with the predicted pathways.
Trade Parameters: Entry on 5 mins chart
Sl 10-15pips
TP usually dynamic but typically 5x
Follow on for trade updates.
As Always PRICE determines trades
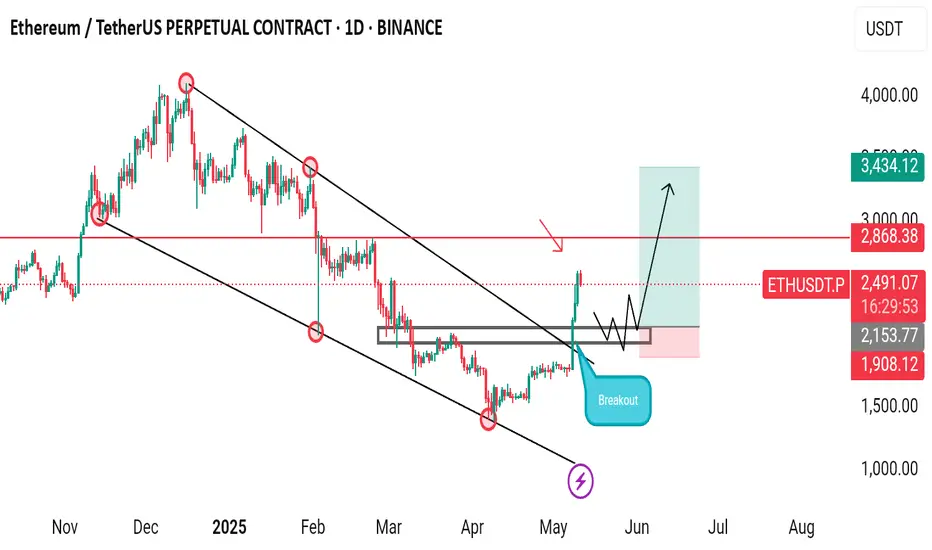
Is ETH - Next 3,000?ETHUSDT – Market Insight & Price Structure
Ethereum has been shaping a falling wedge pattern over the past 2 to 3 months—a structure that typically suggests a bullish reversal. Recently, price action confirmed a breakout above the key resistance zone between $2034 and $2040, along with a clean break of the upper trendline of the wedge. These movements point to a strong bullish signal, suggesting potential continuation to the upside.
Currently, Ethereum is approaching a significant resistance level around $2860. If price reaches this zone, we’ll be watching closely for confirmed reversal signals to consider a potential short/sell setup.
On the other hand, the primary bullish trend trade remains valid near the $2160–$2150 support range. A long position will only be considered upon confirmation, such as a bullish engulfing candlestick pattern, market structure shift (MSS), or other trusted technical signals.
Disclaimer: This is not financial advice. Always do your own research (DYOR).
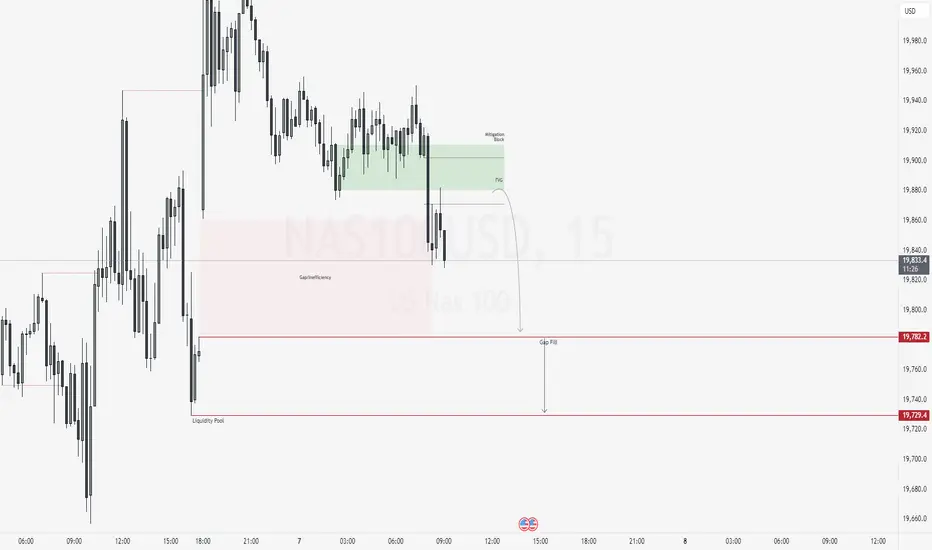
NAS100USD: Volatility Opens Door for Sell Setup in NY SessionGreetings Traders,
As we enter the New York session—a period known for heightened volatility—we note that NAS100USD remains in a broader bullish environment. However, current price action suggests the potential for a short-term reversal, prompting us to explore selling opportunities.
Key Observations:
1. Bearish Internal Structure Developing:
Despite the overall bullish trend, internal price action reveals a sequence of lower lows, indicating the formation of a bearish microstructure. This internal weakness is reflected in the way bearish arrays—such as mitigation blocks and fair value gaps (FVGs)—continue to act as resistance zones.
2. Mitigation Block & FVG Alignment:
Recently, price delivered a strong displacement to the downside, followed by a retracement into a mitigation block that aligns with a fair value gap. This confluence reinforces the bearish bias and suggests institutional selling may be active in this zone.
3. Downside Targets – Gap Fill & Liquidity Pools:
The first downside target is a nearby inefficiency (gap) in price action, which the market often seeks to fill. The second target lies below, where sell-side liquidity pools are likely resting.
Trading Plan:
Monitor price behavior within the current resistance zone. If confirmation of continued bearish momentum appears, short positions targeting the aforementioned levels may be viable.
Stay focused and wait for confirmation before committing to any positions.
Kind Regards,
The Architect
Lower Locked at 58.40 today.
Lower Locked at 58.40 today.
58 is an Important Support but
if it is not respected we may witness
price around 48.
as mentioned earlier, it should stay above 36
otherwise extreme selling cab be seen.
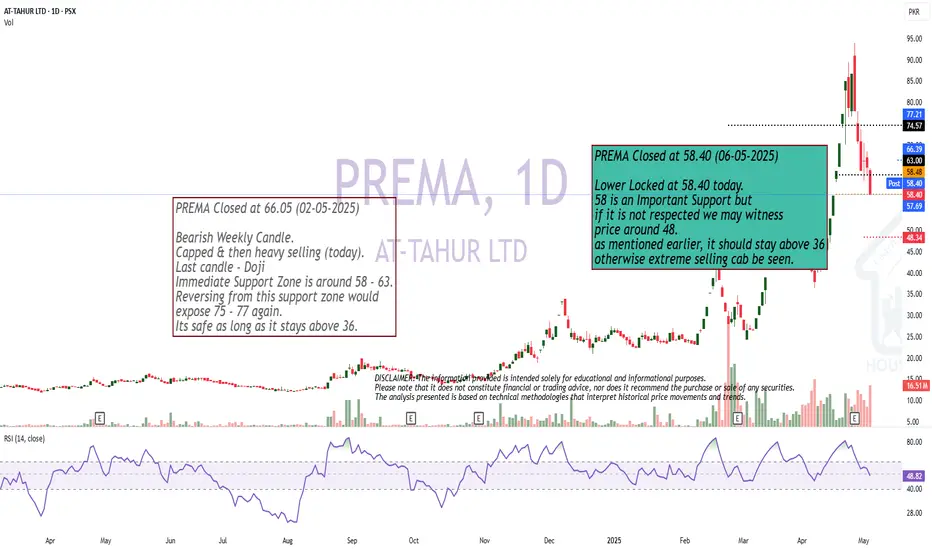
Bearish Weekly Candle.Bearish Weekly Candle.
Capped & then heavy selling (today).
Last candle - Doji
Immediate Support Zone is around 58 - 63.
Reversing from this support zone would
expose 75 - 77 again.
Its safe as long as it stays above 36.

WTI TRADE UPDATEhi all
Based on the current situation for WTI, with the stop loss hit from the previous trade idea, Plan A now relies on a breakout of the trendline and the support turning into resistance as confirmation for taking a long position.
However, if rejection occurs at the trendline or at the support-turned-resistance level, there's a possibility that the price will decline again, given that a breakout has already happened on the daily timeframe. Therefore, closely monitoring price movements around these key levels is crucial before making any trading decisions.
Ensure strong confirmation before acting, and keep an eye on shifts in market structure. Feel free to share any new updates, and best of luck with your strategy!
good luck all
**My trading strategy is not intended to be a signal. It's a process of learning about market structure and sharpening my trading my skills also for my trade journal**
Thanks a lot for your support

XAUUSD Technical Analysis: Bullish and Bearish ScenariosGold (XAUUSD) has exhibited a strong bullish impulse, breaking out of established channel structures. Following a sharp ascent, the price action has entered a consolidation phase near recent highs. This analysis explores potential scenarios based on technical patterns, key levels, and underlying market psychology.
Chart Analysis and Market Psychology
The chart displays a distinct uptrend characterized by ascending channels. Recently, XAUUSD experienced a significant upward thrust, breaking decisively above the shorter-term orange channel. This move reached the projected target derived from this channel's height, near the 3405 level.
Following this peak, price action has formed a tighter consolidation range. This pattern, occurring after a sharp rally and on potentially decreasing volume (as is common in such formations), resembles a bullish continuation pattern, such as a pennant or flag. From a market psychology perspective, this suggests a temporary equilibrium:
Buying Pressure: Bulls who drove the initial breakout may be pausing, absorbing profits taken by earlier entrants, or accumulating new positions in anticipation of further upside. The sharp nature of the preceding rally indicates strong underlying demand and potentially FOMO (Fear Of Missing Out) among participants.
Selling Pressure: Sellers are attempting to cap the rally, potentially taking profits or initiating short positions. However, the observation that dips below 3259 were quickly bought suggests that selling pressure has been relatively weak compared to the buying interest defending this level. This rejection indicates that market participants still perceive value at or above this zone, viewing it as a potential support level following the breakout.
The key level currently in focus appears to be around 3259. The price interaction with this level could be crucial in determining the next directional move.
Bullish Scenario
Conditions: For a bullish continuation, the price would ideally need to hold above the 3259 support level. A decisive breakout above the upper boundary of the current consolidation pattern would serve as confirmation.
Psychology: This outcome would suggest that the consolidation phase was indeed accumulative, with buyers absorbing selling pressure and preparing for the next leg higher. It would reinforce the "impatient bulls" and "weak bears" narrative.
Potential Targets:
A retest of the recent highs near 3405.
The target derived from the breakout of the medium-term turquoise channel, located near 3640.
Given the aggressive nature of the preceding rally, an overshoot towards the higher projection at 3839 might become a possibility if bullish momentum remains exceptionally strong after breaking 3640.
Bearish Scenario
Conditions: A failure to hold the 3259 level, coupled with a break below the lower boundary of the consolidation pattern, could signal a potential reversal or a deeper pullback. This might involve price re-entering the previously broken orange channel.
Psychology: This scenario would suggest that the buying pressure was insufficient to sustain the breakout, potentially indicating a "bull trap" or simply a more significant profit-taking wave overwhelming demand at current levels.
Potential Support Zones:
The upper trendline of the orange channel (acting as support after being resistance).
The primary uptrend line (lower boundary) of the orange channel.
The channel line (upper boundary) of the broader turquoise channel, which could coincide with the orange channel's lower boundary, potentially forming a confluence of support.
Concluding Remarks
XAUUSD is at a potential juncture following a strong bullish breakout. The current consolidation pattern holds the key to the next immediate move. Holding above 3259 and breaking the consolidation high could pave the way for further upside towards targets at 3640 and potentially 3839. Conversely, a failure to maintain support at 3259 might trigger a pullback towards the support levels defined by the underlying channel structures. Traders often watch volume closely during the resolution of such patterns for confirmation.
Disclaimer: This report is for informational and educational purposes only and does not constitute financial advice or a recommendation to buy or sell any asset. Trading involves risk, and decisions should be based on your own research and risk tolerance.

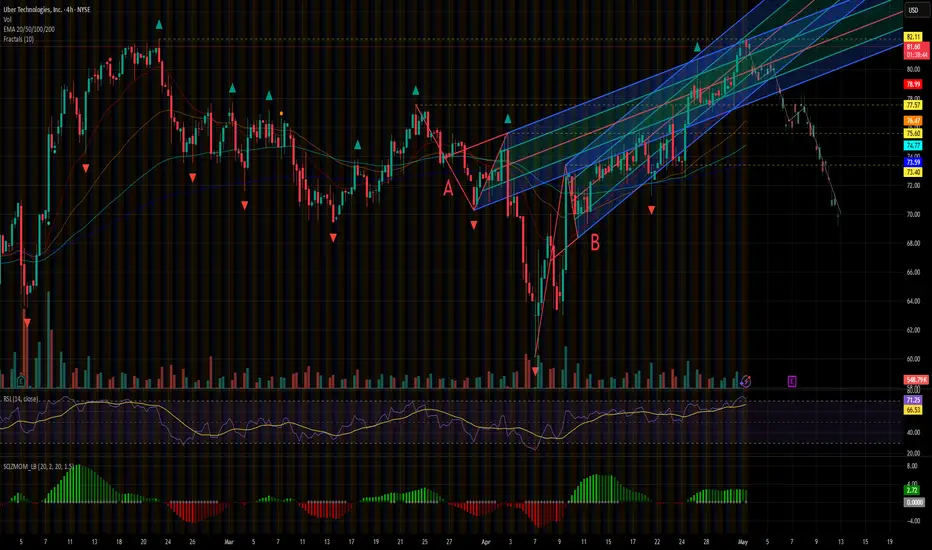
Fall Down to $70 ApproachingWith the RSI above average since mid-April 2025, the trend has been steadily rising up to $82 per share even breaking the highs from late February and March.
Price projected onto both (A and B) Inside pitchforks is well above the median line. In the pitchfork A the price is even directly touching the upper parallel line.
Reversal near the highest achieved price this year on 21st February is probable
Based on these indications, we can expect a fall to around $70 somewhere in the middle of May.
Key details:
RSI over "overbought" level
Price in both Inside pitchforks near the upper parallel line
Longer uptrend = breakdown necessary
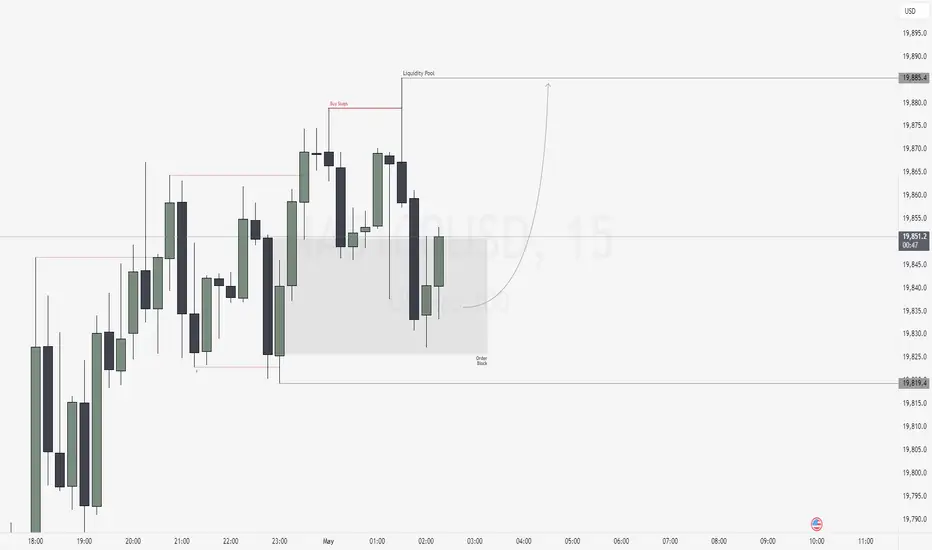
NAS100USD: Bullish Scalping Opportunity from SupportGreetings Traders,
In today’s analysis of NAS100USD, we identify bullish institutional order flow, and as such, we aim to align with this narrative by seeking buying opportunities.
This setup presents a scalping opportunity on the lower timeframes, with price currently reacting to a bullish order block serving as a key institutional support zone. Upon confirmation, we anticipate a move toward the liquidity pool in premium pricing, which will serve as our target zone for profit-taking.
As always, remain disciplined, wait for clear confirmation, and manage risk accordingly.
Kind Regards,
The Architect
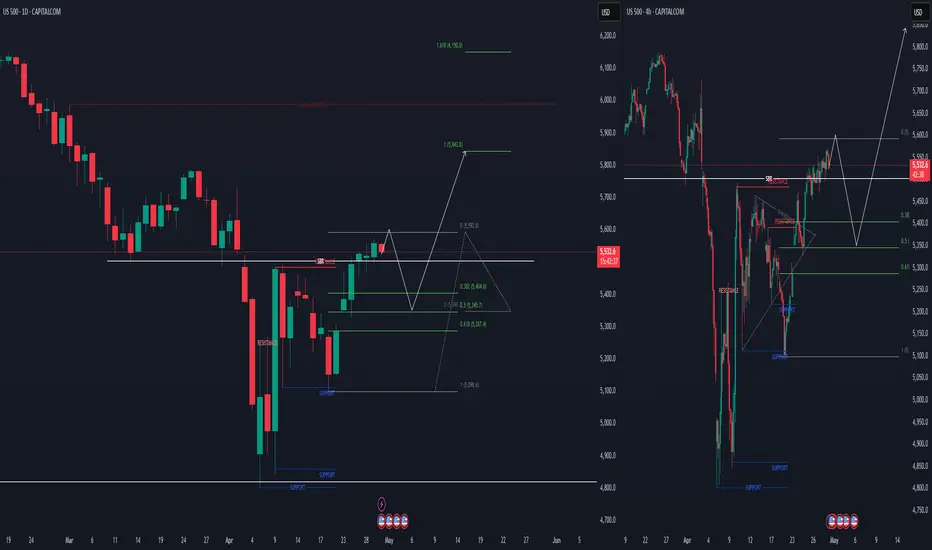
US500 TRADE IDEAhi again
The US500 has shown strength by breaking the resistance at 5483.5 and is now at 5535. If the price reaches 5604.6 and a pullback occurs, targeting a temporary decline at the 50% Fibonacci retracement level is a good strategy.
Fibonacci retracement is often used to identify potential support and resistance levels where the price might pause or reverse. The 50% level is one of the commonly watched levels by traders as it often indicates a significant turning point in price movement.
good luck all
**My trading strategy is not intended to be a signal. It's a process of learning about market structure and sharpening my trading my skills also for my trade journal**
Thanks a lot for your support
OIL TRADE IDAHello
Hi everyone. Regarding oil movements, I see a long opportunity at the level of 59.61. If the price closes below 58.56, there is a possibility of a temporary rise before continuing to drop to 55.
good luck all
**My trading strategy is not intended to be a signal. It's a process of learning about market structure and sharpening my trading my skills also for my trade journal**
Thanks a lot for your support

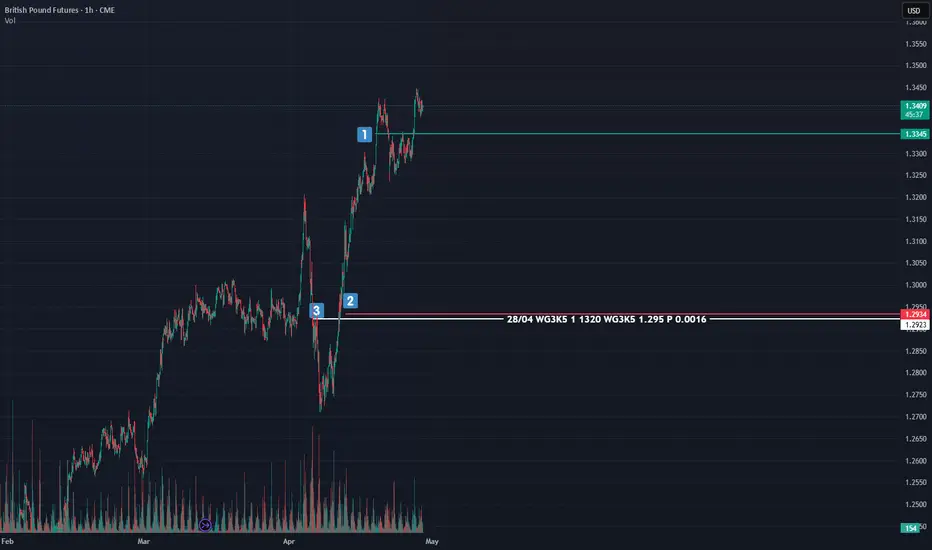
Game-changing analysis technique that will elevate your strategyAs many of my loyal followers know, my analysis toolkit goes beyond just the standard fare of CME options data and COT reports. I dive deeper, utilizing additional filters like the average long and short positions of retail traders. These insights are publicly available, and while I won’t name specific sources to avoid any hint of hidden promotion, I’ll give you a clue: look for a website with the word "book" in its title. 📚
For years, I’ve relied on this data, and it has proven to be both reliable and insightful. The average positions of market participants serve as both filters and indicators. But what do I mean by indicators?
Let’s break it down. When the price interacts with these levels, it reveals the market sentiment. For instance, if the price is below the average long position and breaks through easily, it’s a bullish sentiment. Conversely, if it hovers below the level and struggles to break through, that’s still bullish, as it indicates buyers are being drawn into profitable territory.
Now, let’s flip the script for the bears: if the price breaks down from above or struggles below the average short position, that’s a bearish sentiment. The price isn’t responding to sellers, dragging them into a profit land.
There’s more. Often, you’ll notice different behaviors near these key levels, allowing you to enter positions with an incredible risk/reward ratio of 3:1, 5:1, or even better! This clarity gives you insight into the current market mood—who’s being punished and who’s favored at that moment.
Now, let’s take a look at the screenshot of the British Pound futures chart. Here’s what you’ll see:
- A green line representing the average long position of retail traders.
- A red line for the average short position.
- The breakeven point of a put option contract for the June futures expiring on May 22, with 1,320 contracts at a strike of 1.295.
Take a moment to study the chart. What do you observe? 🤓
Ok, breathe in, breathe out. Tomorrow, we’ll dive deeper into this analysis. Don’t forget to subscribe so you won’t miss the continuation of this story! The insights I’ll share are definitely worth your time, as I aim to shift your perspective on the market by demonstrating a clear methodology without relying on indicators or technical patterns.
Stay tuned; it’s going to be incredibly valuable! 🚀✨